
Dancing Markets
The markets are always dancing around on a Fed Wednesday, and often the volatility spills over into Thursday. Lets take a look at the charts and see what we can see.
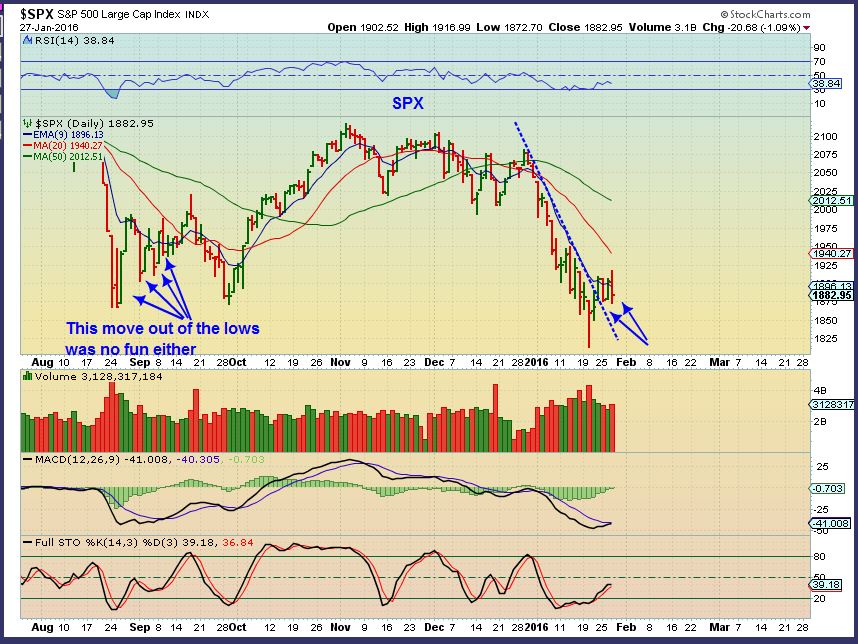
SPX – The markets sold off after the Fed Decision. I called for lows recently and I still expect higher prices to develop from a bounce. You can see that this is how the markets moved coming out of the lows in August too. I do not expect the recent lows to be broken, but a little more downside is not out of the question. Please notice how difficult it would have been to trade the Lows in August/ September.
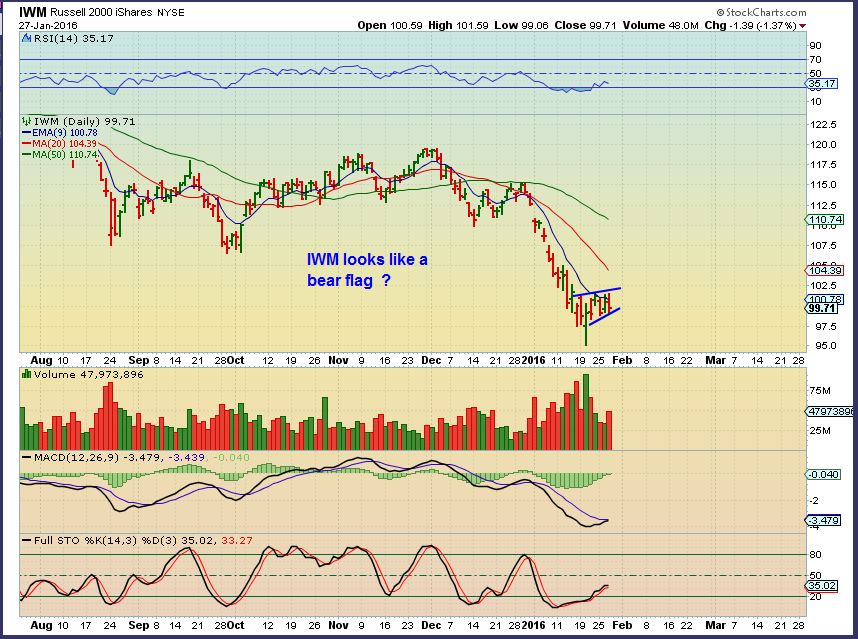
That being said, the RUT / IWM looks like a bear flag, so lets look at a few other areas.
Lets look at the NASDAQ…
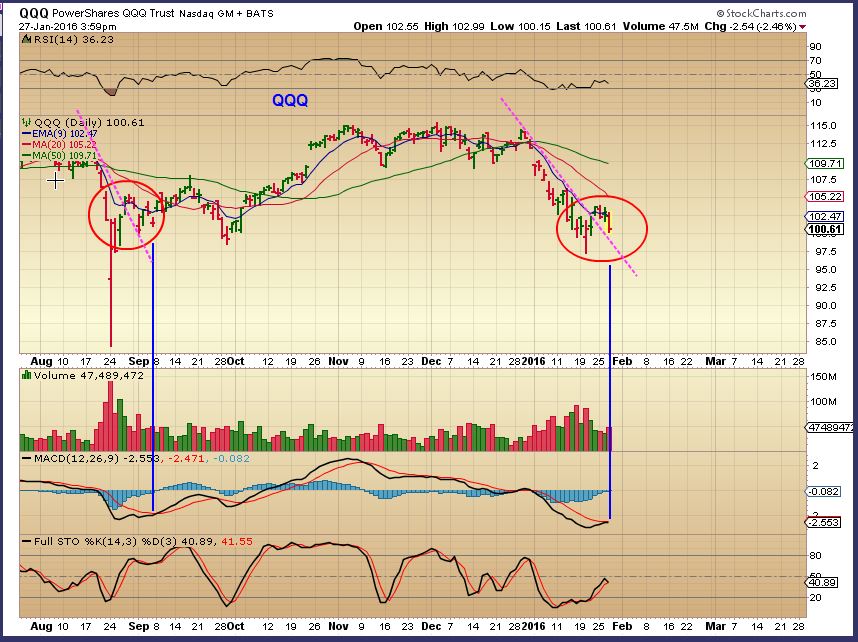
QQQ – This does look like a place that the selling could dry up.
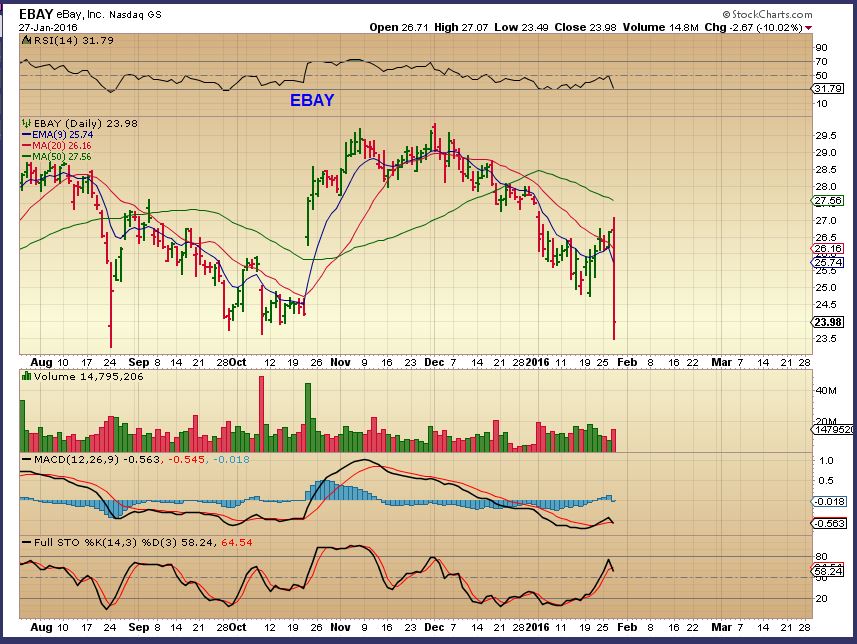
I should mention that we are in an earnings environment, and its not like the good ole days when earnings were embraced simply because the company name was Apple or EBAY. Those charts are actually not looking very healthy .
I grabbed a chart of EBAY when earnings came out and somehow caught this crazy candle. 2 minutes later it was gone, but this may be what todays chart looks like.
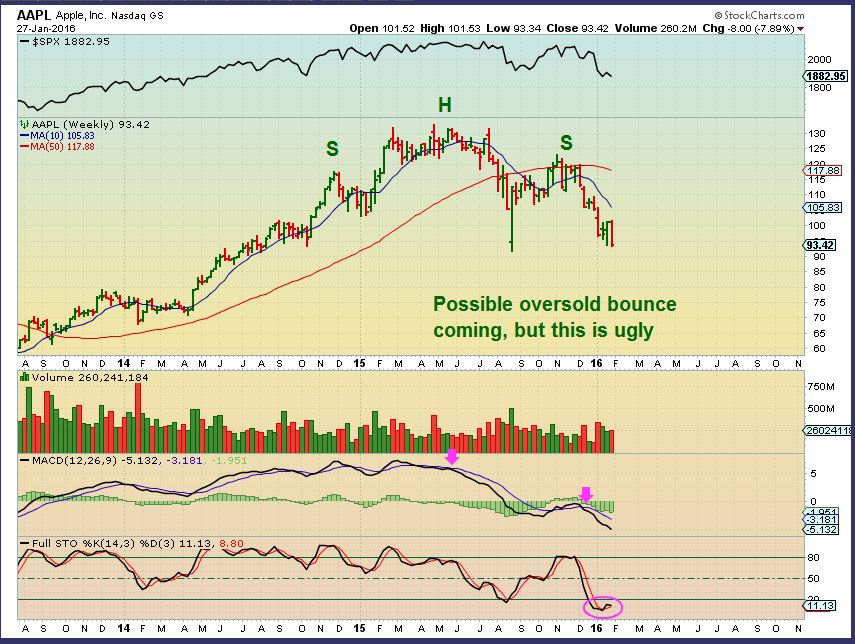
AAPL WKLY – Not as pretty as it used to be
Other companies that sold off with earnings were JNPR, AAPL, BA, X, . Pops after hrs were HA, TER, FB, UA ( up 14%)
SO I have been saying that I expect a bounce / Rally , but I believe we are seeing changes where Markets may be setting up for another big drop. This may lead to a change in the Precious Metals bear market.
IWM – Oddly , this looks like a bear Flag. Remember that the Russell 2000 hardly bounced in the August crash. This needs to move higher rather quickly if markets are going to bounce.
So we see a bit of a mixed picture. I checked the VIX and Put/Call Ratio, etc and still feel that we are set up for a bounce, but caution is always warranted (Stops) when trading around lows.
.
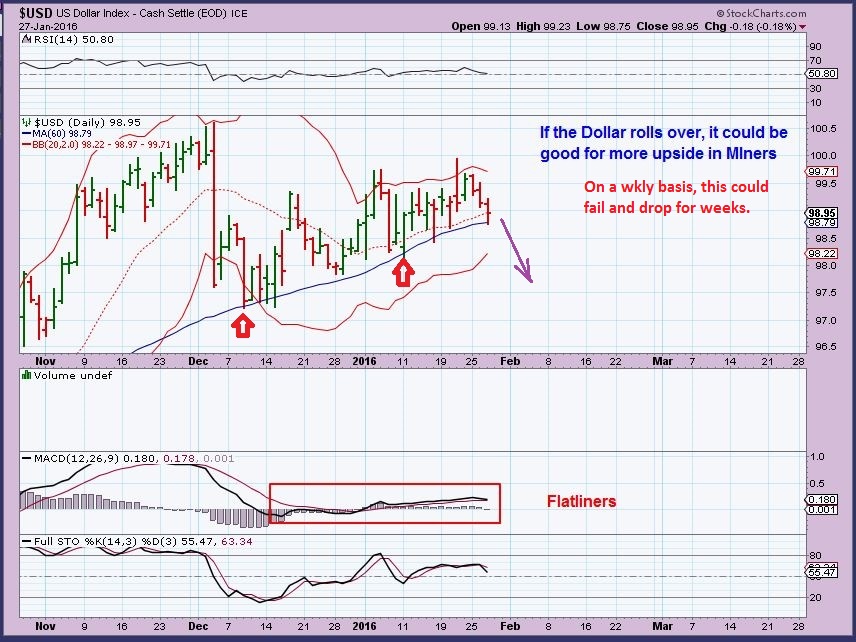
USD – The dollar looks weak and has a good amount of downside if it breaks ( shown on yesterdays chart).
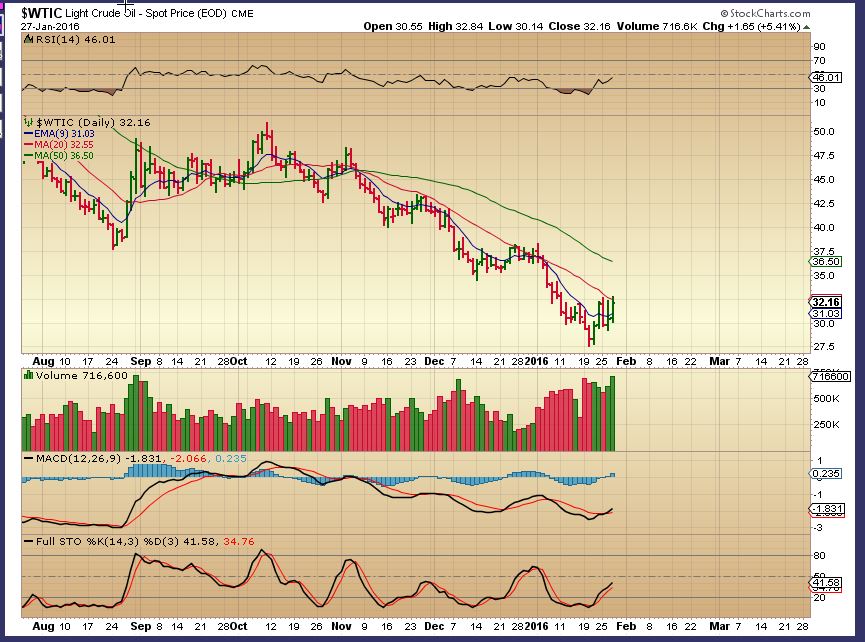
WTIC – Oil looks like it wants to finally break above the 20sma, but until it closes there and adds to gains, it remains unclear to me if this is a bounce or bottom. This chart looks Bullish a a glance.
.
NATGAS – No change. The longer it lingers, the less interested I get. It needs to prove itself.
.
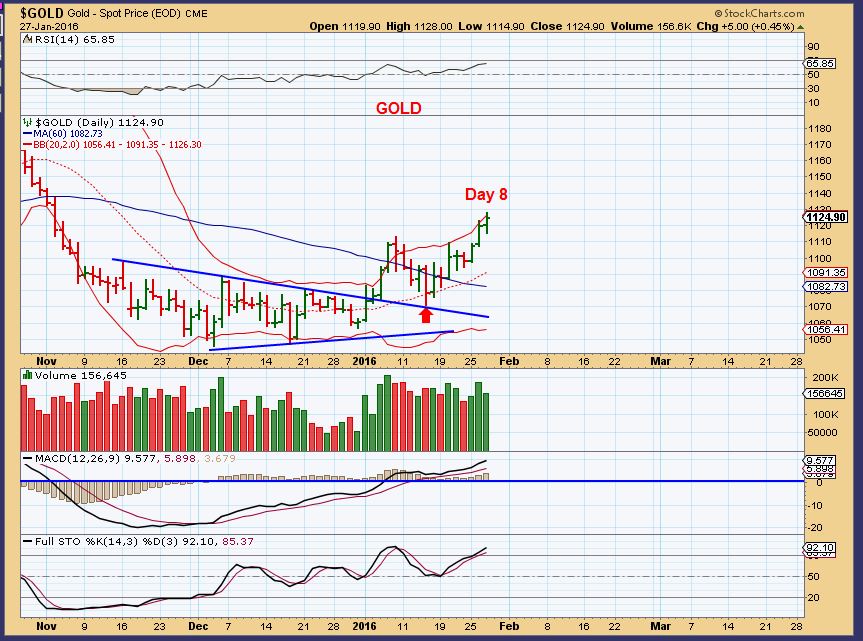
GOLD – The FED decision added a little more gain to Golds already bullish chart.
GDX – We are getting the expected move in Miners. The lows were called at the shake out and the push higher has been rewarding. Even though Miners have been straight up, they arent near the upper B.B. ( Usually slows it down) and they are not overbought.
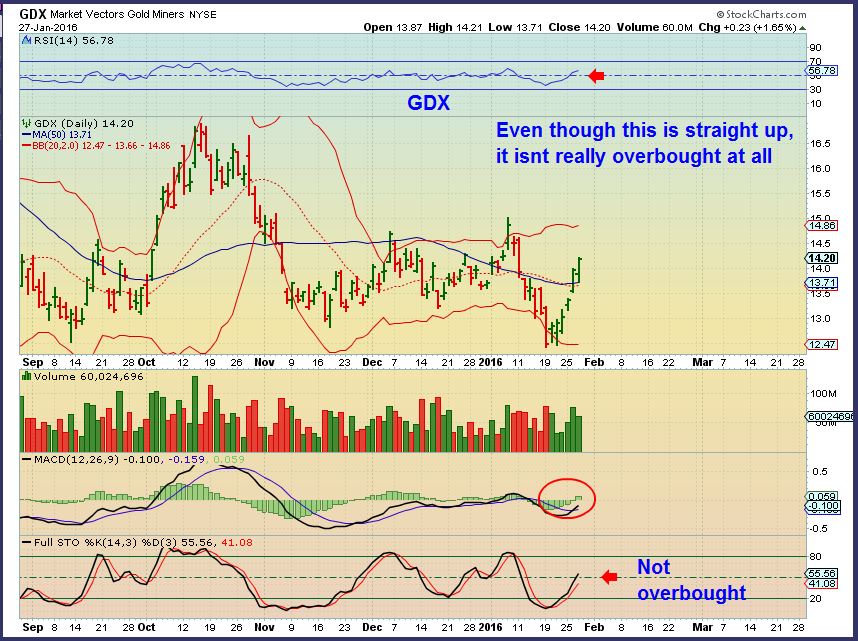
The above chart shows that we are in the middle of a nice move. GDX can continue higher for a few more days, or it can pull back first, before moving higher. That said, I do not know what the day to day moves will be, so when I’m asked in an email at this point “Where can I get in?”, honestly the next ‘safe’ buy is a pull back. The Buy was at the lows. The next buy is really at the next pull back. There is chance that this runs away and doesnt pull back much like the chart below, but no one knows if we will pull back today like the September 11, 2015 run or will it just go sideways & then higher like it did at the 50sma in the chart below.
.
So the next best thing to do is to look at how certain Miners are acting individually. You may find a “Lagger” that is ready to play catch up.
.
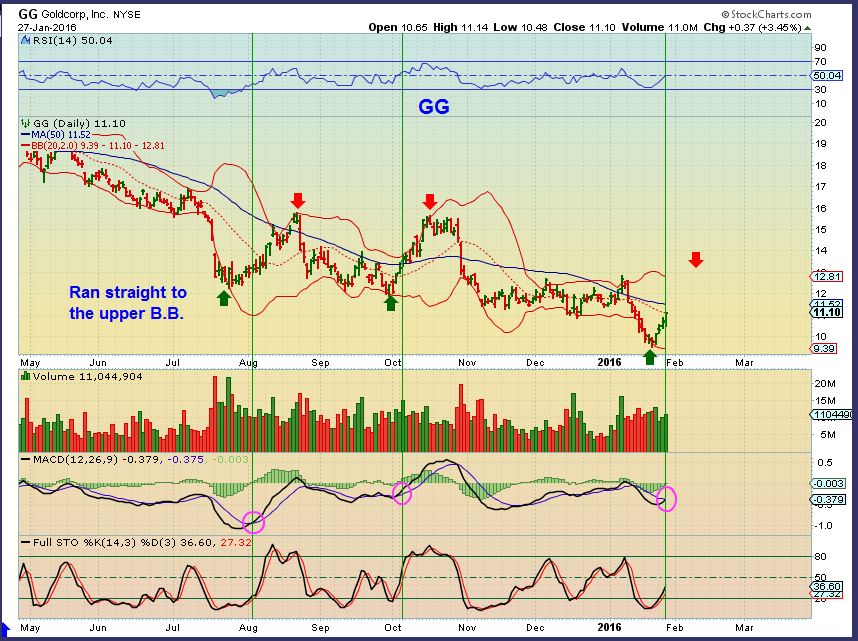
I also like to look at GG, NEM, and ABX since they are the main components in GDX. Is there more room to the upside based on these? Lets see…
.
GG – This actually can run further, based on the past 2 green arrows. Once it got going, it only stopped after riding up the upper B.B. GG is still near oversold too.
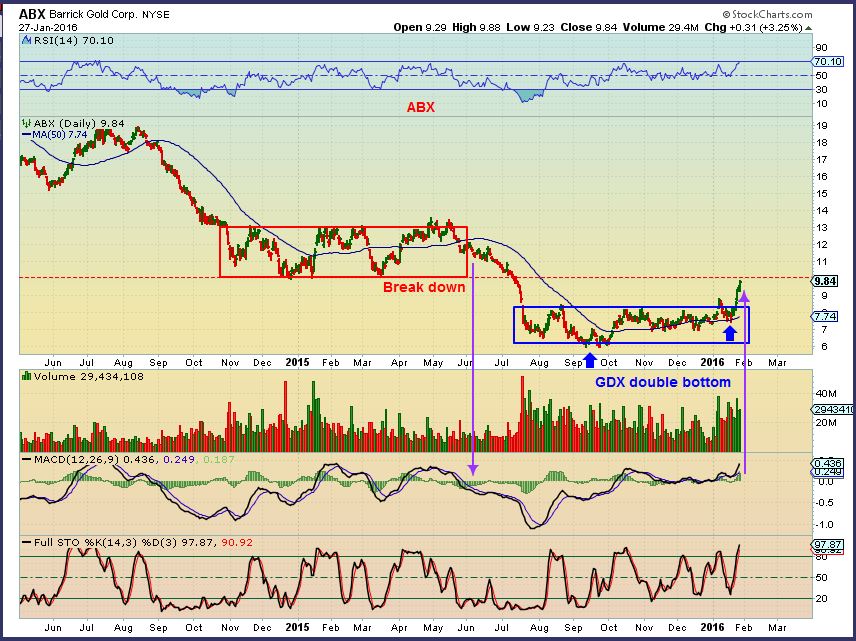
ABX – We already know that ABX broke out and has moved higher. On Jan 7, I called for a target near $10 or $11. The measured move to $10 would start inside the triangle at the apex.
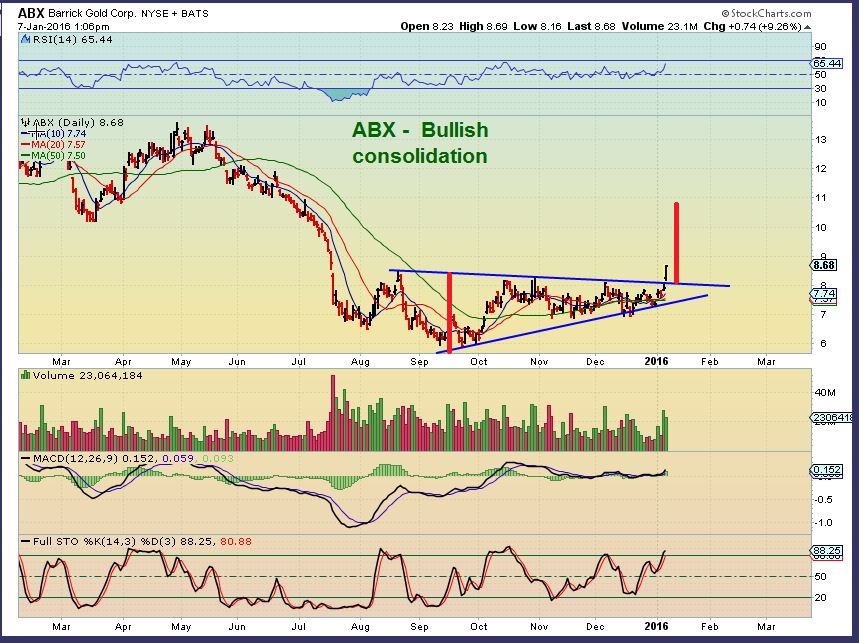
ABX – ABX is near $10. This move could be stalled here (But it doesnt have to). It also may stall sideways and then break higher to $13 on the next run.
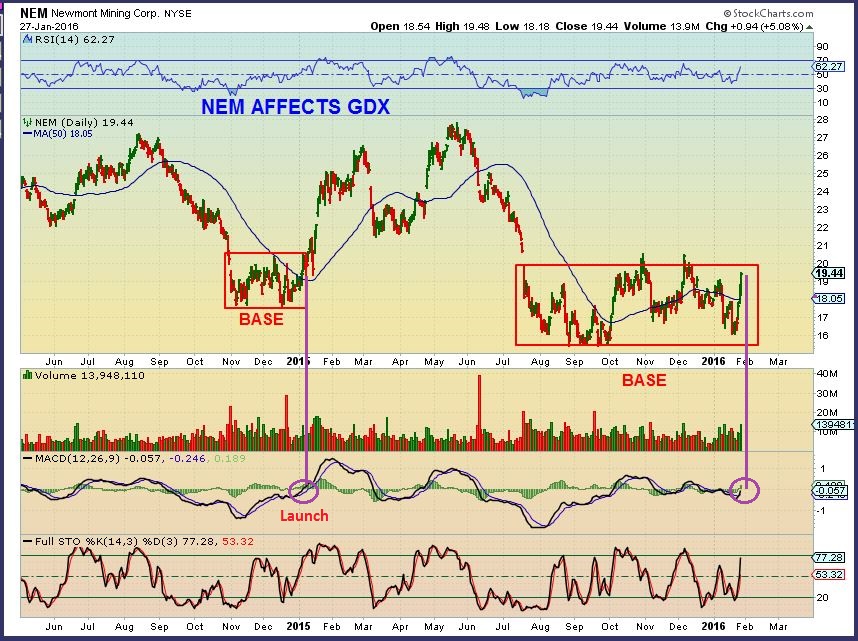
NEM – NEM has been running well, so it could stall GDX here, but it may not. This looks like a large Base. Look at the run from the small base last Dec. The Jan 2015 break out occurred as the MACD crossed zero and the stochastics was overbought. It ran from $18 to $27. We currently have only run from $16 to $19, so If this breaks out, it could keep running.
So it is the day after the Fed Decision , and it was not seen as negative for precious metals. I believe that MINERS just put in an ICL and that means that we have weeks of upside left ( 2 full daily cycles at least). There will be other areas to enter on pull backs, but I cant say where they will be at this point. Anyone that bought miners at the lows can ride them for a few weeks or take profit and hope to get in lower. It is nearly impossible to know what the next day will do in the middle of a move.
I will say this – SILVER is just starting it’s move higher ( in my opinion).
Silver was under $14 / Oversold / when I used this Jan 15 chart to show that SILVER usually moves sideways at the lows during the first leg of Golds move. It then explodes higher when the zero line is reached on my indicator. We reached that point this week.
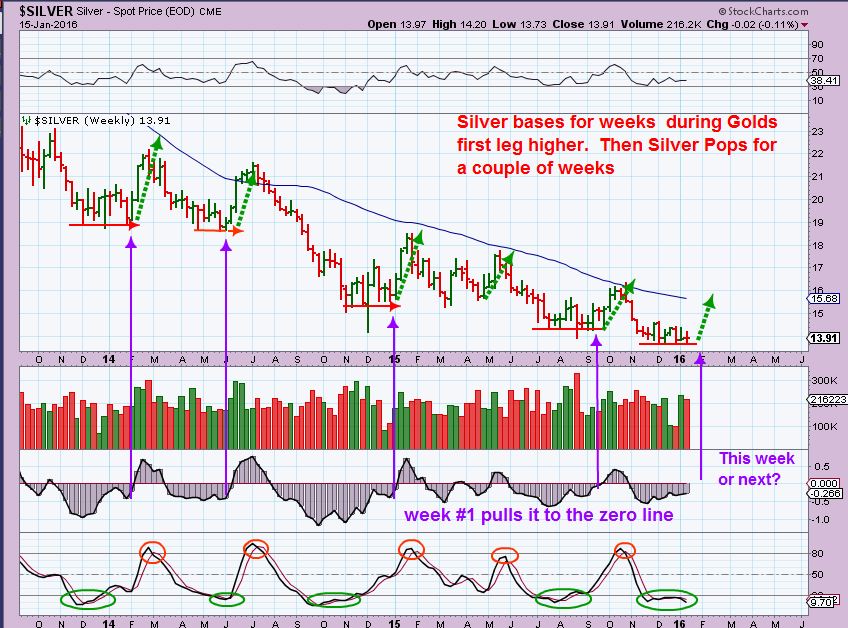
I then focused on this triangle and pointed out how we just saw this form in Gold too. Gold had broken out from its Triangle, expect Silver to also. Look at the bullish divergence in the MACD & RSI.
.
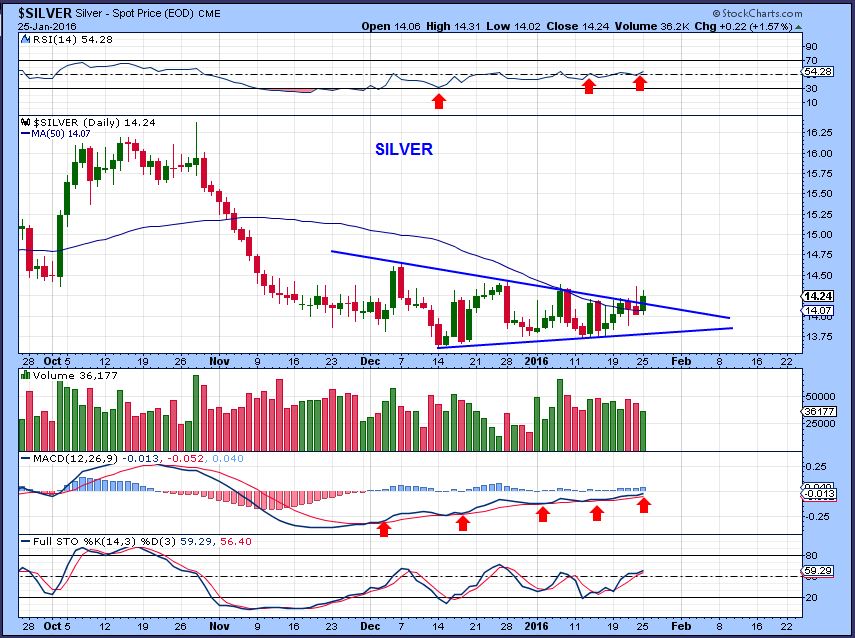
SILVER has now broken out too.
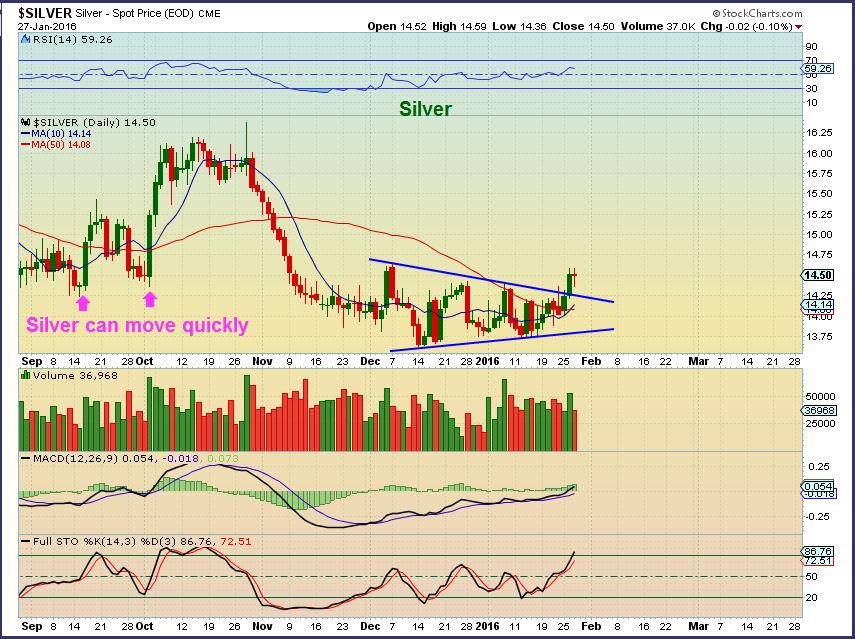
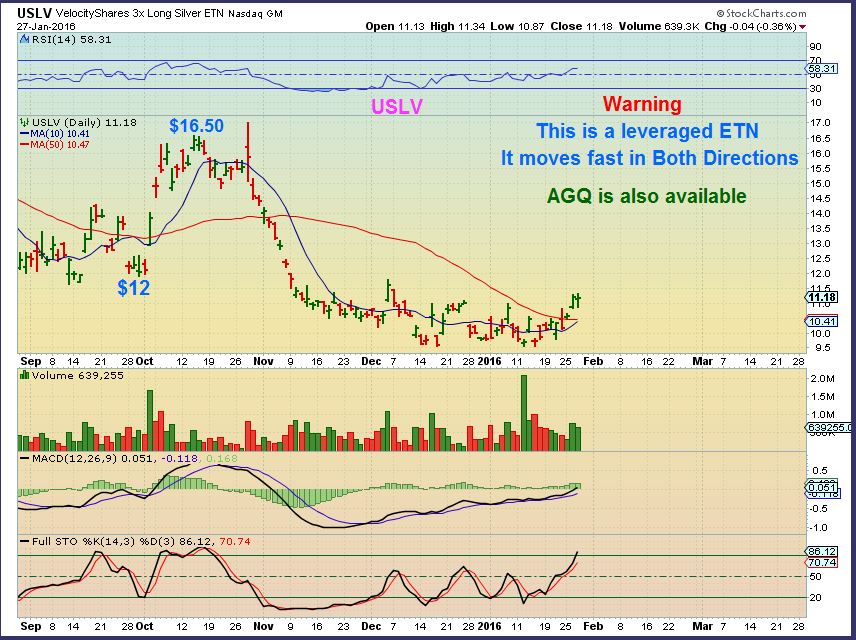
AGQ or USLV are leveraged Silver trades. I do NOT recommend trading them if you are not experienced. Notice that in September USLV first went from $12 to $14 to $12, before running about 40% higher. They move quickly in both directions.
A few Silver stocks that may be better for you to trade are SSRI, PAAS, EXK, AG, FSM, GPL, HL. They also can run 40% without the deeper dips, but they have already moved off of their lows, so entry is difficult. I am watching many approach their 50sma. If they pull back there, they may offer a higher low to buy from.
It is difficult to offer trade ideas in this current environment. The Markets shoot up one day and sell off the next, plus it is a week filled with earnings . Ebay gets slammed down and FaceBook is up $11 in pre-market. That’s a tricky environment. Oil and Energy stocks are up 20% one day, and dip 15% the next. Miners were identified at the lows , but now they have moved higher for 6 days. It’s tough to recommend entering now , when a pull back could take 1/2 of the recent gains away. So it may take a little more time to allow the markets to show their next immediate direction. Will OIL break out? Will the markets get that bounce / Rally that I am expecting? Will Precious metals pull back and allow a lower risk entry ? I will be looking for set ups to trade based on the markets settling down and choosing a direction now that we are post Fed. I may not have a report Friday, this report should cover today and Friday no matter which direction they go in. If I see some really appealing set ups, I may post them as a separate report in the morning.
.
Thanks for being here and best wishes in your trading!
.


BREAK OUT IN OIL. Looks pretty good so far.
Expect big gains on UWTI ,UCO, and energy stocks that are set up like BCEI,
Oil well over the 20sma now as it passed over $34 ( see chart in the report above showing the 20sma at $32.55).
USO still not broken out on this trendline just yet, which coincides with the 4hourly 50sma at this point…
pullback here possible, do you think?
Yes, it could pull back and try to build steam to break through. It looks like it completed an A-B-C-D type move.
.
If it breaks out now, it would likely be the 1-2-3 move of 1-2-3-4-5
got XLE reversing back now at the 4H 50sma too.
tags on the 20sma would be nice
And GDX bounced right off of the 50sma yesterday and today. I’d like to see that hold : )
Tag of your trendline looks like a buy!
you probably right.. 20sma on 4H too far a drop.
maybe this is as far down as we go.
the 65 seems to be significant on the 2H
Thats exactly what I do when I check out various time frames- I look for a best fit trend line or M.A. and see if we can break through higher ( or down lower) , for support/ resistance.
Nice work Son (lol)
thanks dad 🙂
o brother… (eyes rolling)
◔◔
I knew that was next 🙂
couldnt resist
*daddy
actually .. make that BigDaddy… 😉
nice work….son
Is CF using pictures of Maria dancing?
I know … right?
I L .. O .. V .. .E that pic .. yowza … phewww ….
..buttt anyway.. thats ‘sonnn’ to you ..
Yahh Mun… 😉
*bustin out some reggae today.. lol
Funny thing. To my eye, the above charts of IWM and WTIC look identical; yet one is a “bear flag”, and the other “looks bullish”.
This is why I never trust my own charting (in)ability 🙂
They do look alike in that way, so you arent seeing it wrong.
The reason IWM looks weaker is only based on the fact that it didnt do very well after the AUGUST lows , while the SPX & NASDAQ did.
With OIL , It is in the timing for a DCL and had that strong sell off/reversal and “All of the news” was bearish. “OIl will be at $20 soon”. That type of low is usually a good one to buy, because many go short and have to cover on a ride.
I forgot to mention, look how OIL was pushing on that 20sma with increasing strong volume. That usually points to a break out coming.
Thanks Alex.
Valero Energy (VLO) beats by $0.34, beats on revenue.
Price popped at the open but is now negative.
Webcast at 11 a.m. eastern – if anyone is interested.
http://www.valero.com/InvestorRelations/Pages/EventsPresentations.aspx
Alex,
What are your thoughts on silver this morning? Back testing descending trend line….a good buy point?
thx
Hi Curtis. Gold did a back test, so I was thinking the same thing. ( Refresh & compare the 2 attached charts)
So it could be considered low risk buy, with a stop a little below the $1408 , the 50sma
.
I bought some this AM. As CF has shown, the short term setup is good and I think Gold and Silver will be big performers in 2016.
Alex, maybe we re test 1820 S&P lows like last Aug/Sep before Oct took off. Pattern very similar so far!
It’s possible Cason.
That is the oh so familiar ( in Miners for us in the past) 1st daily cycle dip.
I know you remember that in Miners back a year ago November to December. We discussed it and the pain for those that bought late & held on when it dipped almost all the way back down.
That is something that I’ll never forget!
so far GDX just bouncing off of the 50sma.
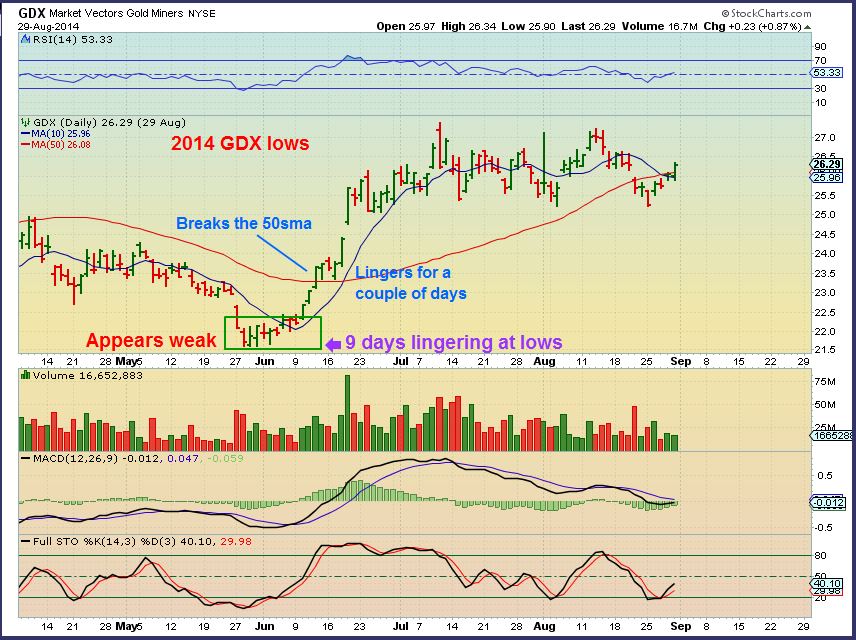
That is what it did (as seen in the GDX 2014 lows chart in the above report) on that may 2014 run higher. It spent a couple of days on the 50sma and then took off.
We can only hope for a repeat of that run : )
SA decides to try to move higher on the day that gold drops. That might be a good sign.
The 10sma is right at the top of price now. A push through that would be a step in the right direction.
.
I am going to lunch, I’ll be checking that one when I return
watching that… i actually added earlier this am…
even if just a quick scalp…since im down a bit….
I couldn’t find any recent news for SA that would give reason why it hasn’t participated in the recent miner movement? I assume its just lagging and a good buy at this point.
.. buys and sells…
http://corvuswire.com/2016/01/28/parent-co-fcmi-buys-74800-shares-of-seabridge-gold-inc-sea-stock/780495/
http://www.iramarketreport.com/financial-corporation-fcmi-sells-500000-shares-of-seabridge-gold-inc-sea-stock/19376/
oops that was SEA eye see … ;o) lol
so… as I’m staring at SA now… I see this … an expanding flat correction… (the one on the right) anyone else?
https://www.tradingview.com/x/9PIMBxU7/
dunno if im oversimplifying with a 12345/abc, but this is my immediate reading of SA.. so yup, i s’pose im agreeing that my abc is an expanding flat
hmmm…. interesting.
well ….. irregardless… it will be *fun* watching this play out …
In one of the 80million modules/videos I watched fella said this ABC was his FAVORITE correction to play as demand was so strong, that instead of correcting down… “B” makes a higher high… which was the signal that a POWERFUL (3wave) move will follow once ABC completes.
hmmmm… we shall see — if this is correct, then it “appears” we are in “4” of C now… so watch for “5” to complete.. then… zinnnnngo…
I’m stoked … to watch…..
*and play ….. 😉
they do seem to be common when you look closely.
i used to think i was always still lookin at a kinda-lingering (teehee) 5-wave instead of an overthrow B-wave, until i heard about them.
Hi Alex,
it seems to me that gold has just had the 1st DCL and now on day 8 or 9 of the 2nd dc and you say that the pm shares just had their ICL, how do you reconcile that?
It’s hard to reconcile and I am just thinking that they will reconcile themselves in time. They’ll sync up in a way – BUT…
.
It happened that way this summer too. GOLD had the JULY ICL , SEPT did a stop run & had an ICL in Sept 11.
AMZN, oh my. Tech stocks are flying every which direction on earnings. Glad that I am not a part of it. Russell continues to lag it’s counter parts, which doesn’t bode well for recovery (which I don’t see happening anyway).
How about Nat gas busting over the 50-day this afternoon?
Moved my stops in ERX to breakeven.
Where has LeChiffre Been? Hope he is alright.