
1-10-2016 Coming Together
As time goes by, it certainly seems like the pieces of the puzzle are coming together to reveal the Big Picture that I have been discussing for months. 2016 could be a great year for some, painful for others if this continues. Lets review.
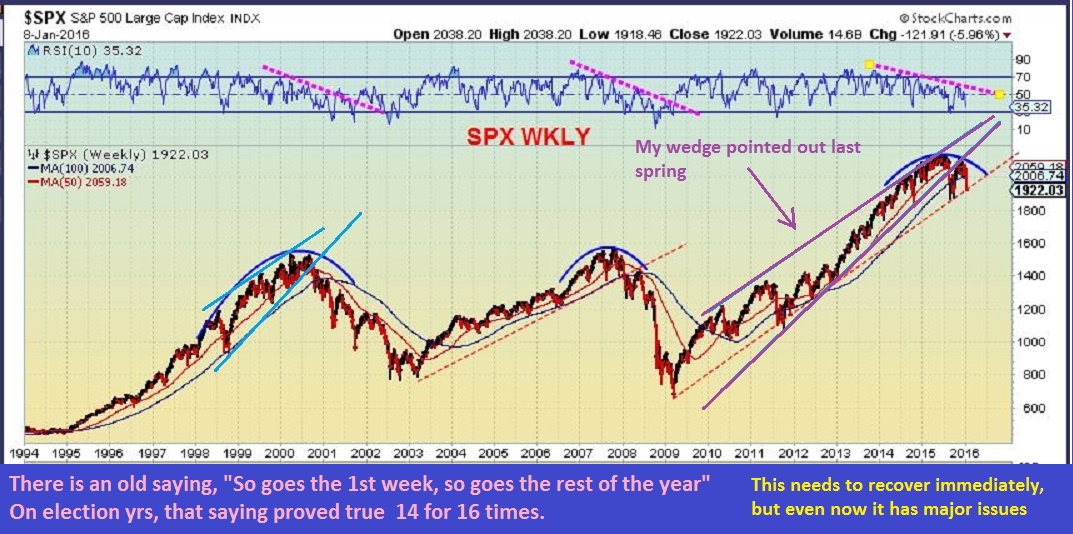
SPX WKLY
 .
.
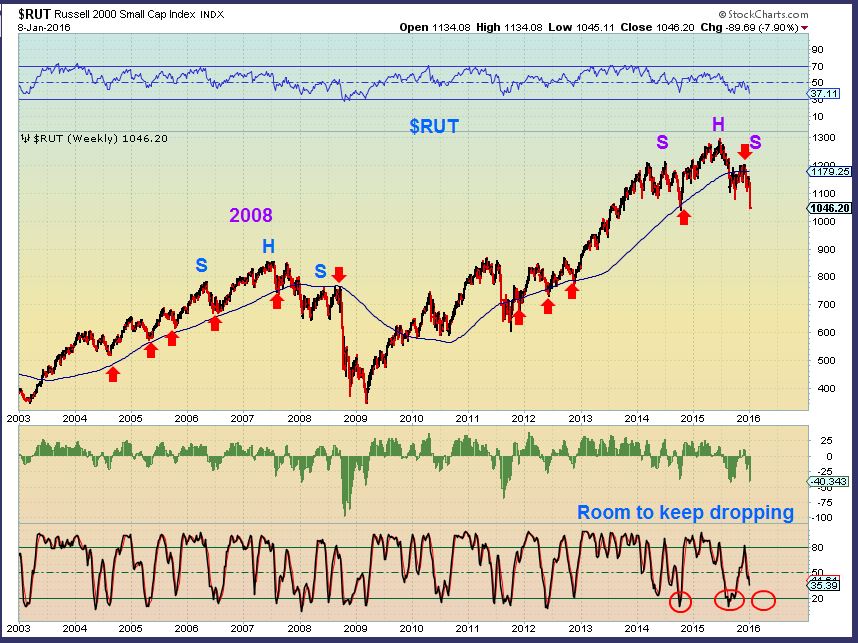
RUT – NOT VERY ENCOURAGING IF WE DONT GET MORE THAN A BOUNCE SOON
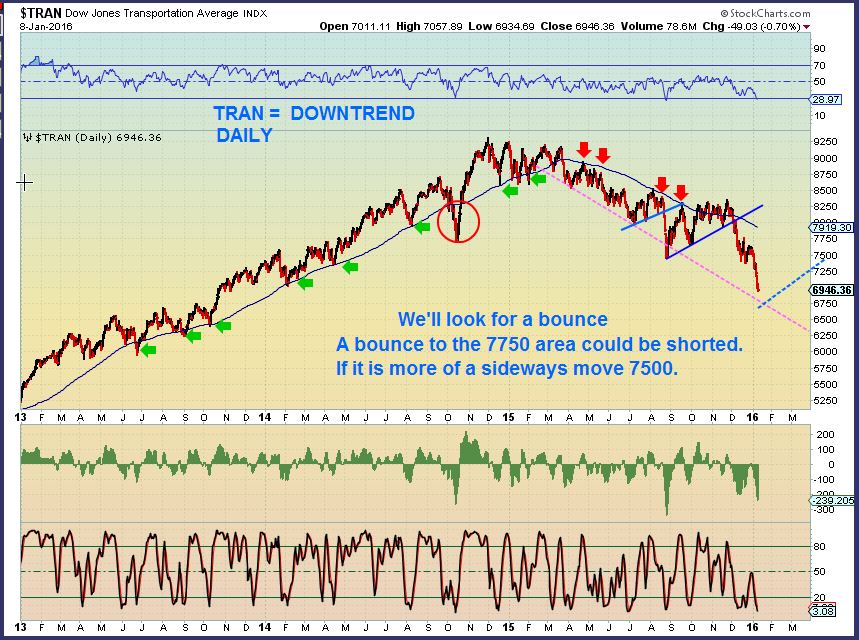
TRAN – Is this an uptrend?
 .
.
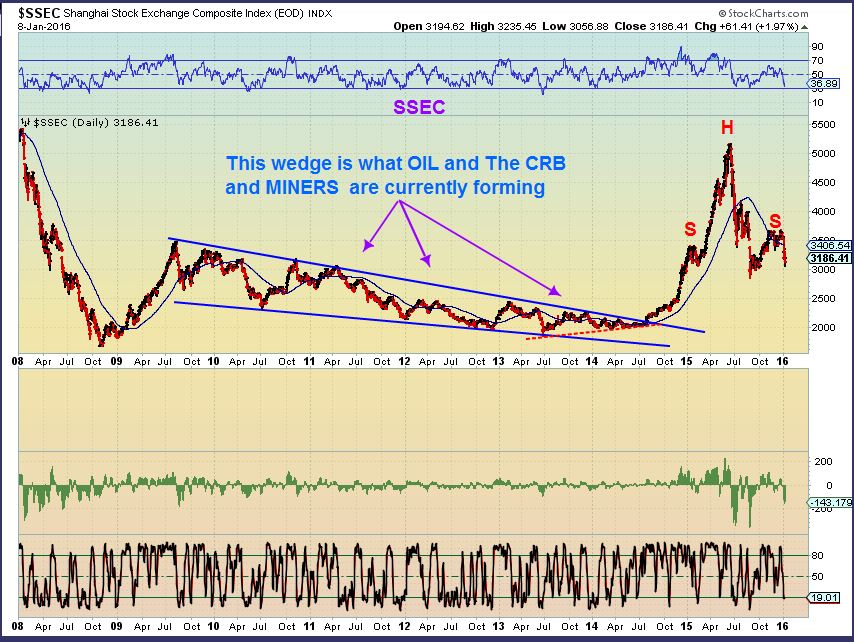
SSEC – a 2 fold chart. I wanted to point out how explosive these wedges can be. On the other hand, we now see a H&S pattern in China.
BKX – This would be a major concern in my opinion. If the Banking sector breaks down, things could get ugly. You should look up some of the charts for Banks. I will add 1 below the BKX chart.
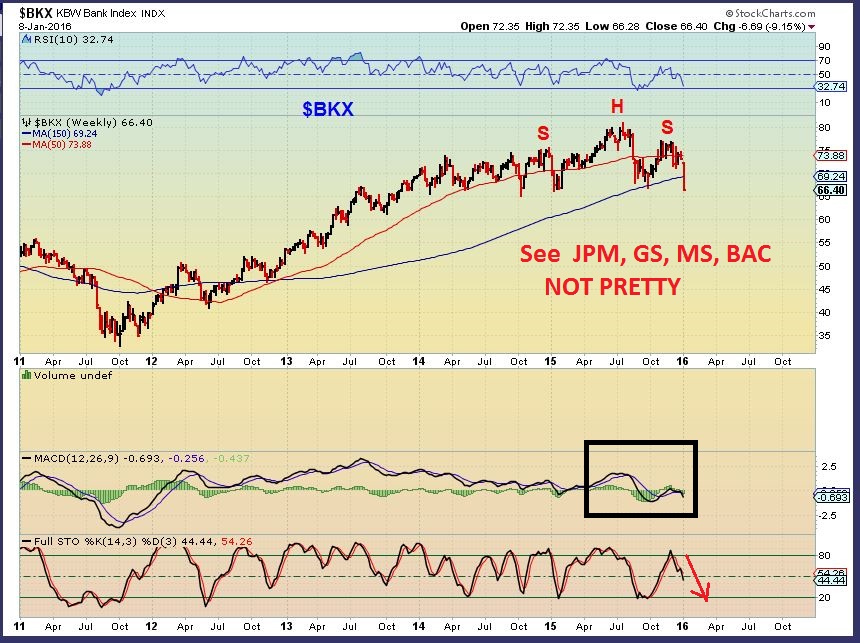
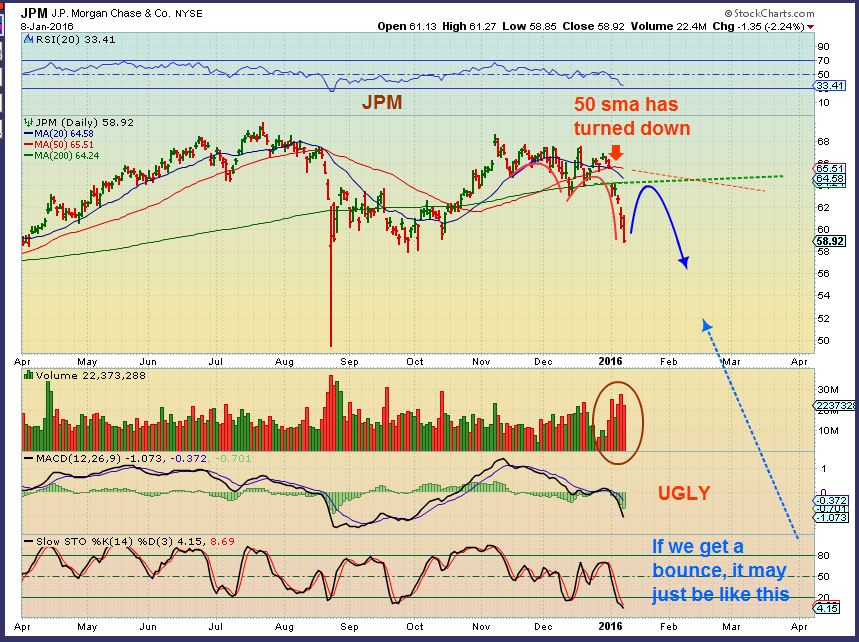
J.P.Morgan – This is breaking down on volume, along with GS, MS, etc. This could bounce to test the 200sma.
In Mid December I had a rather lengthy weekend report , and I showed how the JUNK BONDS / High Yield were leading the way down by making new lows, and I said that I expected the markets to follow. One of the charts I used was this one.
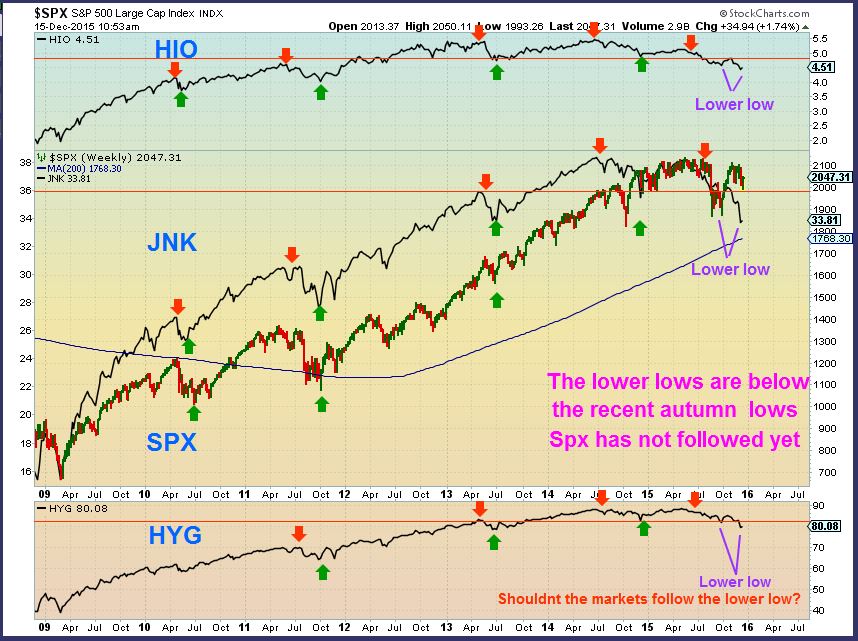
In the Year End weekend report I had other charts with similar findings. I also had others that I could not include, but I will share some now. That report was just getting too long to include everything. In these charts another indicator that I used was also calling for a drop in the markets by weakening as the market bounced higher. It tells me that the move higher is ‘false’ or weak.
Notice in 2008 the market made new highs and the lower indicator didn’t follow. That indicated a weak move, and I saw that happening in 2015 ( I still do). Now with each bounce I can check this for strength ( The problem is that it is a weekly chart, so we need a 2 or 3 week bounce first).
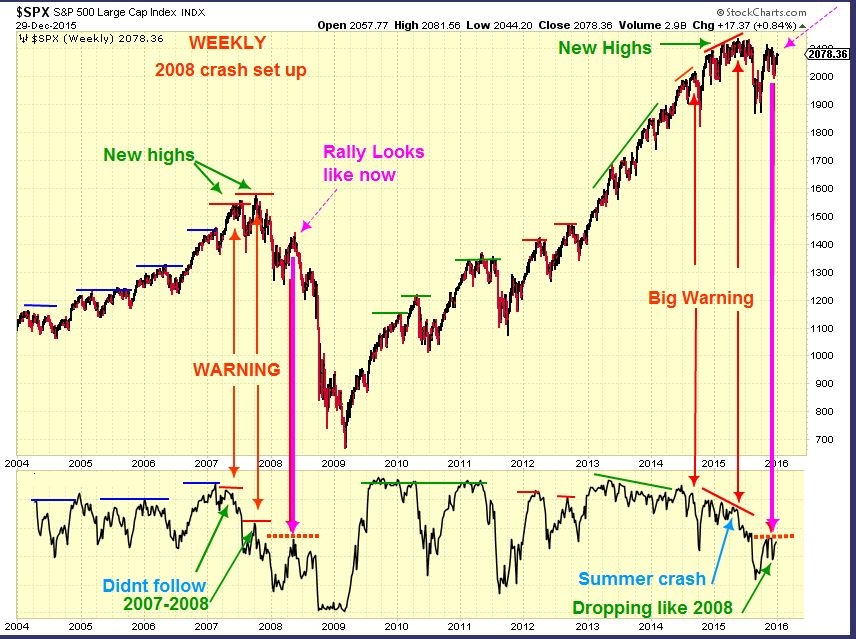
SPX WEEKLY WARNING – A closer look. On Dec 29 I wrote that “we could be here”, it lead to a big drop in 2008. I also Thought that we could be in the 2011 green circle area, less of a drop, if we dont close below the trend line. We just closed just below it Friday. Immediate recovery needed this week or selling can become extended- even panicky.
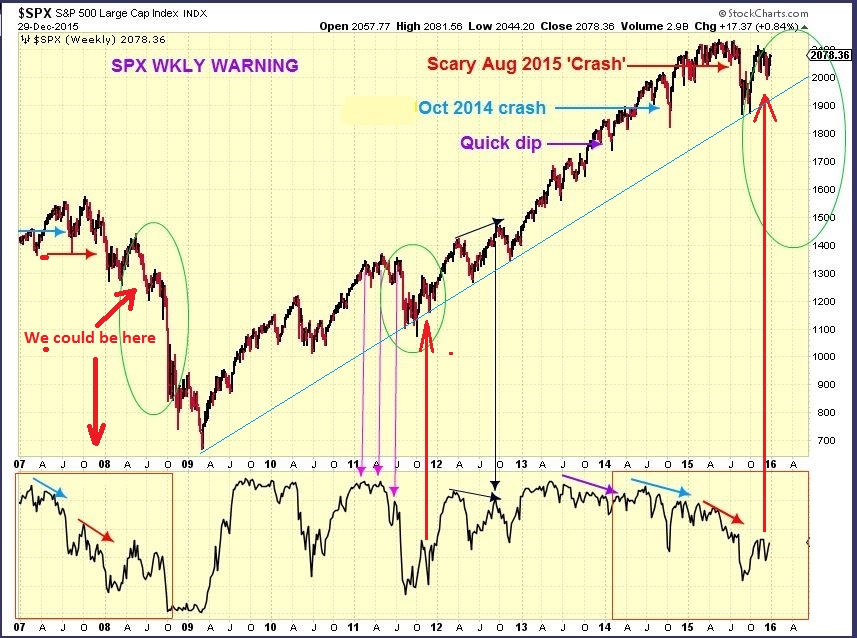
So this is not a bottoming indicator and I dont use it that way. It will not give a buy signal, but it may give a ‘short ‘ signal when we get a multi week bounce. I will look at it again then. This does show us that the markets were topping at the end of 2015.
.
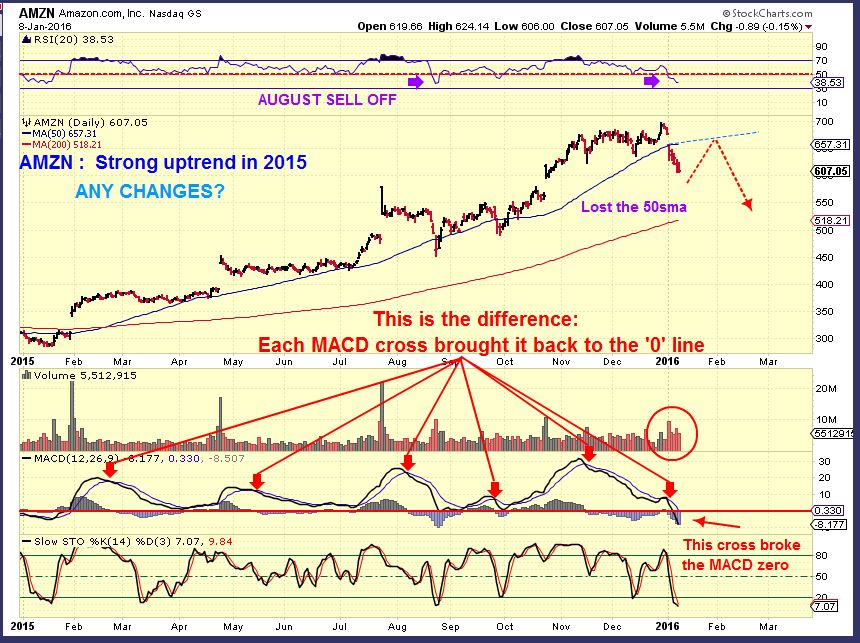
AMZN – I wanted to look at the strongest stocks and see if I could find any ‘changes’. AMZN dipped below the 50sma in the past and recovered ( Will it now?). Also the MACD used to cross down and a normal pull back returned it to the zero line ( Healthy). Now we crossed under & dropped below the zero line. I am interested in looking at these type of things when we get bounce. It is oversold.
Moving on…………..
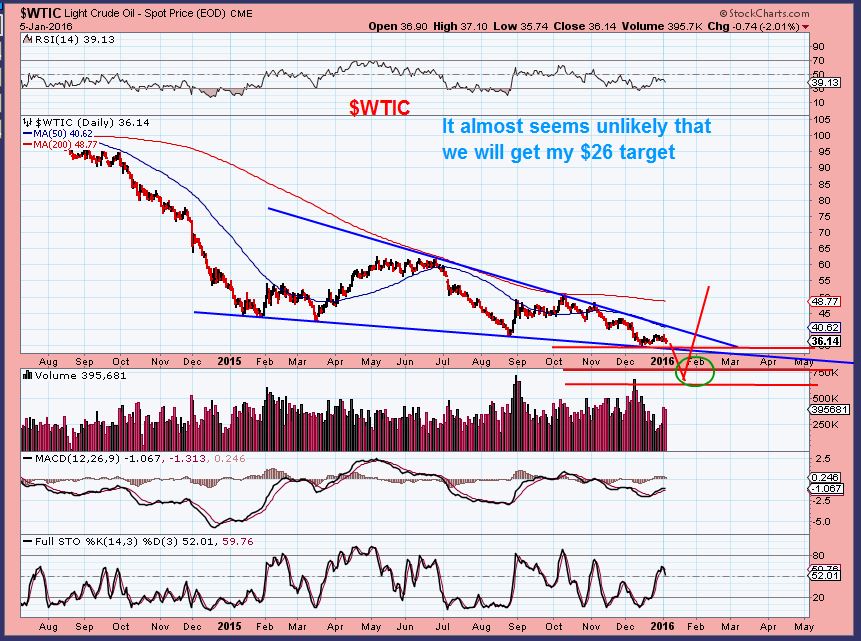
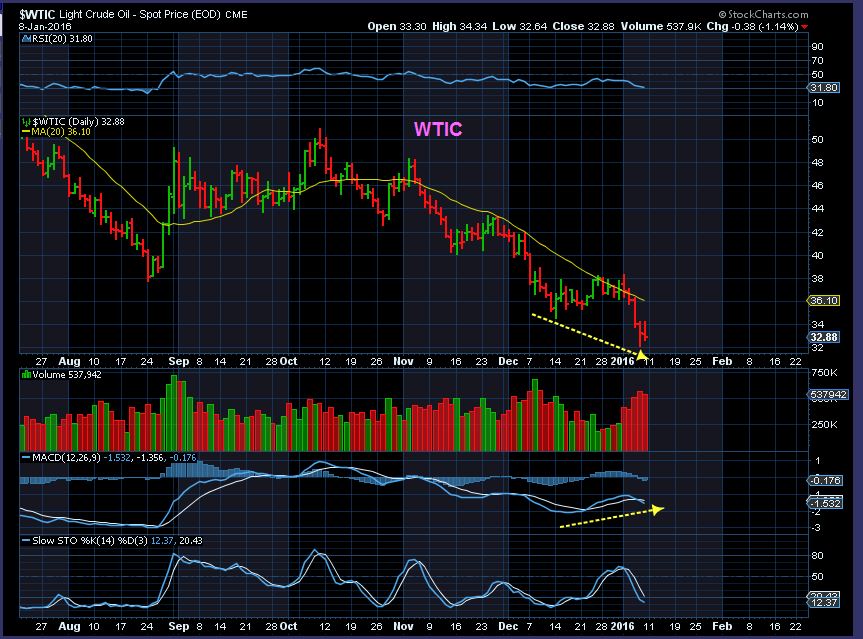
WTIC – OIL could actually be making a low here. My weekly target of $26 area may not play out. Cycle wise the timing is fine, and we have a break down on this wedge. I drew this wedge on the JAN 5 chart to show extreme capitulation to that $26 area, but said that I doubt that would happen.
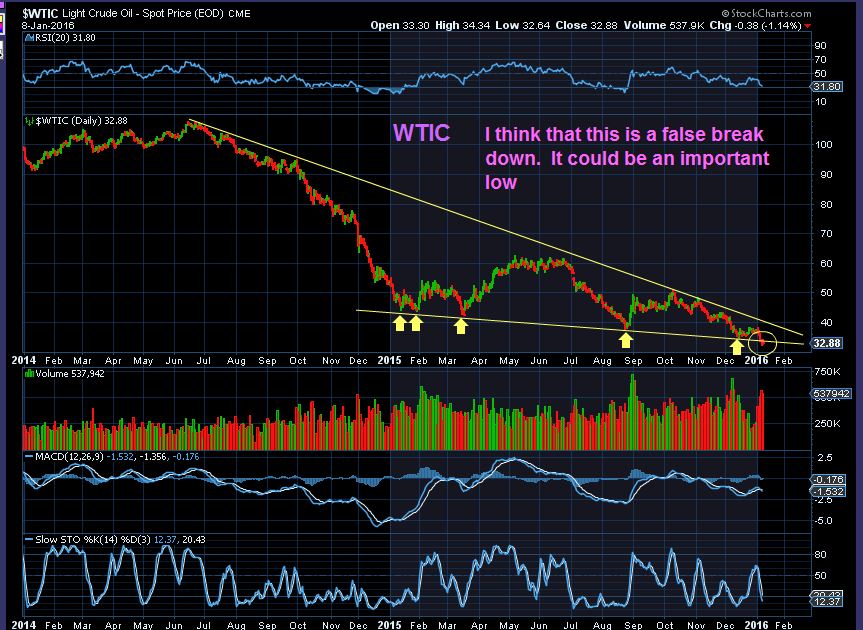
WTIC – We broke below on Thursday & Friday, but this may be a throw over. A false break down. I wrote “important low” a little prematurely, since we need to see proof of recovery or this may be just another dcl.
WTIC CLOSE UP – We do see capitulation type volume and divergence, but recall that OIL struggles at the 20sma so far.
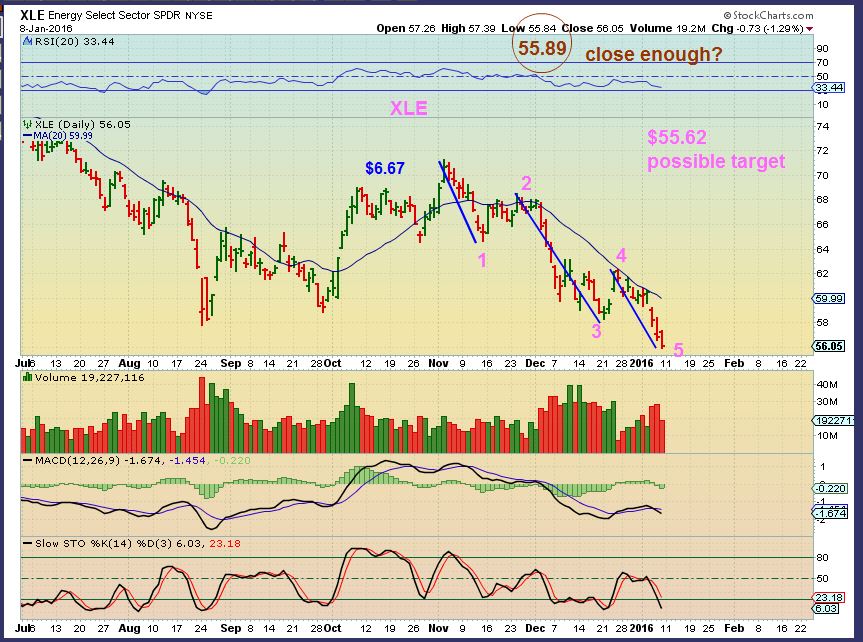
Though OIL looks to have possibly put in a swing low, XLE closed near the lows. I drew a possible 1-2-3-4-5 where the target price could be close enough. This chart doesn’t look like a low risk buy at all yet, the downside may not be quite done.
.
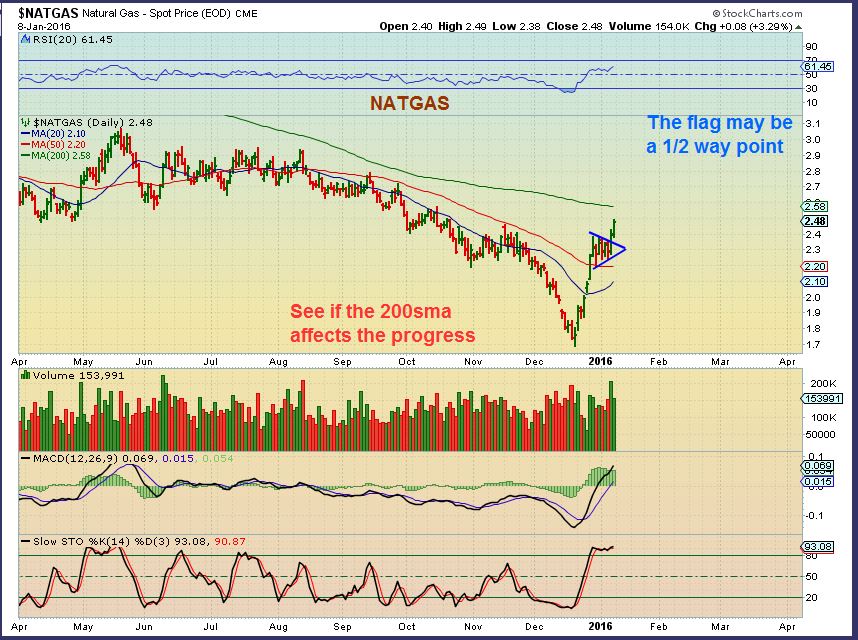
NATGAS – Acting as expected. This was Jan 6.
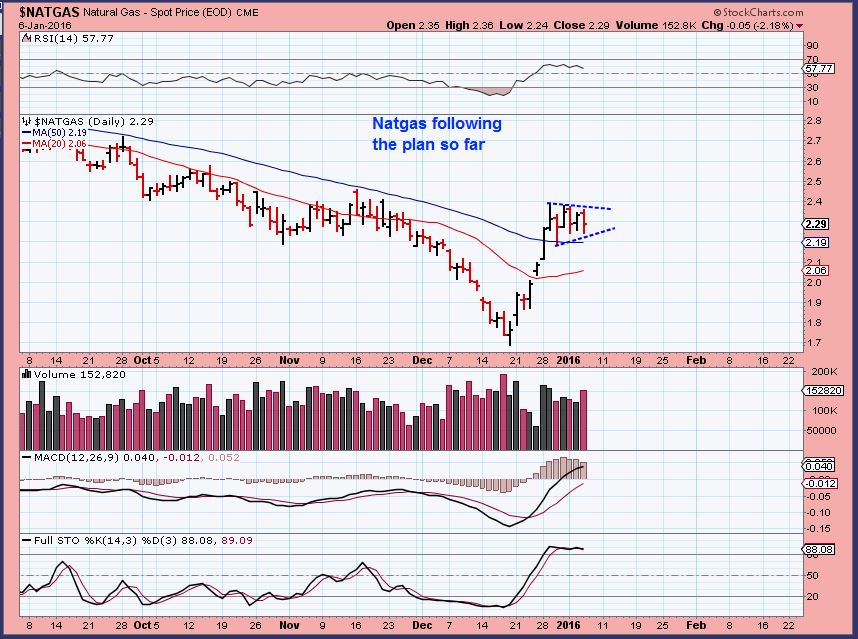
And now great volume on the flag break out. The 200sma may not hold this back.
GOLD , SILVER, MINERS
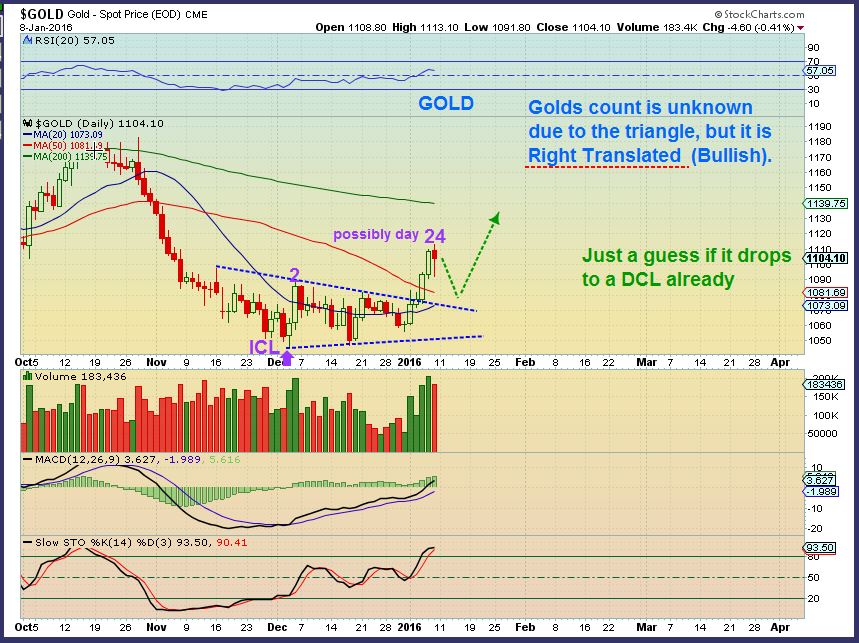
GOLD – We finally got that move out of the Triangle. We could be on day 24, which may lead to a dip ending the 1st daily cycle, and then a move higher would follow. We also just may continue higher. I am ignoring cycle count for now and just using other analysis. This set up has been bullish from the start, I expect higher prices.
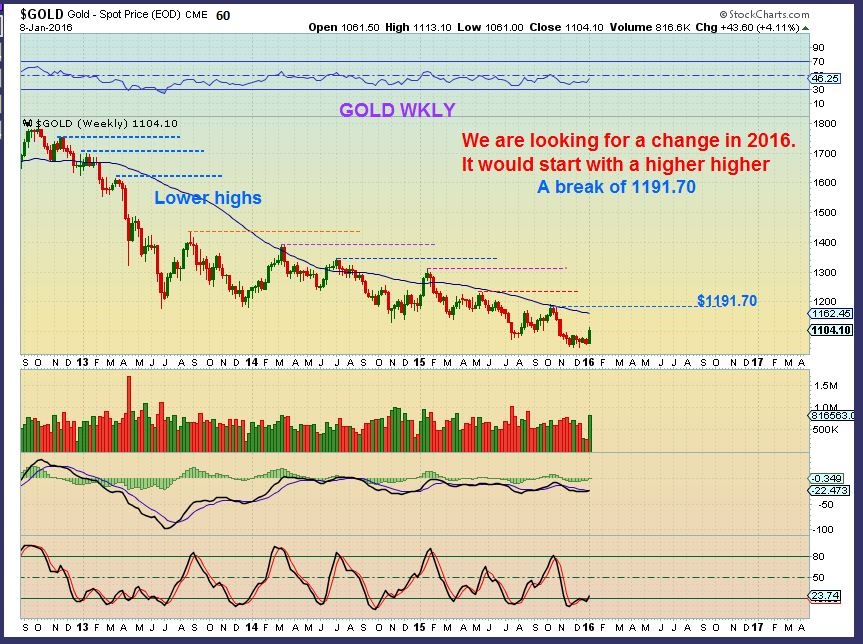
GOLD WKLY – In the Big Picture, if we are looking for a change in character, we want to see a higher high eventually.
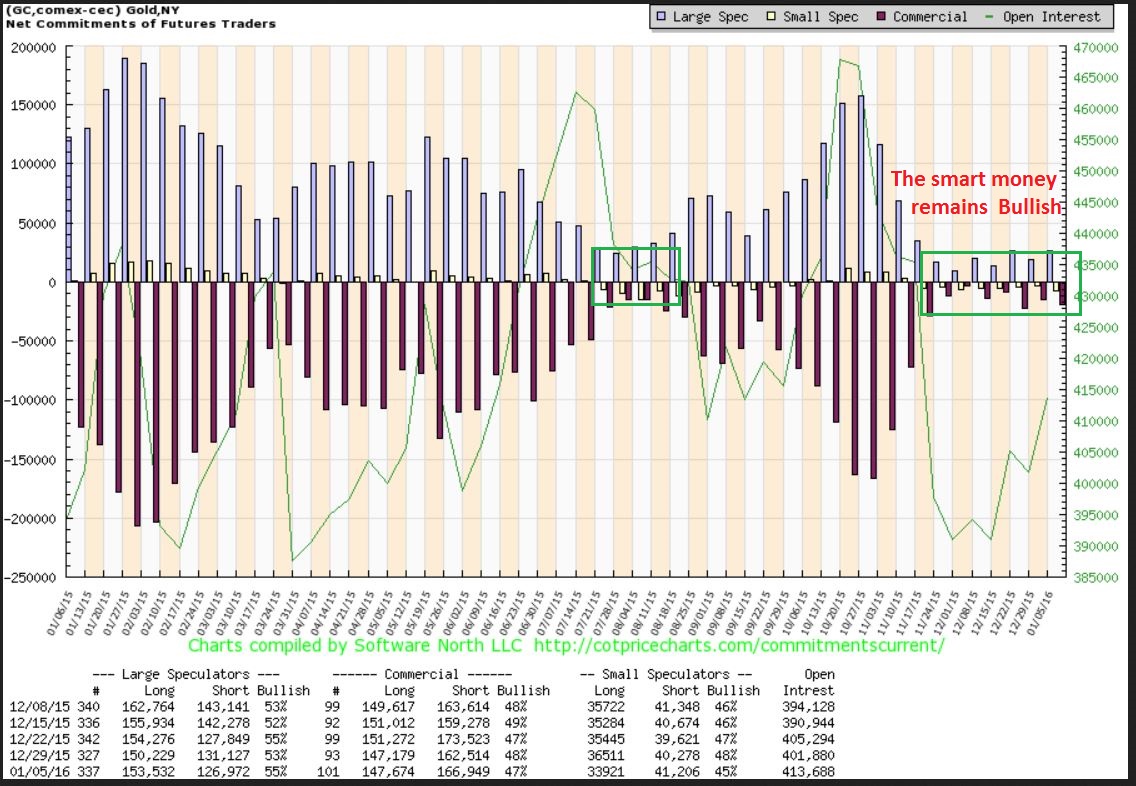
The COT for Gold remains bullish.
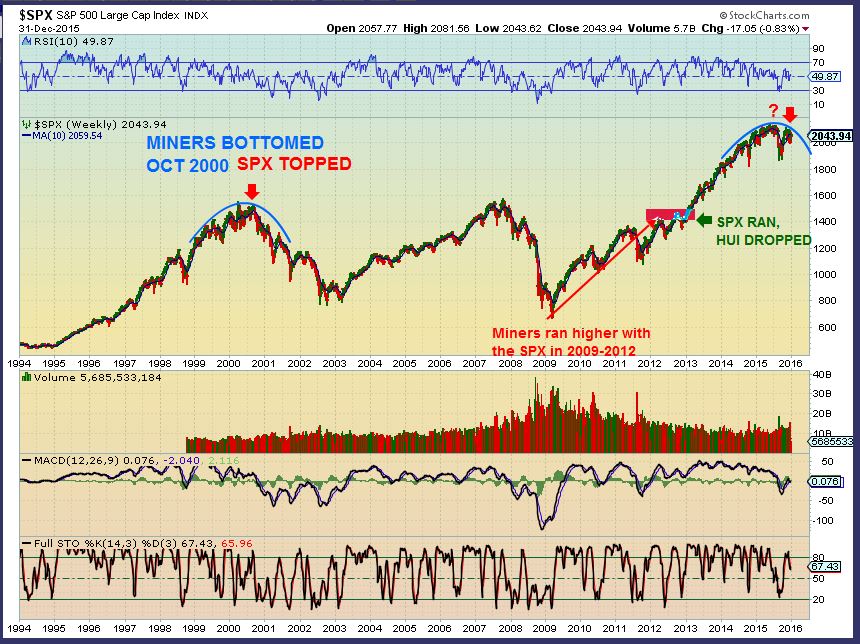
Look what I found. When Miners Bottomed in 2000, the markets topped. Looks very similar to what we see now.
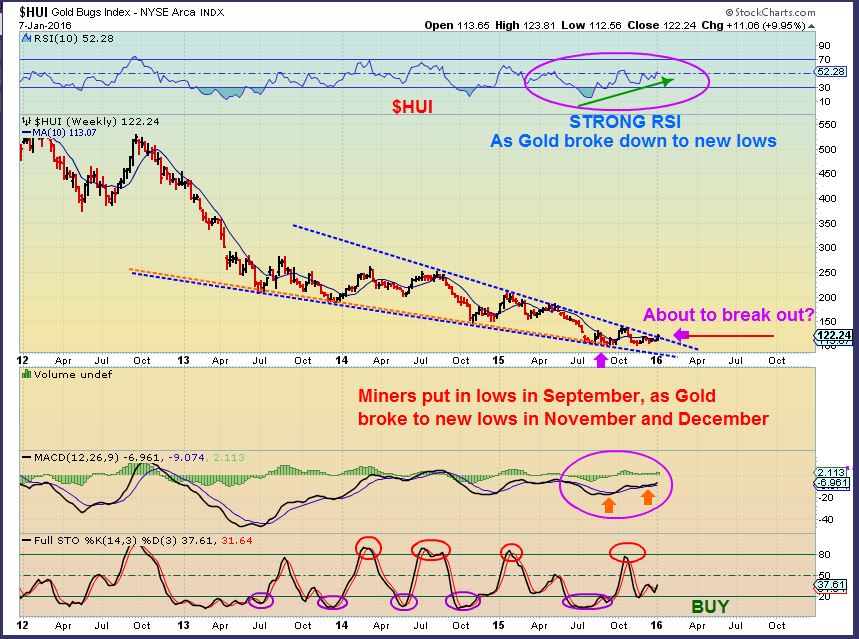
HUI – Earlier in the report I showed a wedge for SSEC, to show how explosive they can be. This looks similar to that one. I like many things about this set up.
I have been asked if I feel that the Silver stocks will play catch up. I do like some of the set ups on them ( Ag & EXK do look a bit weak).
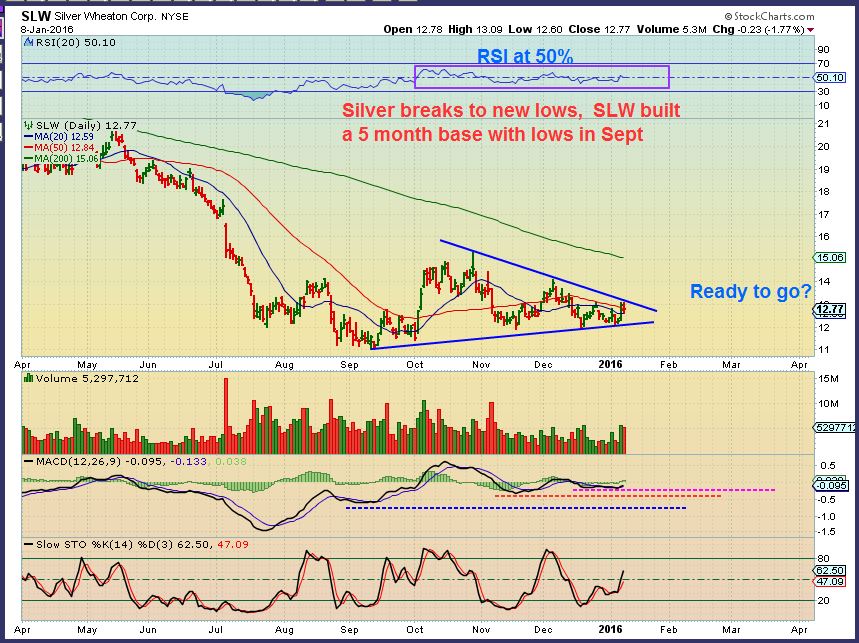
SLW- Nice set up actually.
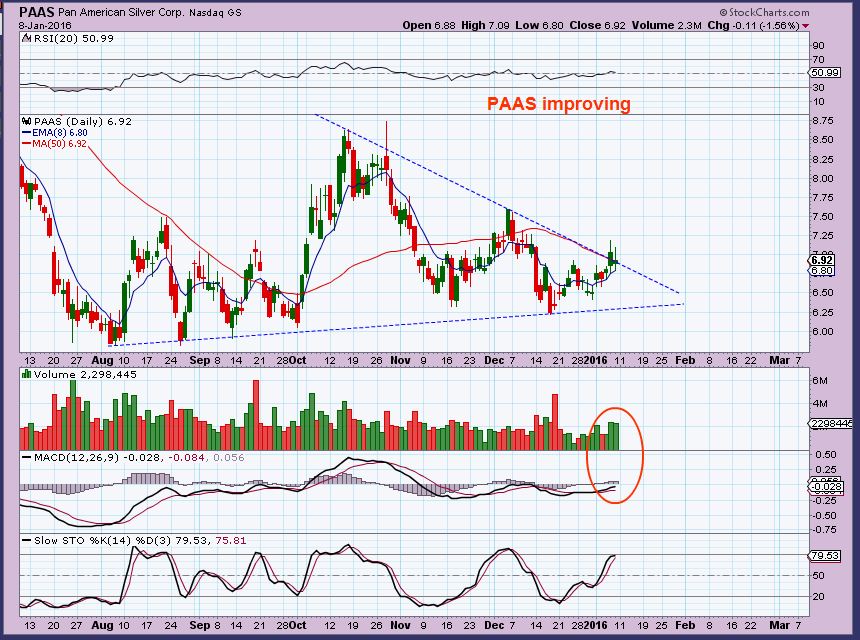
PAAS is improving
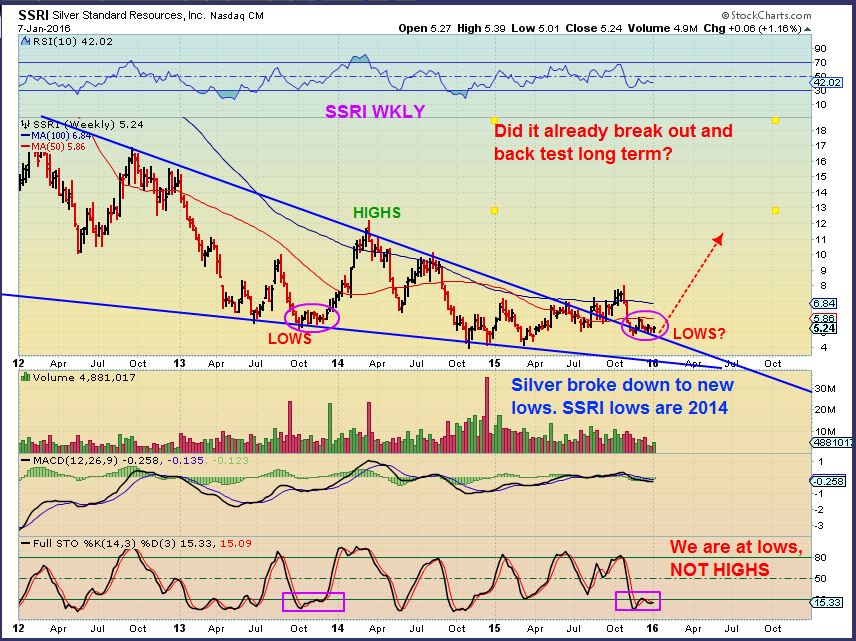
SSRI WKLY – That was an ugly drop in October, but it may just be back testing a break out from its 2015 run of $4 to $8. At least when Silver broke to new lows in December, SSRI held up.
Did you miss that move in SA where it tripled? Maybe only a little. Many of these Miners have good potential once they return to a bull run. Let me show some of the possibilities if / when the Bull Returns with some weekly charts.
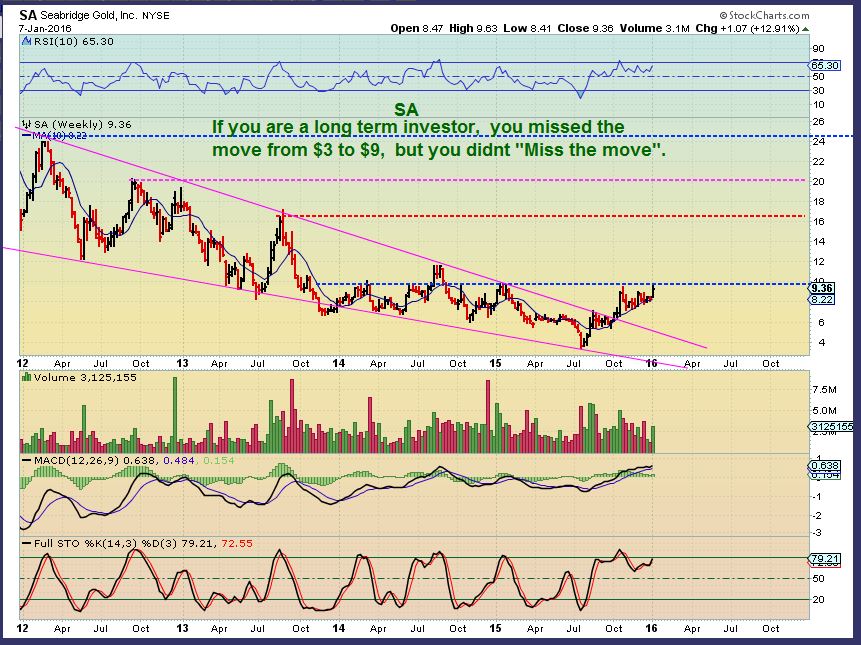
Picture them returning to former highs over time.
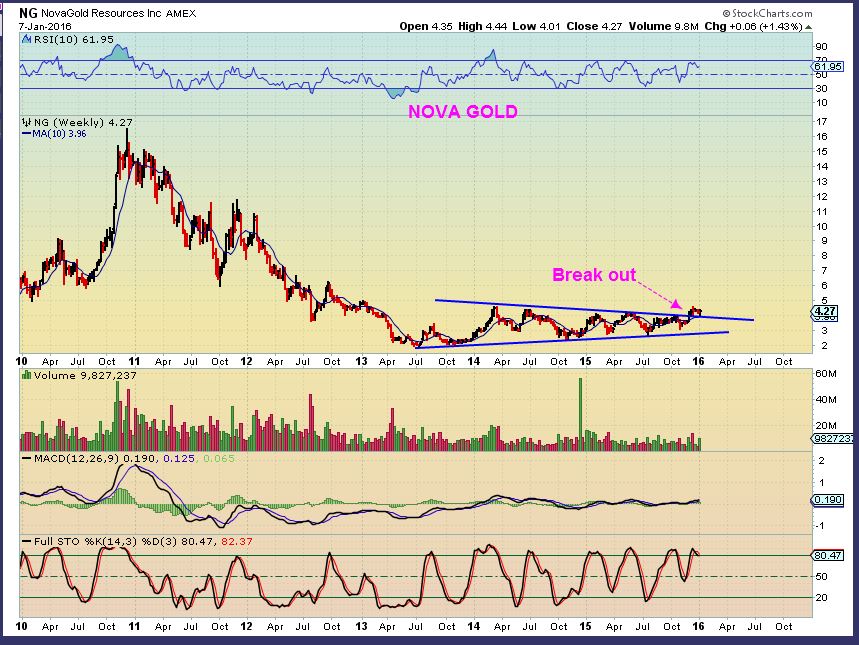
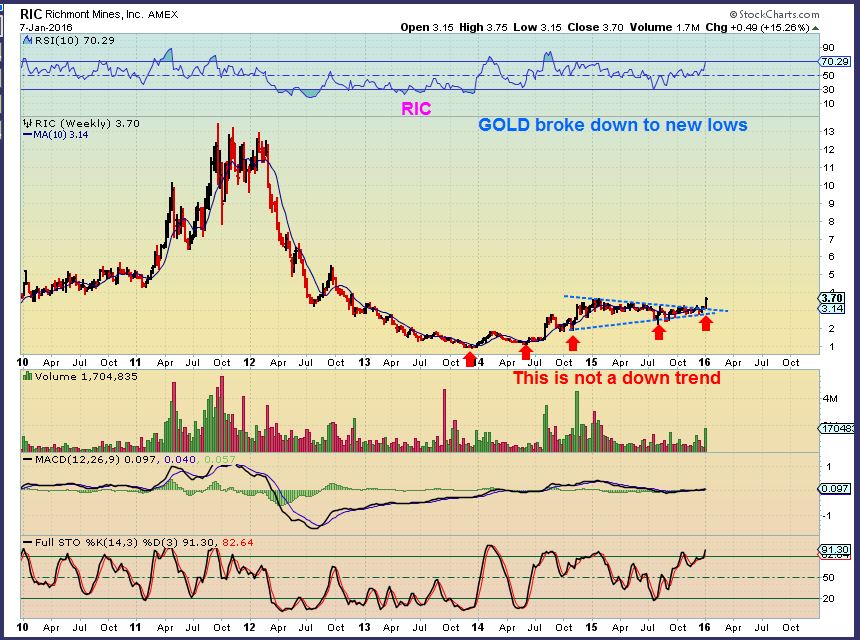
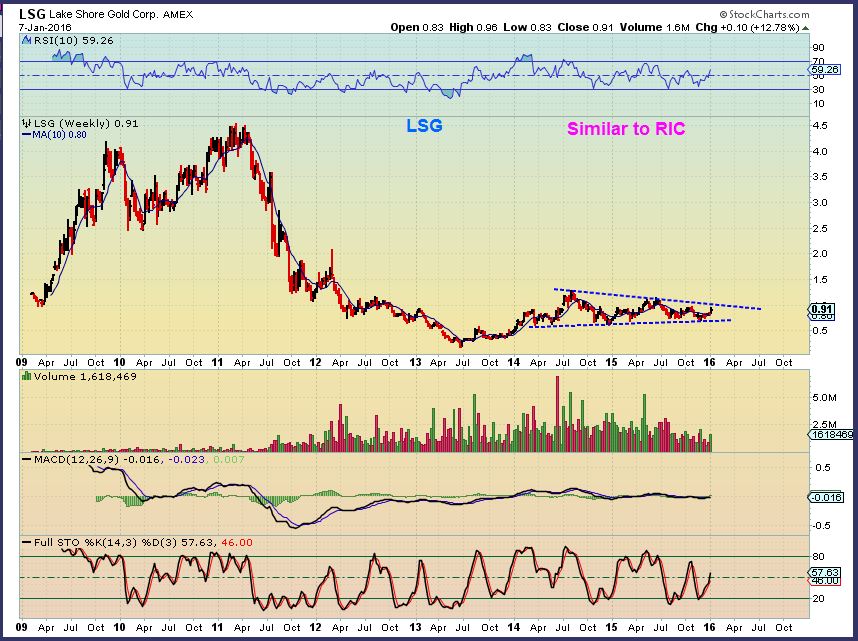
SO I say that the pieces may be coming together, where we have a topping stock market and bottoms forming in Oil ( soon?) NATGAS, COMMODITIES ( SOON?) and Precious Metals. Many Miners shown above look to have bottomed already, but it can be a bit of a slow process when looking at weekly charts. Those charts of RIC, LSG, NG, SA, etc show promising signs when we consider that GOLD & SILVER just broke to new 5 yr lows. What if Gold does dip to $1000? These Miners already look to have their lows in, so it could be a buy the dip scenario. I’ll keep an eye on the big picture, and as for the short term, I am still bullish on Miners, NATGAS, and I’m watching to see what OIL wants to do. I know that we have some ‘traders’ here, and they can probably look to trade a bounce in the markets. They are getting quite oversold. I hope everyone had a great weekend, thanks for being here at Chartfreak.
~ALEX
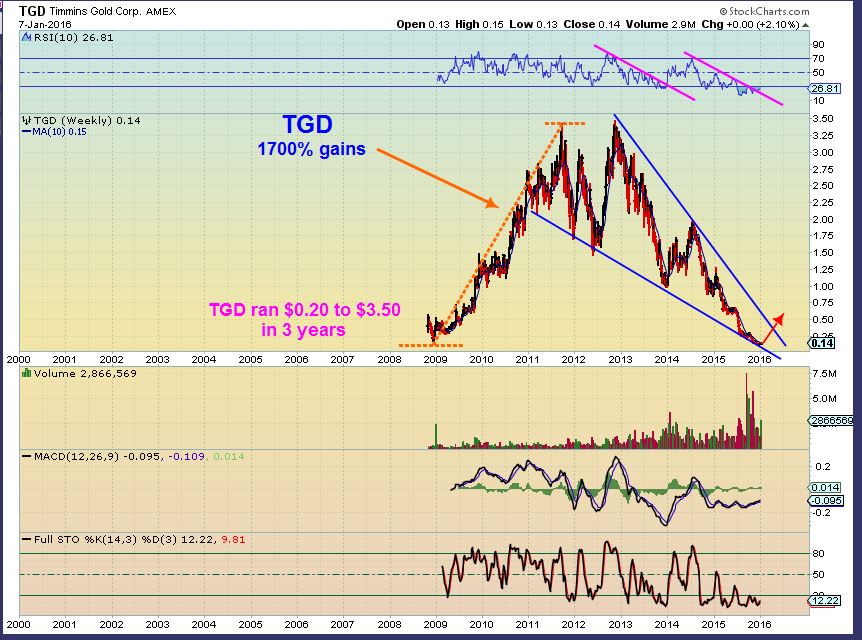
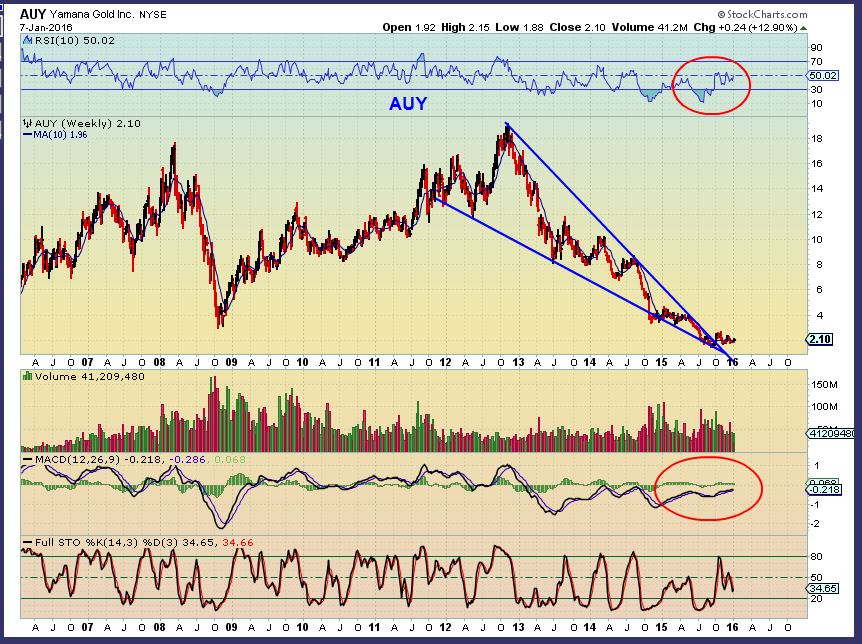
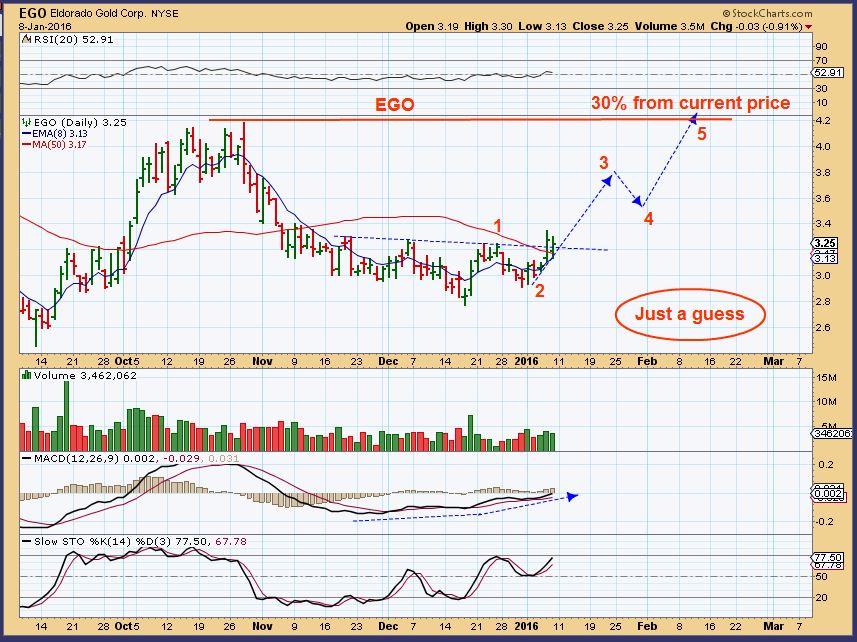
I bought EGO & AUY because I like the set ups and a simple move higher could lead to 25-30 % Gains.
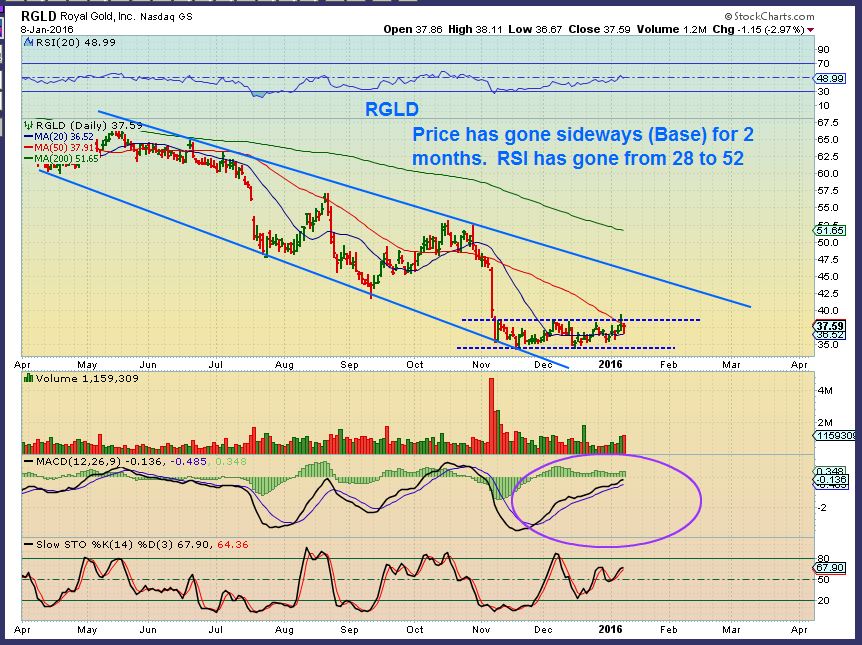
RGLD – This is an interesting set up . It got clocked this fall, but looks to have based out and may move higher soon. Even a simple run to the blue line is 20%. The lows are $35, they should hold at this point.


Another Great report thanks again and again. Always look for y2k analogies, as the sort of bottoming we’re in… btw Timmons will 5 bag before $1300 pog. 😉
Hey Beek,
If we can get many of these Miners to avoid bankruptcy before higher Gold prices, the potential is huge. Recently we have their energy costs cut back with Oils drop, and if the price of gold rises, their quarterly reports may begin to look attractive. Quite a few “ifs” , but that’s how the large ships turn around and avoid running aground.
Best to you, and thanks for the kind words.
Alex,
you are completely right ‘ avoid bankruptcy’ and we may get 10 baggers. Everything then is predicated on gold and silver rise and ability to find financing. It looks to me that price movement is a good indicator of which is a good company (example RBY bankrupt vs SA or RIC)
wow ..
.. wicked cool charts and analysis CF … so much to take in …. exciting …
happy monday all …
Maria,
Did you say ‘wicked cool ‘ charts? In my travels I find that no one says ‘wicked’ good, and ‘wicked’ funny, etc outside of New England. It must be catching on? Thats wicked cool. Nice GIF & Happy Monday to you and all too..
1. no, i did not (er)
2. it’s a well known fact that NE’ers copy NY’s in just about everything
*imitation is the highest form of flattery #noImagination
Any chance a guy could get SA @ 7.50 this week?
I’m thinking not , but todays drop is pretty big. I guess it’s a maybe.
I have been using the 50sma as a buy point on SA, and it has only marginally dropped below the 50 and then recovered. $7.50 is a bit further under the 50 than it has dropped before.
If it gets to $7.50 – I might even consider taking some profit and waiting to see what it wants to do ( Make sure that last move wasnt a double top like the MACD seems to indicate).
Thanks Alex.
It also hasn’t touched the bottom of Keltner Channel since August.
Right, I guess if it goes there you can watch for a reversal at the K Channel.
She ended $0.17 under 50 day so I might watch some more before pulling the trigger. Recovery tomorrow would be positive.
Hi Alex,
Does this action today in the miners indicate maybe they are rolling into a DCL? If so how much of a pullback could we expect…could this drag on for a few more days? Silver miners down a lot with the metal flat.
thx
20sma better be support or lower we go.
Hi Bill – What was the 20 sma for GDX ?
It was around $14. We are lower now. Look for a turn at $13.85, AB=CD and lower trend line support. Fingers crossed.
20 day now 13.92 as of today, the EXACT closing price. Tomorrow is important. That was a heck of a 2-day spill, I wasn’t expecting that!
Hey Curtis,
It could be dropping into a DCL, but there is no way of knowing if it’ll be short or long process.
I wasn’t really expecting this sell off to be honest, I expected GDX to continue higher after getting above the 50sma this time.
.
The move today in GDX looks similar to the move DEC 14. It was a big drop, then a 2 day bounce, and then a final dip into what may have been the DCL .
refresh.
.
Is that happening here? I cannot know for sure. I already am stopped out of my newer purchases AUY & EGO. : (
.
Thanks CF – I got stopped out of my EGO and AUY too. We will see how low GDX goes down.
After the gap down, do you think UNG is a buy back or could this drop further ?
Hi GOLDSA
Using the 50sma, it could drop further, but it may not. NATGAS has been one of the strongest out there and seems to have a little “Buy the dips’ crowd out there holding it up.
I can’t believe how well MUX has held up today!
I was just thinking the same thing about AU ( Check it out with a 200sma. It actually went higher and tagged it today).
Ya, Nice! You think its a volume thing (no big traders)? Not as many (Mutual Funds) trading these stocks and comfortable waiting it out? I took my position in MUX as a long term trade, maybe others look at it that way. AU is a more costly stock, but still under $10.
GDX outlook? Alex, you mapped it out in your report this morning. Pullback before higher? I’m seeing this wedge formation that has to bust out one way or the other. Just like you showed in Gold and other miners. Refresh……
I’m watching the same lower trend line. Right now we have the first tag as the ICL, then the 2nd tag as a possible DCL. In those cases we also have a higher high this time. I’d like to see another higher low on the lower trend line, but the way you have it drawn is possible.
Gold pretty much where it was for the low on the 8th. If you remember the low for the day in NUGT was $27. The low for Today is $24.50 for the same price of gold? General Markets effecting the miners now.
tempted by UWTI around now.. what do you think Alex.. today’s USO overthrow = bottom hit?
Maybe – We are starting to see divergence – but it isnt low risk. It can get into a capitulation type waterfall.
….and you’re looking at a 3X ETF. If you take a stab at it, keep a tight stop & pray for no gap down : )
true enough.. think i might just take a big chunk of USO.. at least no decay if 1st go down & then sideways.
& would retrieve my money when it comes back up
If you set the RSI to 5 on the daily chart you can see that at these previous oversold spots the price of UWTI drifted sideways or went up. Low risk of a further move down, having said that you always want to trade the trend and the trend for UWTI is………..
USO now acting like it still might have some more drop.. think im gonna wait for a turn on the hourly MACD
where’s Maria? … i need some Elliott Queening
Careful what you wish for!
LOL my plane just landed…
God.. i CANNOT wait to get home grab some wine, and get into my catsuit….
Will chart n chat later guys
ohhhh Bill
… reminds of a movie scene..
https://youtu.be/8OcT5poxEbw?t=17
no way im touchin crude… no need to be a hero SOG– wait for confirmation.
go do some pushups…
orrrr u could wait ..
…unless u like playing chicken with sharks and don’t mind – if say – they take u down under and chew off a leg or two before they let go so you can swim like a madman to the surface…
(cue the JAWS music)
hehe thx M.
well maybe UWTI wouldve been ok for a revert-to-mean quickie.. but youre right… too risky at mo
stab & pray … not sounding like a good strategy to me SOG….. might as well throw a dart
heck.. or a pie… c’mon chartfreak… show yourself…
I like the looks of the chart “FUEL” . A couple of nice volume pops pushing on that 50sma
Sold a quarter of my HDGE today.
Plan to reload if SPX bounces here to about 50 day sma.
(refresh)
Man, I got stopped out of shorts (profit) – SPY puts, SPXU (by pennies, darn it) at the open then it dropped. Had them too tight, b/c I hit my targets this afternoon where I would have sold out (higher). Should be ready to bounce so not going to re-enter short here, too oversold for that.
Still short oil, looks like it will never ever bounce. Tightened stops into the money, maybe we bust $30 and that gets buyers to step in? If we bust that before inventory, I’ll jump out for sure. Still long GDX calls, did not think we’d get hit like that. Gonna hold, max loss well defined with options so I have little further risk at this point at all.