
White Water Rafting
If you have never been white water rafting and wondered what it would be like, you just experienced it if you have a position in the markets. Quickly climbing up one white wall and then splashing down the other side, it gets tough to hold on and tough to navigate. One cold splash after another, sometimes people are even tossed off. That may not be a bad thing, because when rafting in uncharted areas, there may or may not be an unseen huge drop off up ahead. Lets take a look at the markets, and I’ll point out what I see.
.
Note : Today is Quadruple Witching. We will probably have some high volume moves today.
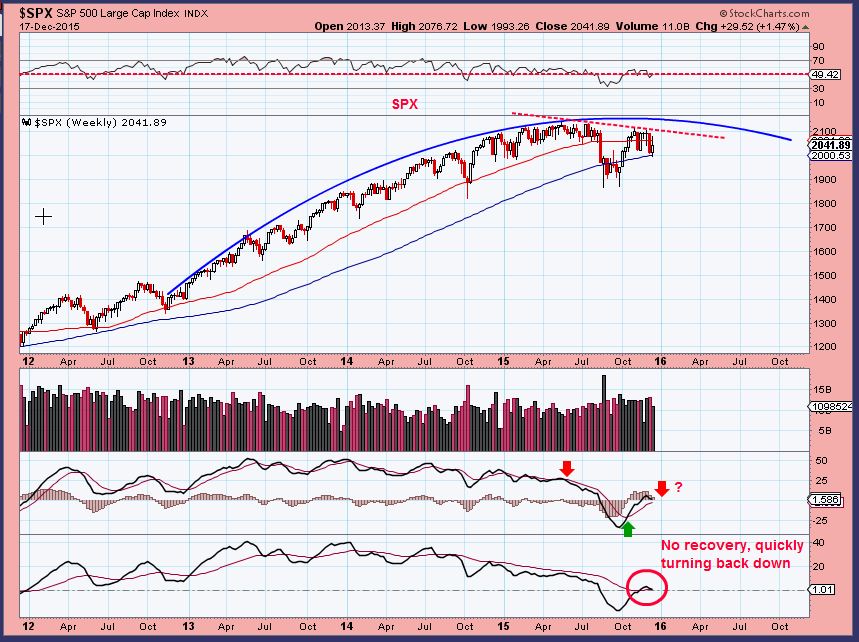
SPX WKLY – The weekly chart broke back below 2 key support areas and the blue line needs to hold here at 2000.
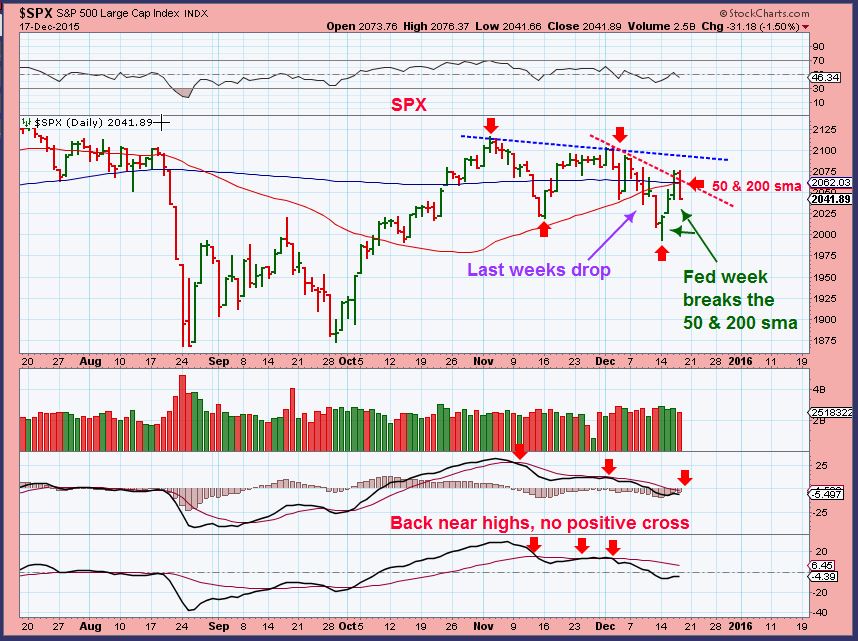
SPX DAILY – You may recall that I had a bullish view and a bearish view, but a rally at the end of Fed Wed had me leaning toward bullish break out, and here is what I saw.
1. A good size drop last week.
2. A rise heading into the Fed, last week was a temporary shake out.
3. Fed day rallied and broke above the 50 & 200 sma . Things looked bullish & sucked me in.
4. Immediate reversal lower the day after the Fed Mtg and that MACD & lower indicator cried weakness the whole time. On occasion you can get a break to new highs and then a ‘handle” to allow the MACD to catch up. I thought that we might see that here.
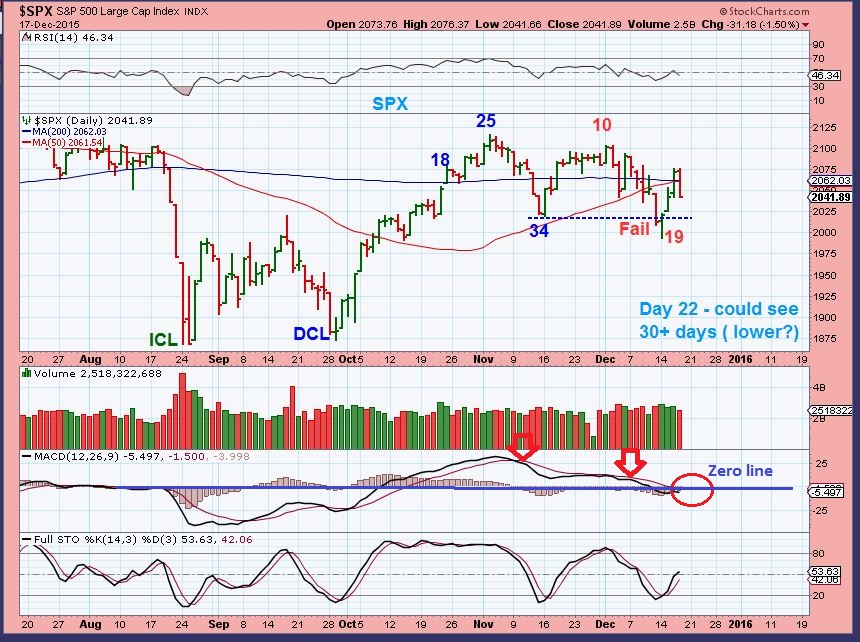
SPX – Another view. Using CYCLES, this daily cycle failed on day 19. It really should be expected that it will not go to new highs at this time. We could see 1 to 2 more weeks of weakness.
.
The next chart shows that it can be difficult to trade in these consolidation periods and remain comfortable. This is the SPX TALK. It is what someone could be thinking as each day goes by and you can see that the swings are big. These arent just up & down markets- These are Large moves each day, 30 point swings in the S&P! Thats why they feel like White Water Rapid type moves.
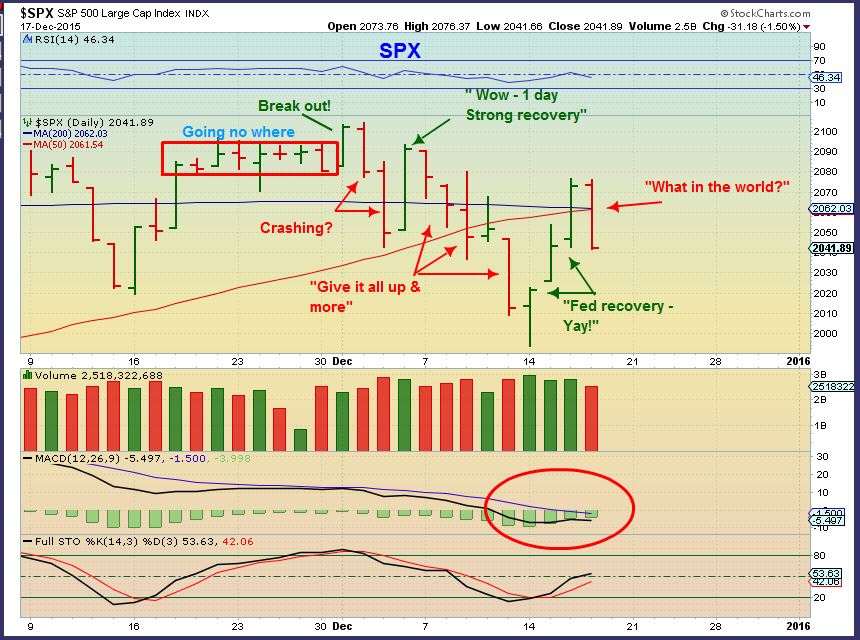
Conclusion – There may still be some good looking chart set ups, and some that I mentioned in the past are still “o.k.”. MAT, DANG, GDDY, GOGO, etc are doing alright riding the rapids, but it can be hard to get comfortable on a day to day basis and with these huge 30 – 40 point 1 day swings? Longer term market direction is difficult to determine. That 1st chart in this report still looks bearish. I will discuss more in the weekend report.
.
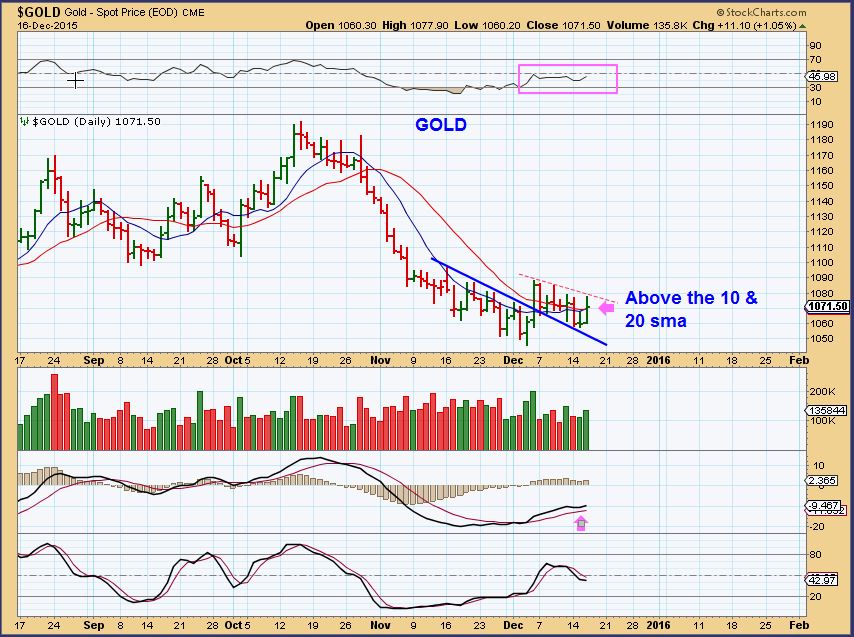
GOLD – lets just say that it also looked promising at the end of Fed Wednesday, but yesterday was ugly. It looks bearish, but that C.O.T. was so bullish I have a hard time thinking that we get a huge drop here. Lets take a look.
This bottoming process is not the same as the one in July. The July consolidation was healthy as we waited for a break above the 10sma to confirm a low. This time we already broke above the 10 sma and now we lost it. That should not happen. We haven’t broken the lows, but this could drop quickly if we do ( Final V-Bottom in Gold?).
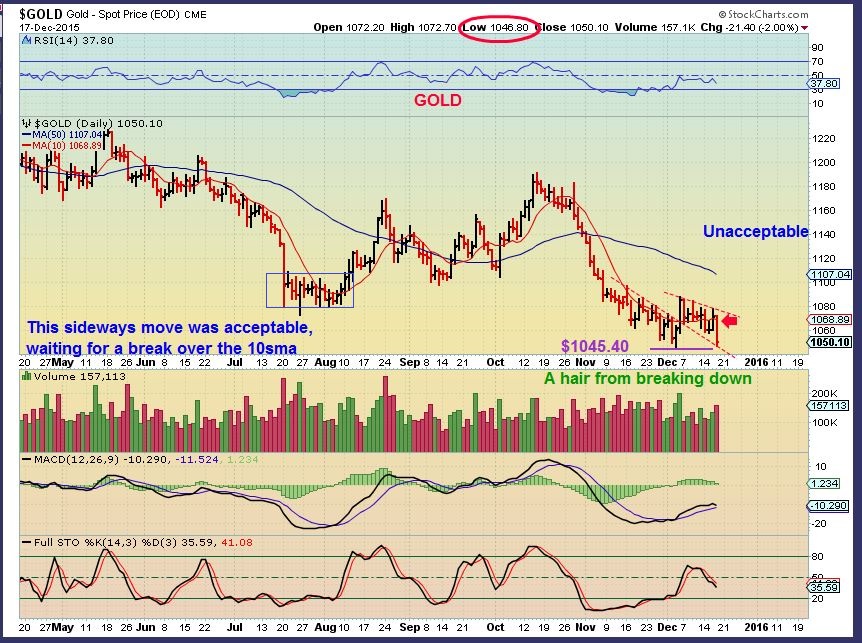
GOLD with CYCLES – This looked very promising at the end of the Fed Wednesday. Re-gained the 10 & 20sma on a fed day? And Miners all responded strongly higher.
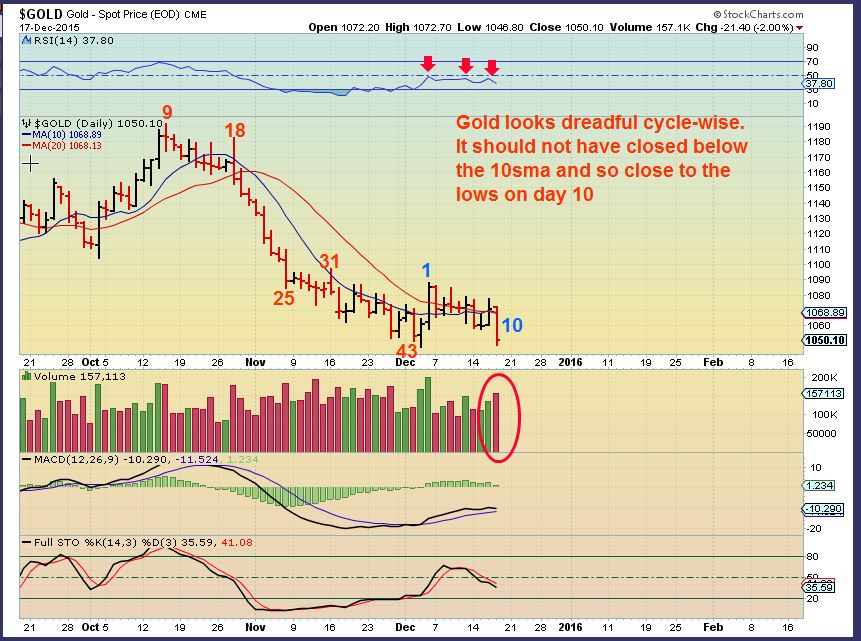
1 day later it appears that this daily cycle peaked on day 1? Gold lost it all the day after the fed. The biggest 1 day drop in months. Many Miners showed signs of breaking down, even the stronger ones. This looks like it could have 1 to even 3 weeks until a dcl. We need a break above day 1 to get bullish, but I do not think that we will see it. The best case scenario that I can imagine is a drop and a sideways move, instead of a sell off. ( Is that $1033 area a target again?)
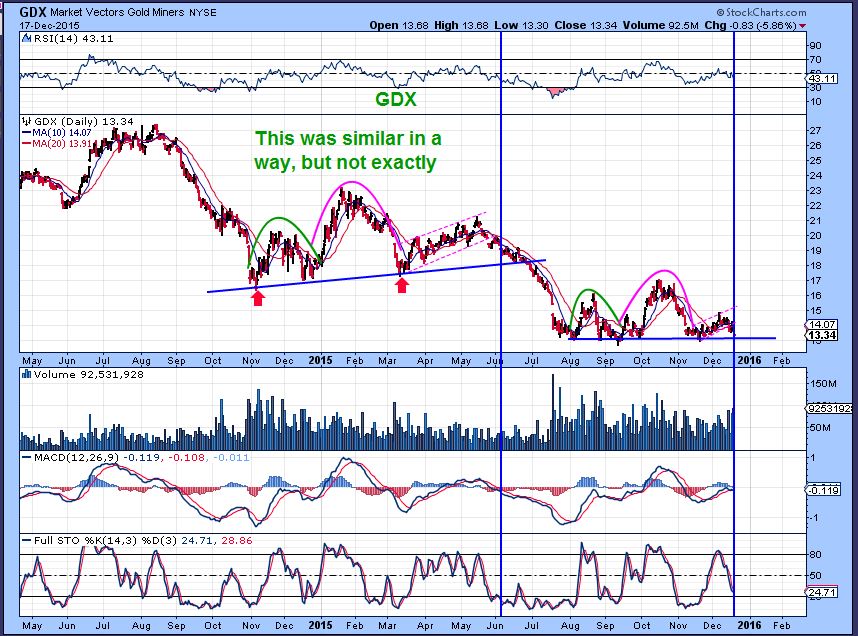
GDX – I drew this to show Higher lows and a trend line that is being back tested. This would be bullish to see it hold, especially if GOLD drops ( Miners have held up well). The macd is close to crossing down, and I do see cracks appearing in some of the nice Miners set ups. I will discuss that- it makes me cautious. The lower box is a failing TSI, indicating weakness.
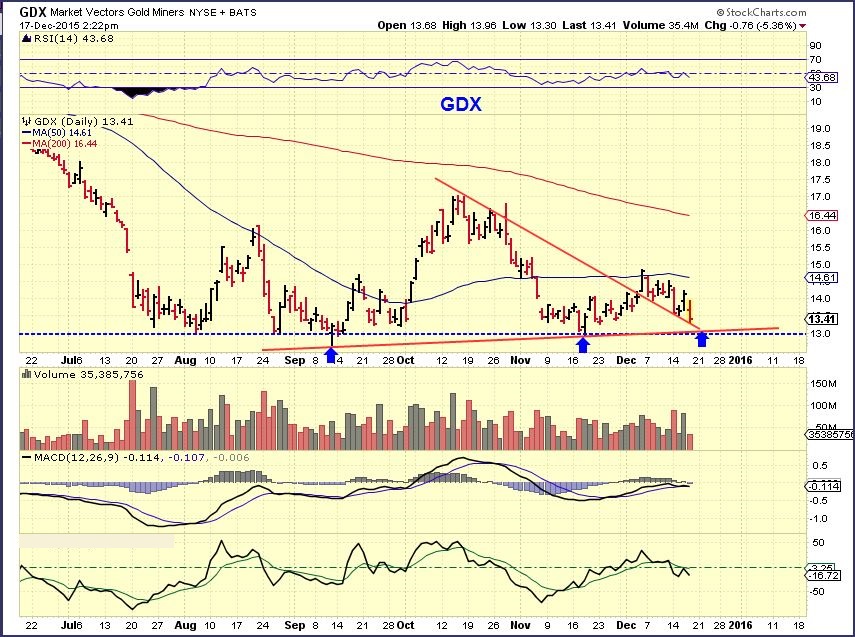
I took a step back and could see that GDX from the Nov 2014 lows through the March higher ICL look similar to now. We see 2 monthly runs higher and then the 3rd run up was weaker and rolled over. I’m not saying that we get the same waterfall sell off, but lets just keep this chart in mind.
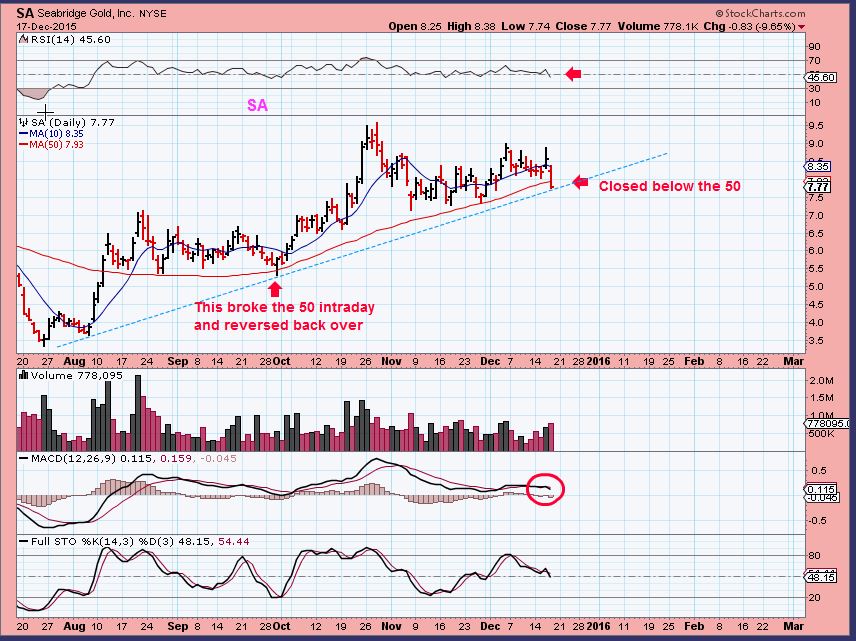
My favorite Miner ( SA) closed below the 50sma for the first time since early Aug. The volume increased and I have to wonder if Miners will get involved in a correction. The strong ones can remain healthy, but a correction is still an area that one may want to get out and re-enter positions later. looking at SA, The MACD is weakening. The MACD showed similar weakness in Sept , but price didn’t close below the 50sma then. I am getting cautious.
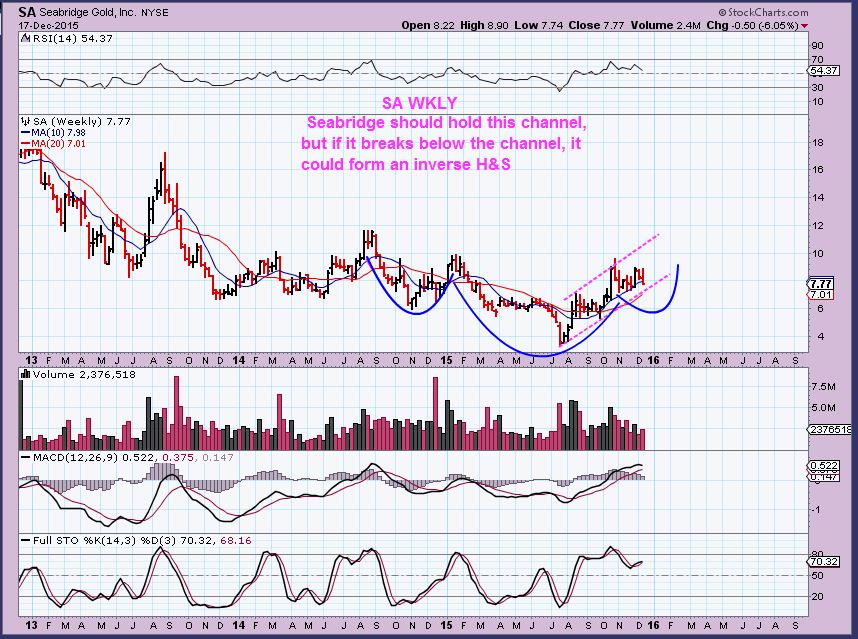
SA WKLY – IF this forms a wkly inverse H&S, it could drop to $6. Currently it remains in this channel .
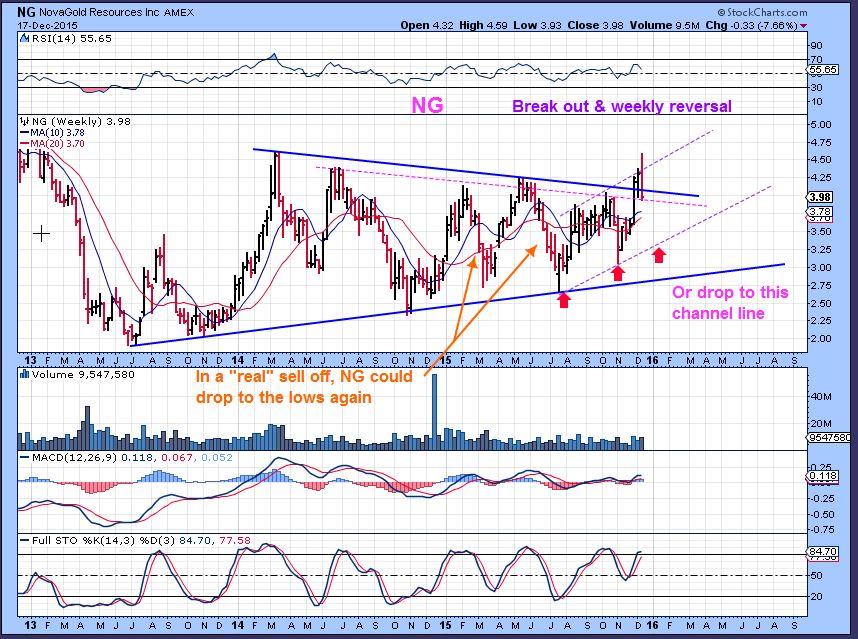
NG – Another favorite performer. It Broke out on Tuesday and followed through on FED WEDNESDAY. Thursday it gave it up. We may be forming an up trending channel in NG, but that still could include a drop to $3 -$3.25 . The higher lows from 2013 to now is bullish with Gold at new lows, but pullbacks are evident along the way.
Conclusion: I just had to write a Friday report after that Wed & Thursday trading. I personally think that the equity markets are reacting bearishly. I also think that GOLD could actually be rolling over, despite being Green this morning. Miners have held up very well with Gold & SILVER hitting new lows, so this is a bullish divergence that may be indicating that we are close to final lows in the bigger picture. I actually think that we are.
Was this just another Daily Cycle Low in Gold ( not an ICL) and is this going to become a final daily cycle in Gold dropping down into a final ICL? If so it could mean that Gold breaks the recent lows and drops for another 1 -3 weeks , since we are only on day 11. It doesn’t have to be straight down, but if we are only day 11 ( of 20 – 30 day cycle?), I am becoming cautious. I’ll discuss this further in the weekend report. HONOR STOPS and I wouldn’t jump right back in if you got stopped out. Gold really needs to prove itself here. It would need to get back above the 10sma and move above that day 1 high to show real strength, and I doubt that it can do that now. The rapids look a little tougher to navigate than when we first started this trip. With these large 1 day swings dipping and surging all around, it may be best for some to rest on shore in cash until the waters quiet down a bit. Even though Gold did not break the lows, I am not seeing Bullishness after the Fed with Thursdays drop. The weekend report will discuss things further after we get through this Friday Quad witching day.


– great analogy w/ the ww rafting.. wild .. just wild
-bummer ng & sa – but it was a run & tight stops have been my nemesis, but in this case I was bumped out wed on ng & saved myself a nice chunk of pain ;o)
– hilarious spy talk chart…that pic of (me) w/ my mouth open&red glasses would have been a nice accompaniment … giggle
fwiw … SA im still practicing patience to see if this pattern plays out… i have wiggle room and am playing the longer term wave pattern, (tho – if i had time i would trade around it)…in the meantime…. still watching … a wave 5 shows to be on deck at some point here-granted 4s can go on 4ever… (if my count is correct ;o) will stop out if that fails….
https://www.tradingview.com/x/V5E7Vi97/
Honestly I was picturing the same thing. The 5 waves up was playing out very nicely. The 2 consolidation periods above the 50sma were perfect. That chart is a great looking chart.
That SPX talk chart is what so many must be feeling. 1 day up 30 points ( WooHoo) and then a smash down of 40 points. Then a break out, then a break down. UGH. Sideways years are tough…give me a good trend any day 🙂
I know it seems impossible and everyone is expecting lower prices, but I wonder if gold could have formed a double bottom yesterday? Wouldn’t that catch everyone by surprise if it were to ply out?
I would agree that it could be possible, but …
Using Technical analysis alone, it wouldn’t be odd at all, but using cycles? – I cant recall bullish activity after gaining the 10sma near day 10 and then losing it quickly. I didnt go back and check to see yet, but I will.
In a double bottom theory, yesterday would have panicked people out with a 1 day slam. yesterday was the biggest 1 day drop in months and didnt break the lows, so that is good, but if the lows give out, I think we have more downside.
Alex.. what do you make of the expanding bottom possibilties? (posted late, after hours in thread yesterday)
Lower trendline hit & bounced off in both gold & silver.
Could still do one of your overshoot shakeouts, of course.
I see what you are pointing out. I see it maybe more with the SLV than the GLD, becaus the GLD middle drop didnt tag the lows.
Usually in this pattern it plays out as a 1-2-3-4-5 or an A-B-C-D-E – thats why the SLV looks closer.
Charting TLs purely on the closing prices (ie. red candle cant finish below the lower TL/ green candle can’t close above upper TL), then i have tags on GLD/$Gold, SLV/$Silver & GDXJ.
All except GDX.
Did GOLD just re-gain the 10sma?
These White Water Rapids are exhilarating !
Did Nova Gold & NEM really just take back more than 1/2 of yesterdays candle? That is often regarded as Bullish , and we get another swing in GDX. Crazy.
( GDX needs to break above the 10 sma and an overhead trend line break to add confirmation. Swings have been breaking down in GDX lately).
I don’t like the looks of GDX:GLD
The monthly is downright UG-LEE
giggle
I always get a sell signal in GDX:GLD when miners dip down into their DCL.
Some people use a break over the 10sma on that chart as a buy ( I use that and a trend line break )
Look at MUX recover from the last few days.
I lost track of MUX – that really held up well at recent lows and recent down days. nice.
..my little ‘engine that could’ (no position) buttt .. u know how i do ;o)
Crazy end of day triple witching moves in MUX and LSG. Don’t know if it means anything but at least it was up.
Last 3 days silver’s been up about 40 cents, down 40 cents, now up 40 cents. Things are,supposed to get very volatile when probing a bottom. I guess this is what they are talking about.
i know .. crazy.
fwiw… ive been licking my chops tracking this pattern…
https://www.tradingview.com/x/6MuGNLnV/
you thinking maybe this finally is the 5th of 5th?
i do… butt 5ths extend.. sooooo .. caution advised until the checkered flag waves in all it’s glory…. ;o)
i know.. so many false dawns!
Looks good to me !
I am trying to learn to trade in direct opposition to my emotional state. When I am confident of a trade I usually lose money. Yesterday I bought SLV and NUGT and JJC and could not sleep at all last night. I felt terrible about the trade and was sure I had made an awful mistake. Take from this what you will.
Buying the dips is not easy ( Nice job) at lows, and selling the rips is not easy either…and that is based on emotions.
nice trade Alan.
Bill…. did you saw (see below) my question from yesterday?
I’m still looking forwards to your response.
Many Thanks, and….. have a splendor weekend.
Geurt.
——————————————————————–
Bill • a day ago
https://www.tradingview.com/ch… see more 1
Geurt. Bill • a day ago
Dear Bill.
How do you know we probably go that direction Bill, it’s almost too beautiful.
Many times you were right.
Anyway you understand it much better then this doc.
Thanks for your help and response.
COT got a little more positive thus week especially for silver.
Just got them, Silver is better than it was in the March ICL.
Did you see that chart of Silver the past few days including today? CRAZY!
Possible turn coming in OIL…
Check out NADL ( up 60% today!) and look at volume in REXX, HK.
Loo at GTE, AREX, ZAZA ( 50%) and UPL
Oh yes, and DQ for Maria – it didnt even drop. hmmm.
oh myyyy :-O (my gum just fell out of my mouth) ;o)
Giggle
Oh wait…Thats your line, and I hear that real men dont giggle.
“CHUCKLE”
lol.. i picture u just throwin ur chin up in the air and blowin air out ur nose…snortin style..
… orrrr shaking ur head/rolling ur eyes simultaneously… ha ha
**and smiling 😉
No snorting : )
Something like BAAA HAAAAH HAAAA HAAAA!
…
orrrrr… ur not a ‘real’ man…(me nodding my head making a robert deniro face ….
i was looking at arex & upl .. jussssst about to write “these two doin some work…”
have a great weekend my friends… :o)
https://youtu.be/hHFFx5720_M?t=3
..
Hey..the nuns are singing my song right now….
..