
Is It Fed Wednesday Again?
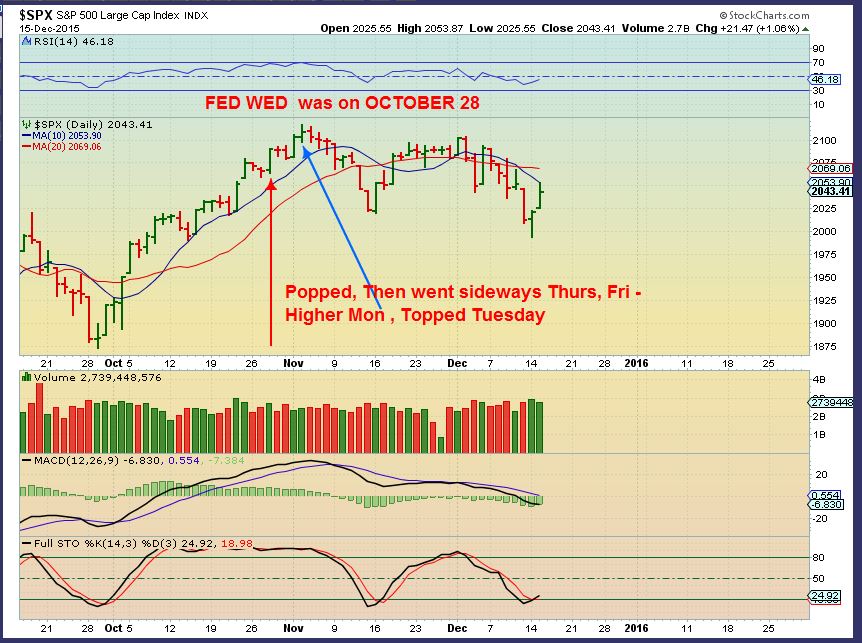
On a day like today it feels like there is so much to say, yet what can be said? Lets do something a little different today. lets look at what happened on OCT 28, the last Fed Mtg.
.
SPX– After Janet finished speaking, the SPX closed higher (Red Arrow). It paused for 2 days, and then had 2 more up days and that was The Top. That Fed Wednesday was exciting, but it was rather short lived when you look back at it.
This is interesting…
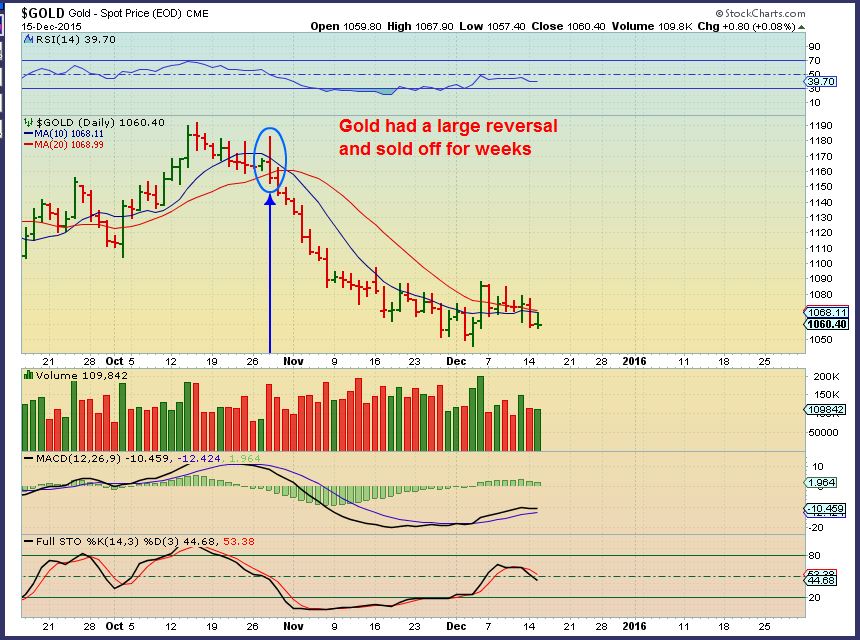
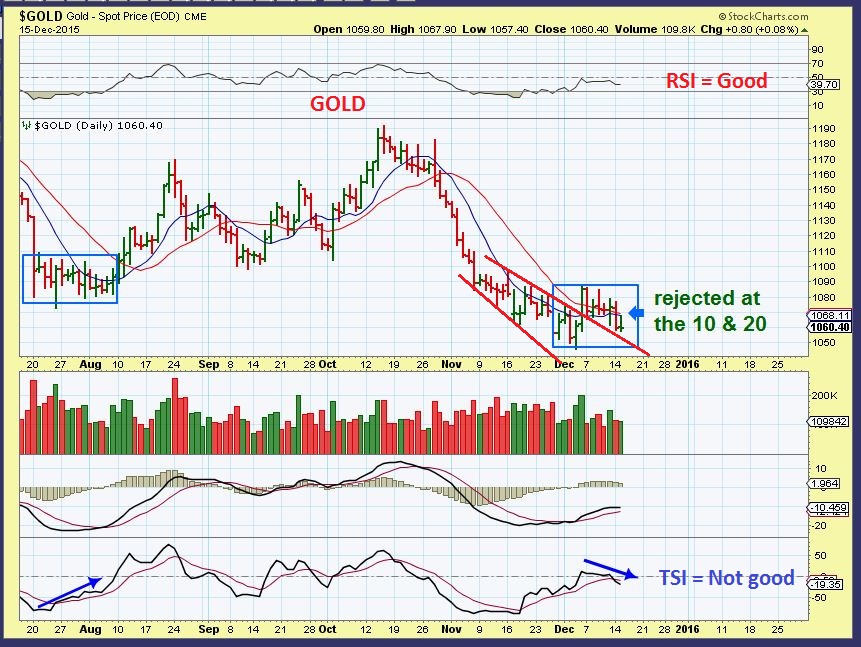
GOLD had that massive reversal day and sold off seemingly endlessly.
That might make one think that is a good time to short Gold and go long the SPX, but might this really mean that the news is already baked in? With the Gold COT showing that smart money is long Gold, and the SPX COT shows that they went very short, I would use caution. We’ll talk about this more in a little bit.
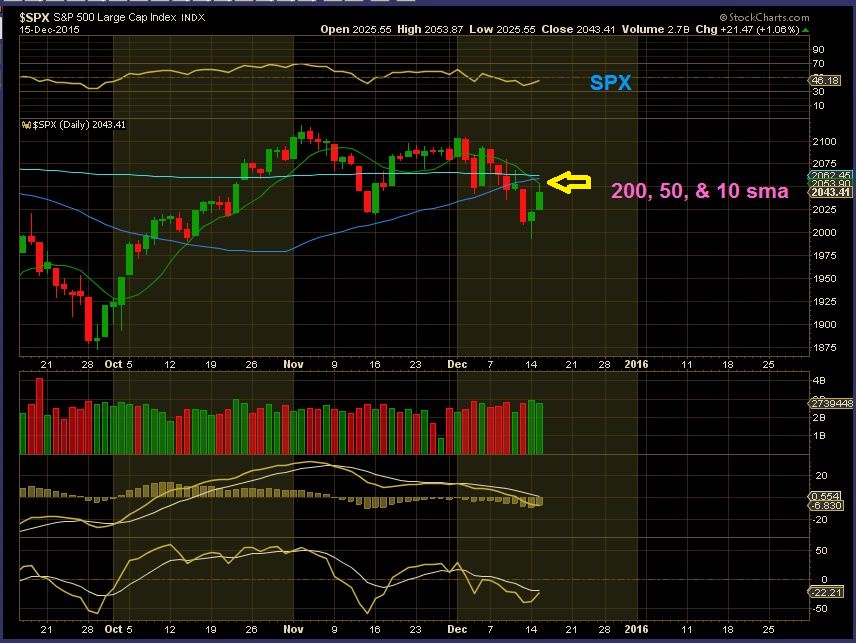
SPX – Currently the SPX paused and pulled back at the 200, 50, and 10sma, but that doesn’t matter on a Fed Wednesday. The FED MTG can give this the Bullish push it needs short term. Longer term, I see possible trouble and will discuss that in a future report. The SPX COT showed the smart money was more short last Tuesday than they have been since last January. Interesting. Was the recent drop enough?
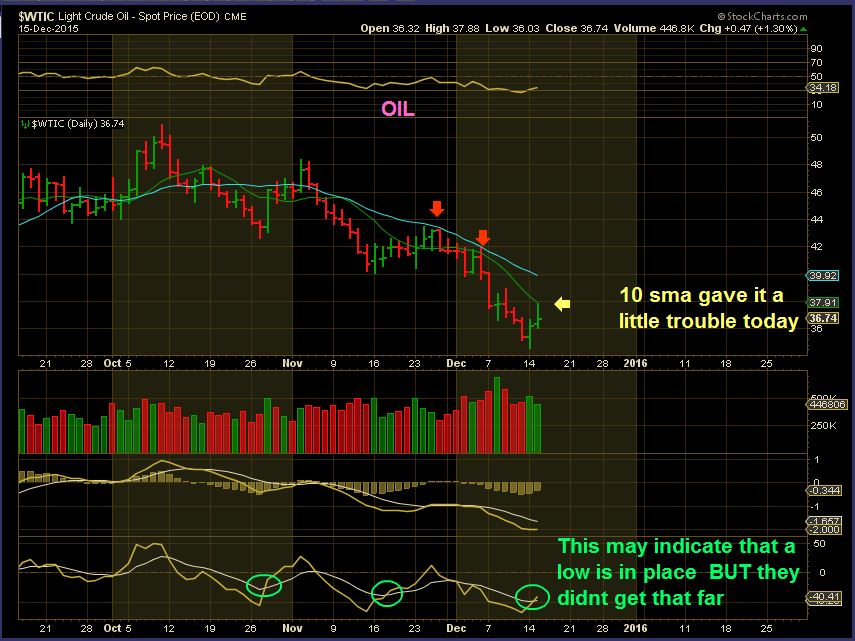
WTIC – This ‘might’ be an ICL in the making, but I recommend caution until the move proves itself. Tuesday Oil was stalled at the 10sma. It has struggled at the 20sma, but we do now have a swing low in place and a cross on the lower TSI indicator. That could be short term bullish.
GOLD – SO much that I want to say, since I’m really getting mixed signals here. This is the bearish reasoning…
-
The sideways move at the lows in July caused a TSI cross higher in the lower box. This time we have a bearish cross early in the count.
-
Rejected at the 10 & 20sma and again, early in the count if we are watching cycle timing. ( $1068 is the number to beat for both!).
-
The Big sell off after the Oct Fed Mtg was supposedly a reaction to what is going to happen today. Will there be more follow through ?
Gold – Why not bearish?
1. The COT and smart money set up.
2. The news could be baked in ( and it may have been a false reaction to sell off Gold with a Fed Hike).
3. In the past, Historically GOLD rallied when an interest hike came.
This is a Fed Thing, and we have to allow it to play out. If you go back to my SPX Chart above pointing out the October Fed Mtg, it was a false rally wasn’t it? We saw 3 up days total after that mtg and then a sell off. 2 months later, those highs in October were The highs so far. Gold sold off mercilessly into December, but the Miners didnt. It remains a bit unclear. Lets see how things play out after today and maybe tomorrow.
.
Short term this is a 2 hr chart of GDX, so each candle is 2 hrs. Here I am just pointing out that GDX popped higher for hours every time we had the current MACD cross condition. We are almost ready to cross here. It may only be for 2 hrs or 4 hrs, but that means that GDX could rise heading into the Fed Mtg. Why point this out? (Click to enlarge)
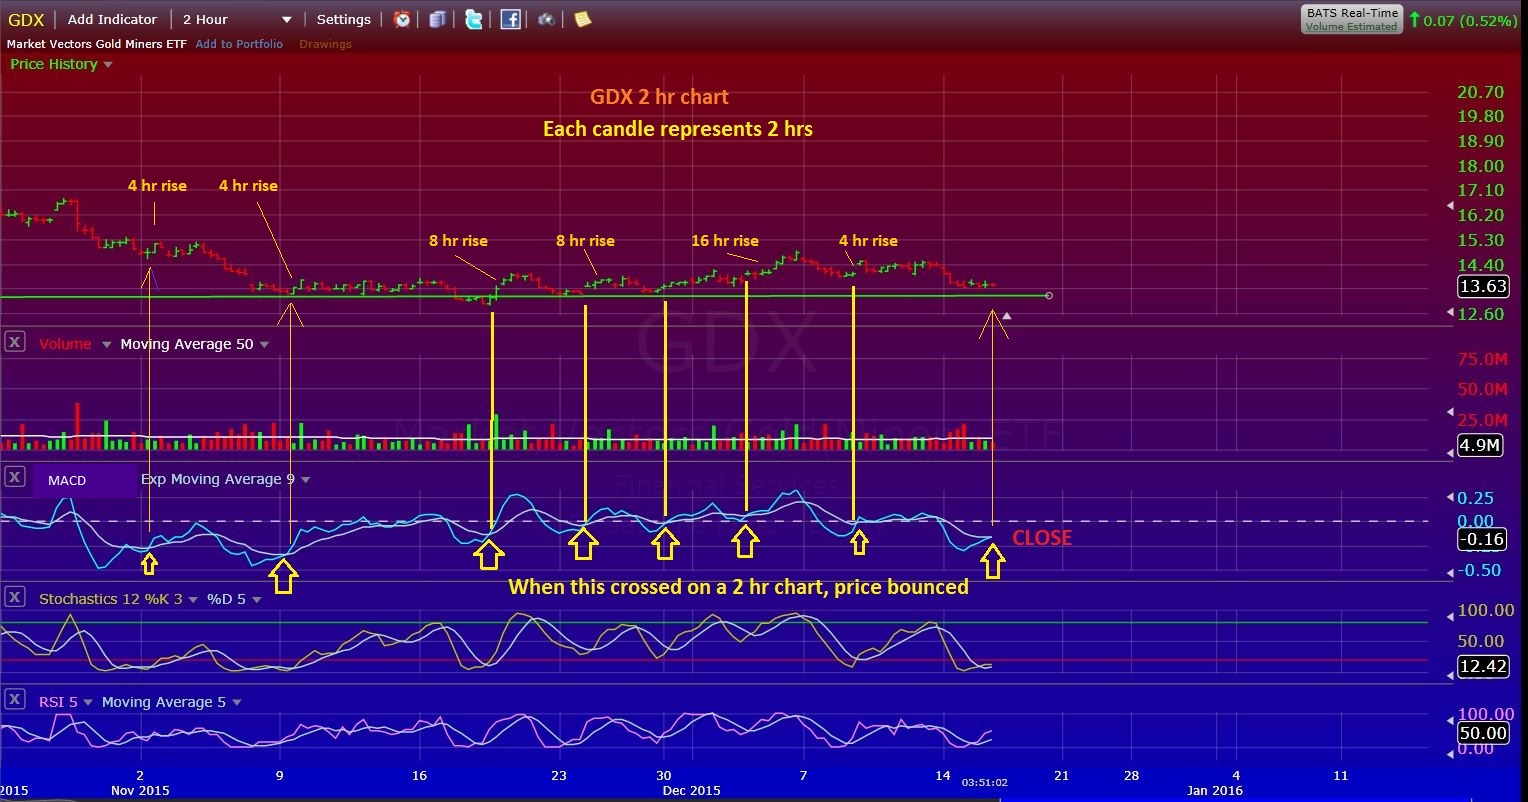
Some may be holding positions and still may not know what they want to do. You have a few hours to decide. Hold on and take a chance? Sell and just step aside until the dust settles. Well maybe GDX will rise for the next 2 – 4 hrs while you decide. ( Unless Gold sells off first, then that MACD cross may not happen).
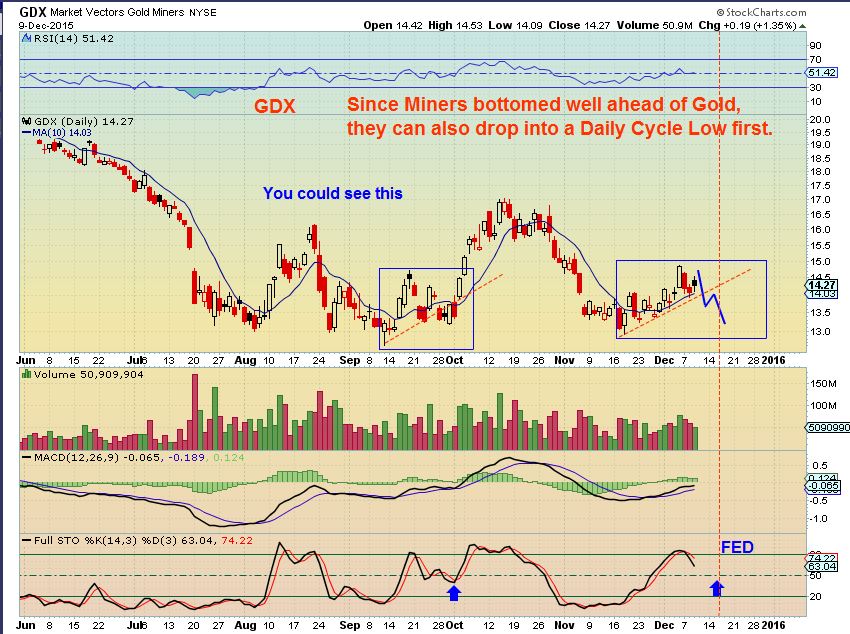
GDX REVIEW – Dec 9 we knew that Miners could drop like this going into the Fed mtg, but it looks uglier when you live it real time. We would want to see a higher low as shown.
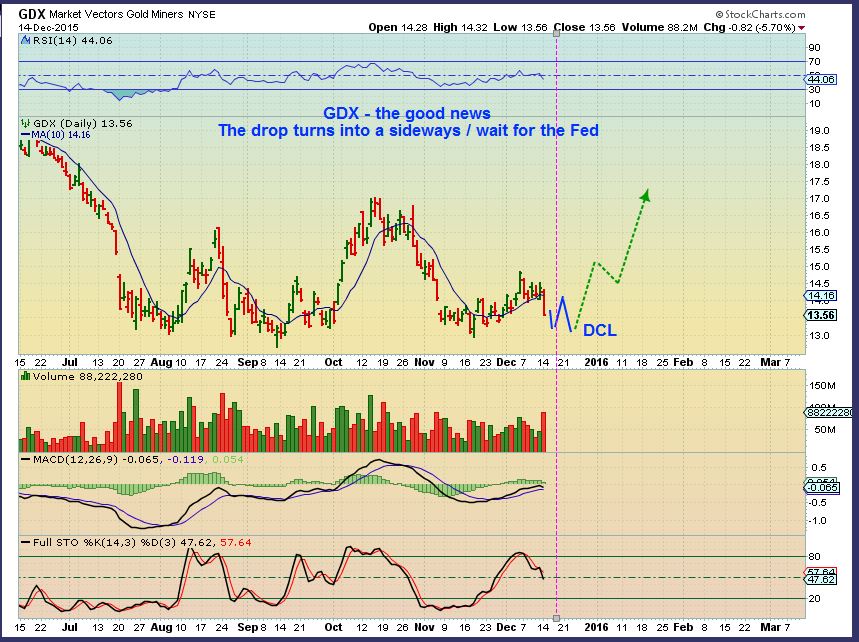
GDX – A drop like this , bounce, and drop to a new low would give Miners a DCL that remains quite bullish. Again that current Gold COT reading seems very bullish.
GDX – We could just sell off and drop to an ICL for Miners. The reasoning being that Miners bottomed last after Gold & Silver bottomed in the Summer ( GDX in Sept).
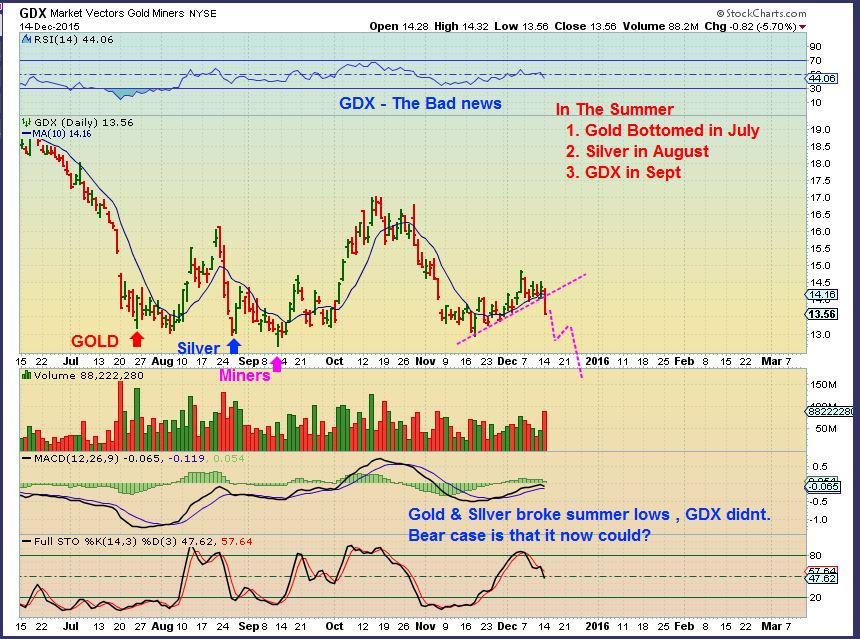
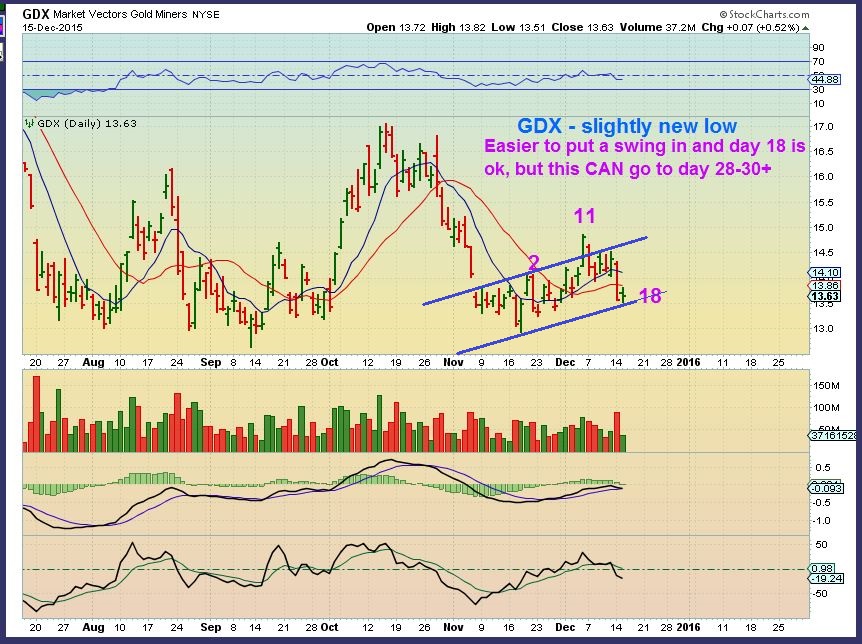
GDX CURRENTLY – The good news would be that GDX put in a slightly lower low on day 18. That means that a move higher tomorrow could fit the timing for a dcl, and Miners could rally. Also I can picture this as a 1/2 cycle low. New highs on day 25 , and THEN drop into a DCL day 30.
MINERS WONT RALLY FROM HERE AND PUT IN A DCL IF GOLD SELLS OFF AFTER THE FED . This Fed Mtg is historic, and the reaction in October was bad for Gold. Lets see if that was an exhaustion / overreaction? Or is there more possible downside.
………………………………………………………………………………………………………………………………………………………………………………..
Finally I had mentioned in the weekend report that I did a study on the $XJY . I got a question from a reader and I wanted to answer it here in case others had the same question. The question was:
The Yen consolidated between 2011-2012 then dropped. It also consolidated sideways in 2012-13 and dropped. Now it looks to be setting up for a consolidation and another drop lower. That would eventually fuel yet another rise in the SPX. Isn’t it doing exactly the same thing now?
So the question was since the YEN went sideways at the 2011 top and also 2012 , and then dropped with GOLD, causing a rally in the SPX. Why isnt this current consolidation in the Yen the same in my eyes?
My answer is that in the BIG picture I do not see these as the same type of consolidation. I actually see what looks like a topping pattern in the SPX , and I see this wedge in the Yen, which would be a bullsih set up. The Break out from this pattern was exactly on the day that Draghi spoke in August. The MACD looks bullish and the RSI is rising. The yen could drop to test the trend line, but it doesn’t have to. So the Yen could move higher, Dollar could Top, Gold could Pop, The S&P could drop, and everything that we’ve seen for the past few years could change. Time will tell.
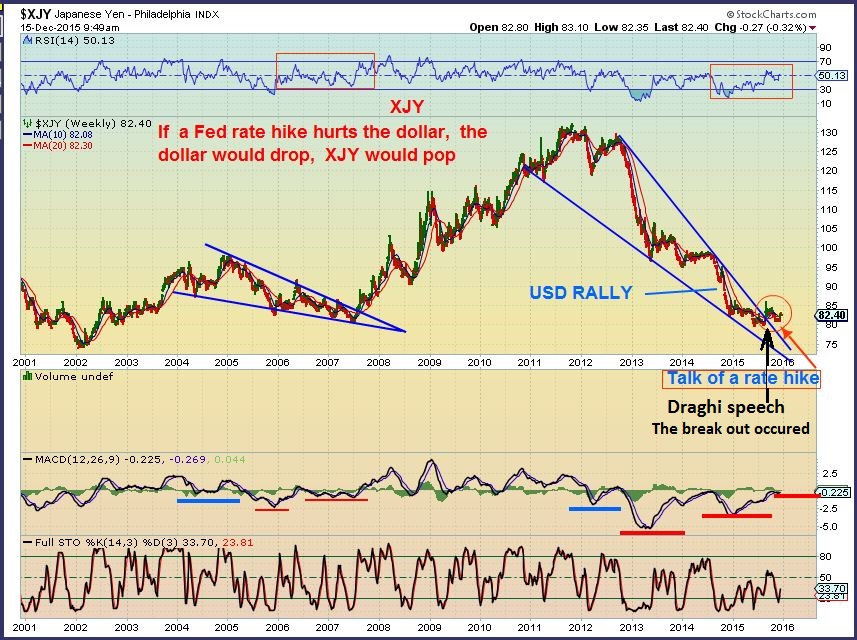
I hope that helps to point out the big picture of what I see in the YEN.
.
As for FED WEDNESDAY, it’s a mixed picture. Lets be honest here, I dont think ANYONE can say for a certainty what will happen late Wednesday and Thursday in the markets. SHORT TERM it is very tough to call. The SPX COT looks bearish and Golds looks bullish, but the initial Fed reaction can move markets in a false direction for days. Miners are in the process of finding a DCL or 1/2 cycle low on day 18, but it can also extend lower for 10 more days or so if Gold sells off. Please protect your positions if you are invested in any of the market sectors. Cash is the only predictable holding. Cash will stay the same after the Fed Decision, right? This is an historic Fed day. Reminder: It can lead to false reactions and crazy moves. Best wishes.


Alex,
I’m showing the combined contracts on the stock indexs only very modestly short at -1.65 billion net short. It’s been as high as – 40 billion at previous tops.
My point wasnt that this is as short as they ever have been. I am looking at many things and pointing out the COT for this reason:
Yes, they are only modestly short going way back, but for this year, they have not been this short unless you go way back to January. SO looking at a 2 year chart – The Markets have been going sideways for a year now – Todays price for the SPX is the same as the SPX price last January.
Is it a bullish 1 year consolidation? Is it a topping process?
If its bullish, why did the smart money just go short SPX so much for the first time this year as an interest rate hike approaches? Why is smart money long the Euro and the Yen and GOLD? Why hasnt the TRAN or IWM recovered? The 2 yr chart of the TRAN is ugly.
It just stands out as odd to me when I reason on various things.
I think you might be only looking at the large SPX contract. If one only looks at that contract alone then yes the COT is the most bearish of the year. But many big traders arbitrage between the e-minis and the large contract, and there is actually a lot more money in the e-minis nowadays than the large contract.
Anyway if you combine all index contracts, both large and small, the net short commercial position right now is -1.65 billion. The net short position last January was -38.2 billion.
But you are right, there are plenty of reasons to be nervous about the general stock market. I wouldn’t sell it short though. Central banks have a printing press after all….
I wouldnt go short with out further proof either ( especially on a Fed Day).
Watching the 50& 200sma, the SPX is below it, but DJIA futures place it as opening above both. That would be pretty bullish psychologically if they close there.
“pop” goes $gold! Let’s see if it can last…long day ahead. Gosh this is confusing!
The good news to me is that GOLD broke above that $1068 ( 10 & 20sma) that stopped it yesterday. If these turn upward, Gold would be on day 9 – it has tagged that break out line shown in my Gold chart, and could enjoy a nice run higher with a bullish COT.
Miners could put in a DCL or that was a 1/2 cycle low on day 18.
It all looks bullish , but on a Fed Day… you have to expect volatility.
That is HUGE volume pre-market for GDX ( Up 30cents) .
In the past when I have seen this volume pre-market, we have had over 80 million at the end of the day. Lets hope GDX closes GREEN. That would be excellent.
Good morning, Sherlock – I mean Alex!
Do you have an opinion on the observation that yesterday’s action occurred on such weak breadth (since 1965, it was the 3rd weakest breadth on a day when the market is up 0.5% or more) that it calls into question how long it can last? May support your thoughts that any Fed bounce could fade?
🙂
Hi Cal,
You’re the Sherlock, I wasn’t aware of that statistic, maybe because I was looking at many other things in my research time. Thanks for sharing that.
It does add a little curiosity to the picture, but I also have to yield to the idea that the day before fed can be a little ‘different’.
… solid solid solid reports this past week CF…sooooo much to take in …thank u for your efforts & dedication; i am both grateful & envious that u can allow that wonderful higher frequency creativity to find expression in your research and offer it to us here in your daily reports&analysis.
Sharing your experience ……. priceless. 😉
Thank You very much Maria – it means a lot.
Sometimes I look at so much, and I have so much to say – then I cant imagine how to put it down in words just hoping that it’s understandable. Add the Fed to that? I begin to wonder if I should say too much at all , because it seems like almost anything can happen on Fed Days 🙂
I appreciate your kind encouragement and also everyone in the comments section that add life to the reports too.
Would most definitely second Maria’s comments Alex and your reports are always VERY understandable. Getting all that information distilled into a batch of charts and concise but very meaningful comment is an art in itself and you do it extremmely well. And Fed Day or not these markets just seem unbelievably volatile now from one day to the next with no real rhyme or reason. So trying to make any kind of ongoing comment is a huge challenge which you take on admirably. I’ve been sitting on my hands for what feels like weeks now but with hindsight actually glad I have as trying to find any kind of meaningful medium term trend is proving especially difficult of late. But maybe that is also a sign of MAJOR inflexion points developing in many asset classes as you have suggested in some of your more recent reports. If that proves to be the case then some major new trends will develop and as you say, spot those and we have the opportunity to make some serious returns. But for now it’s still PATIENCE and watch and wait…at least for me it is! But hopefully not for too much longer!!
Thanks Chris – And I agree , Patience pays off very well in volatile times. I have been trading and at times it feels like over-trading when you have a nice set up that just gives it up due to market volatility.
Look at charts of DANG & GDDY that I mentioned 2 weeks ago. They still look set up nicely, but they popped & dropped so far and are basically where they were when recommended. The gains need to be scalped lately, my buy & hold trades are break even
As a trader – Seems I can only make $$ when they pop and scalp them, but I have a tendency to let my stops take me out , so unless you raise your stops, you’re in a position for a while with dead money.
I’m hoping for a change in Miners – for lows to be put in and a change in character back to a bull run mode. ( Love SA, NG, and a few others) where you can buy and hold and ride them higher.
agree… SA&NG kinnnda make up for the chopchopchop of my energy plays…yuk 😉
ps. and u would *think* it would be *easy* to let these two run… it’s been taking loads of discipline, self-talk & deep breathing….;o)
Can’t agree more Maria. I think we all learn sooner or later than one of the biggest challenges in tading/investing is dealing with the emotional aspects. Well I suspect we either learn or eventually go bust!!
I have sold SA 2x – and one time it was right before another good leg higher, so I missed a nice October run higher..
If you use a 200sma and a 50sma, you can see the battle lines. Bought on the 50sma, but Oct 12 – That was an engulfing candle and I thought it was going to lose the 200sma, and instead of allowing a stop to save me, I didnt want to lose gains. Locked it in and away it went upside.
SA is a great looking chart now above both the 50 & 200sma.
Buy & Hold from July Gold lows would almost be a triple, but I never would have trusted it and held on.
WHEN GOLD finally bottoms, Many will do this.
I hope that others follow this strength and then I can be more long term focused too.
It’s a constant psychological battle but I’m gradually learning that scalp type trades do not suit my personality. But as you say fast scalp trades are pretty much all that’s working right now..or at least seems to be wherever I look. But as you say if we get back that change in character in miners for instance then medium term trades will become very viable once again. And looks like you were right to remain wary of oil, which I see breaking down once again. But with each passing day potentially getting closer to a major cycle low there as well. Also saw a very interesting chart tweet today suggesting we may be closing in on a combined secular as well as cyclical low in nat gas. As you’ve suggested we may have some big new themes to play in 2016. I hope so!!
Chris I’m the same way with wanting longer swing plays, but it just hasn’t not worked well this year at all. I find if I plan to be in and out, I do better and when I lose, I keep it small.
I have had a few trades of slow accummulation, where each low I pick up a little more. In a bull run, that should work. This year it was disasterous with each time worse than the one before. So, idk, just sharing.
Would have to agree with you Cason that it’s been a VERY tough year trying to find good medium term trades. I certainly don’t want another year like this! But hopefully Alex is right about some of those ‘super tankers’ turning and we will see some great longer term trending moves in 2016. The only challenge then will be to spot them, climb on board and hold for long enough. Hopefully Alex will be a huge help there. 🙂
I thought we might get some of that in 2015, but not yet. I think we needed to get that super scary rate hike out of the way for gold to bottom. I’ve been saying that for over a year.
Yes, I think we have a good Captain, I’m looking forward to it!
I have to say…those charts of SA and NG ( Nova Gold) Are a thing of beauty.
NOTHING bearish about the pull backs on those.
B-E-A-U-T-I-F-U-L
pleasure ride indeed…;)
AMAZING REAL TIME : )
Alex….. let us know after an hour what your short thoughts are after 2.00 pm. Thanks a lot !!!
That wont be enough time to gain an edge. I have seen this activity in the past and buying & selling comes and goes in waves. I’ve seen Miners sell off at 2 p.m. – then buying came in from 3 to 3:30 and then it sold off to new lows into the close.
This volatility could remain through tomorrow morning. There is no edge to gain today
CDE, AG, NG, SA, etc …They are all up around 5% – If they close up there or better, that is probably a good sign. Everything got Crushed pretty good on OCT 28 ( The last Fed Mtg)
On OCT 28 – GG got killed, today it is at the day highs, still up 6% .
GDXJ gapped open on Oct 28 and put in a huge reversal lower after the fed mtg , it got killed. Today it remains green
SLV still looks very strong .
The dollar Popped and now has dropped
I would say that if the miners , SLV, etc can close up a decent amount, it will be a bullish move going forward.
You are right Alex….. you know the market better than me.
I was just curious how you see the market after the tam-tam.
But I need to be patients.
Thanks Alex.
Well, Janet is speaking and so far most miners look to be holding up very well.
Above their 10sma is a good thing, so I would say that this wasnt a bearish slam on Miners so far.
AMEN !!!!
Do are great my dear.
I read today how many subs you make really happy !!!!
I think I (try) to make a letter and send it to the FED – commission.
How does this sound Alex?
LOL – I’m not sure what your letter to the Fed would say, but you may want to wait… she is still talking and could say something to upset things 🙂
So….GDX looks very good right now on a daily chart and GG, ABX, And NEM also look very good.
This may be day 2 of a DCL in GDX, or just a 1/2 cycle low that will take GDX to new cycle highs and then we get a 2nd daily cycle.
Either way, that 2nd daily cycle should do well, since Miners are holding up so well Vs Gold & Silver lately. I dont want to speak too soon, but this is looking good on a Fed Day with her speaking.
Has anyone else been watching the Solars? I mentioned how thye looked good, and then suddenly got smashed down and recovered. Today their charts look great.
WNDW, SCTY, FSLR, JASO, JKS, TSL, YGE, SPWR, CSIQ, RGSE, VSLR
Still watching TAN, but not individuals.
Alex, GDX with SL but TL still not broken and still below 10dma (barely). Do you have any more metrics to say we’re possibly into the next DC? Thx in advance. Totally got bamboozled out of ABX yesterday and not keen on ‘revenge’ trade–mine never work out well. 🙂
GDX just popped above the 10sma and the MACD never crossed, it is turning up. I think this looks very good right now.
I have seen things sell off into the close, but right now the volatility moments seem to have passed from 2 to 2:15 p.m.
Thx!
On OCT 28 after the Fed ( I was on an airplane that day, but when I looked charts over late that night ) It looked like Miners just sold off , bounced, sold off, bounced, etc etc etc all the way into the close.
I see Miners at day highs this time. This is not the same as what we saw in OCT in my opinion.
See HL, CDE, ABX, GG, PPP, PAAS, etc
At this point set ups like AG look like a buy – Pushing above the 50sma forming a possible A-B-C type move.
Alex, this isn’t possible. My ‘friends’ on ST have been saying for two years that a rate hike will kill gold and send crashing below $1000. And they can’t all be wrong. Just not possible. 😛 :0
What a day. Like how miners close the day. NGD all the way…
I have seen it pop on Fed to give it back on Thurs so I am waiting out one more day…
don’t blame you.. same here
Just average down if needed all the way to $2 if needed. Solid company with mucho reserve
I’ve done that before. Wasn’t pretty! But yeah, I’m going to take a hard look at NGD.
I remain bullish on general markets for the short term. Had a couple of charts that I meant to share and haven’t found time, will try to do that tonight.
Sorry, this isn’t too timely. The ‘buy’ on S&P/DJIA was on Monday AM reversal. Will it just do a few days pop and then rollover (like in the top of the report)? Possible. I still think that we have a sea change for 2016. I just think that there could be one last new high out there.
XIV (inverse of VIX) to SPX – pretty Stoch cross, pull back in from lower BB and vertical support.
NYSE – stocks above 50 day – was in the lower reversal zone on Monday. Stoch is pretty but but I see some neg. divergences with MACD. So, good for now with holiday season, but all bets are off in Jan.
Refresh
Gold pretty weak in Asian session so far; silver still looks pretty good. I do find it interesting that the majority of metals gains was actually this morning, NOT in the afternoon Fed session. We’ll have to see what tomorrow brings, but the decision not to make a late afternoon chase probably a good one.
Nat Gas potential for first up day in forever (have no idea but it’s been weeks). Question will be is if it can approach 20 day, is it coming out of ICL which could power through or is it just time to short the ride back down. Inventories in 2 1/2 hours first, could be bad. It’s been downright hot on the east coast.