In The Charts
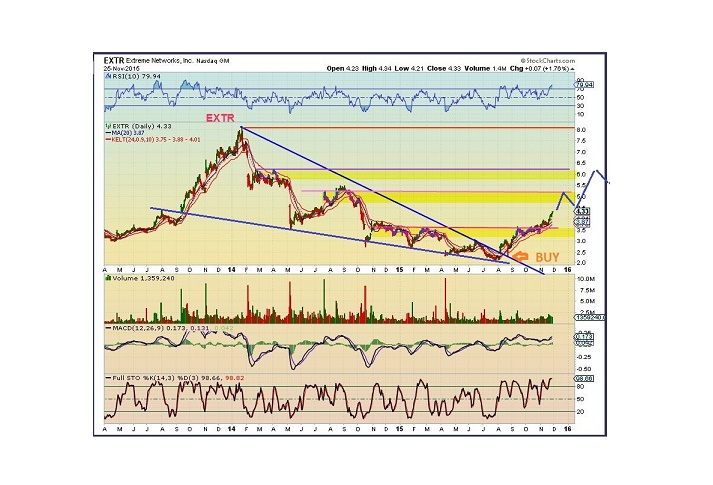
After this weekends report, I wanted to look at some charts of stocks for buying opportunities. The theme chart above was an older buying opportunity that is now a bit extended. It may pullback and offer another low risk entry, but here are some current opportunities…
With the last few reports basically focusing on Precious metals and the likelihood of a multi week run, lets take a look at some Miners first. One slight problem is that as noted in prior reports, the Miners have been advancing even though the Metals have been making new lows. That means in some cases ‘low risk’ entries may be harder to find, because they have moved above those areas already. Some may prefer to wait for a pullback before entering? With that in mind, maybe I can show you some examples of overall bullishness and you can enter with partial positions or wait for a pullback. With GOLD & SILVER Dropping here, adding a little on pullbacks puts some skin in the game from a less extended point.
Keep in mind that I am seeing Miners really taking the lead here, some developing strong looking bases and others that I have pointed out actually bottomed yrs ago. So it is possible that Miners may begin leading us higher. If that is the big picture view, (It’s a maybe here) Then lets look a bigger picture too. ( D.D. = Watch for earnings and use stops, etc . ).
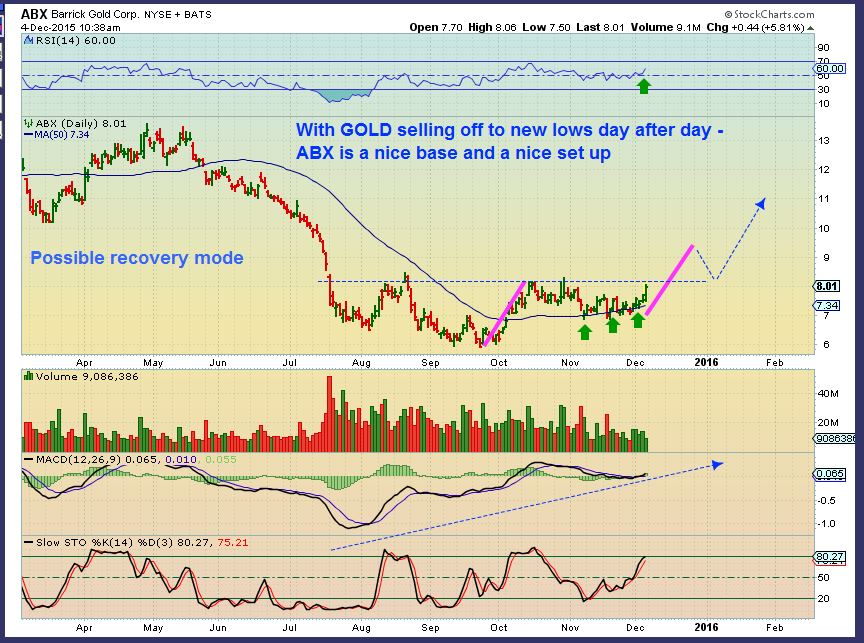
ABX – Already noted that this looks like it may be preparing to break out of a 5 month base.
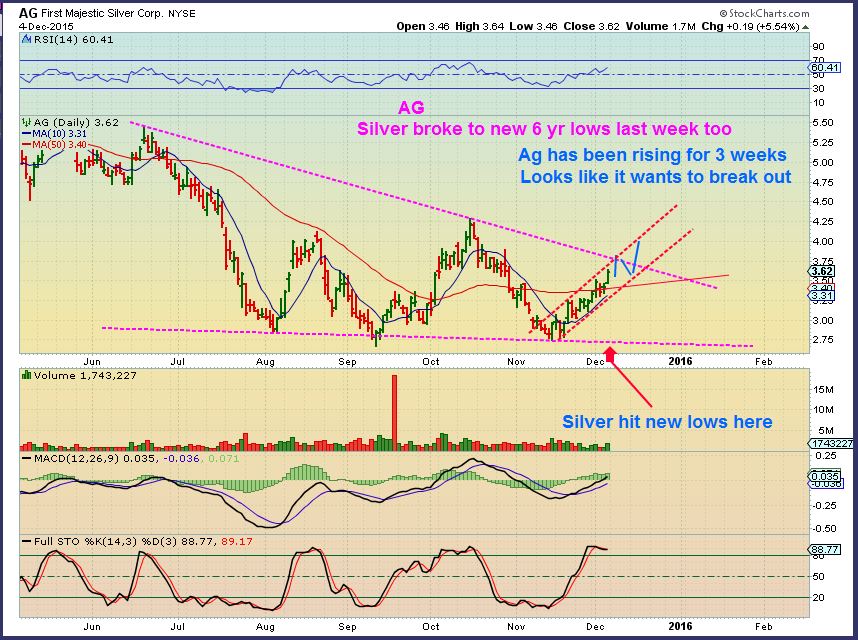
This AG chart shows the progress already made with the recent run higher, and a possible set up to run even higher. Notice the next chart …
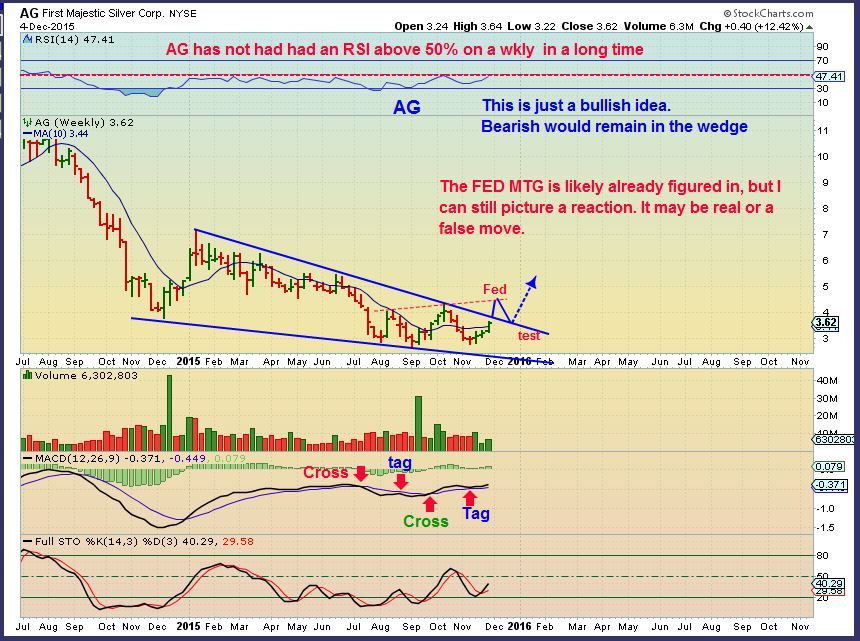
AG WKLY – This may be setting up a break out. That would be quite bullish over time.
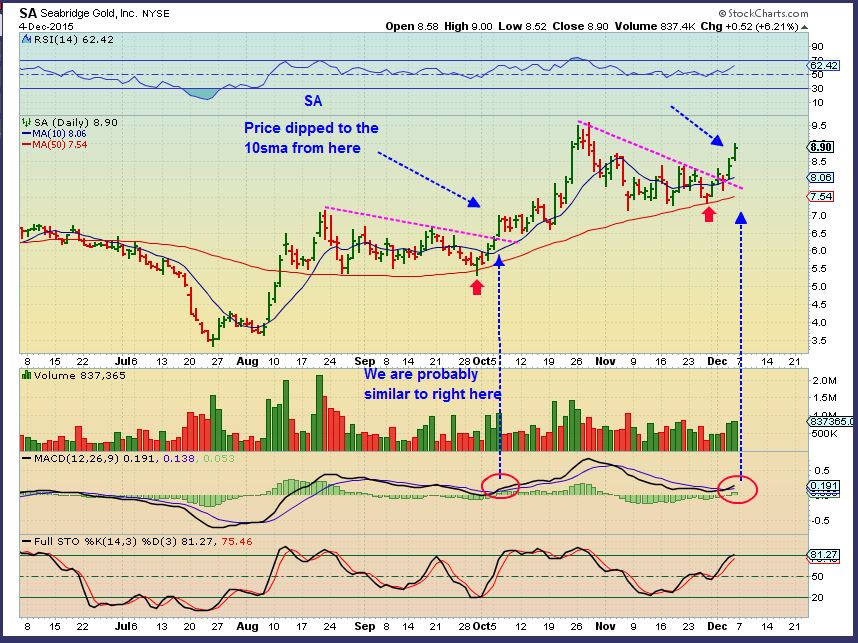
SA – Update : I have covered this since it was at $4. What a run, but I dont think it is done. Look at how similar this pattern looks. I recommended buying the 50sma, then the break from a down trend (magenta line). Now a dip or sideways move to the 10sma ( or 8 sma) offers a supportive entry.
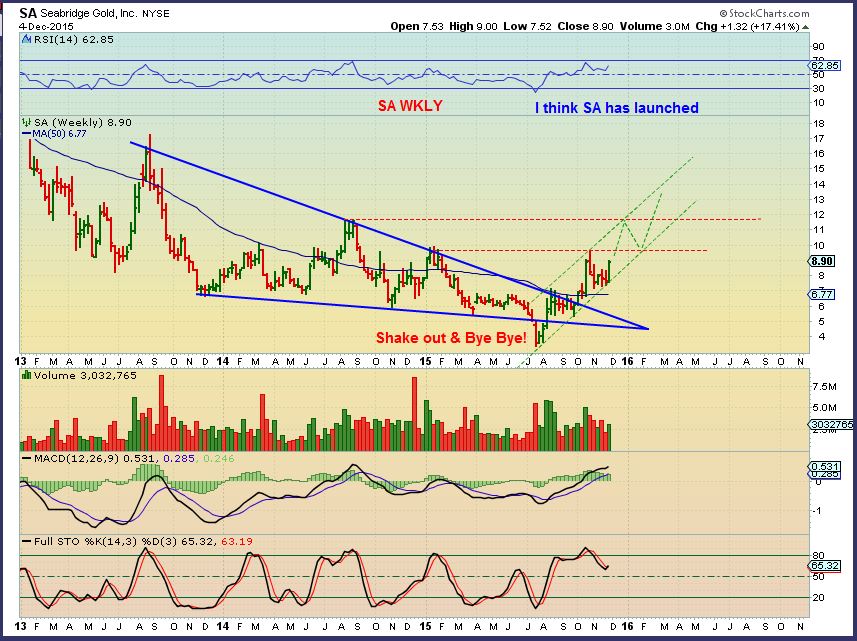
Again, this shows SA potential once Miners start uptrends.
CDE – One could correctly look at this and say that it hasn’t performed well, but it actually ran from $2.66 to $4.02. It may be forming a productive base with good potential. Cde looks to be breaking out. Buy a pullback or a break out that holds.
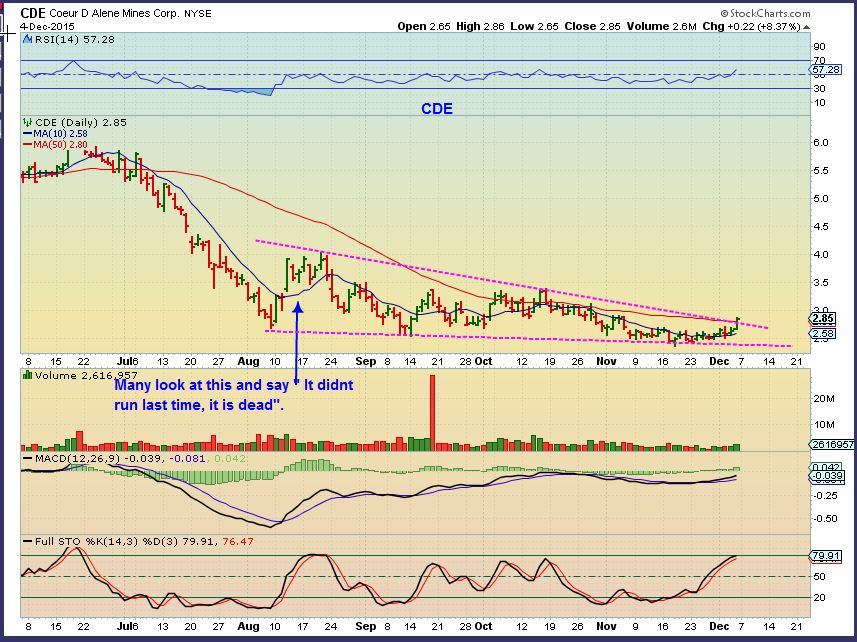
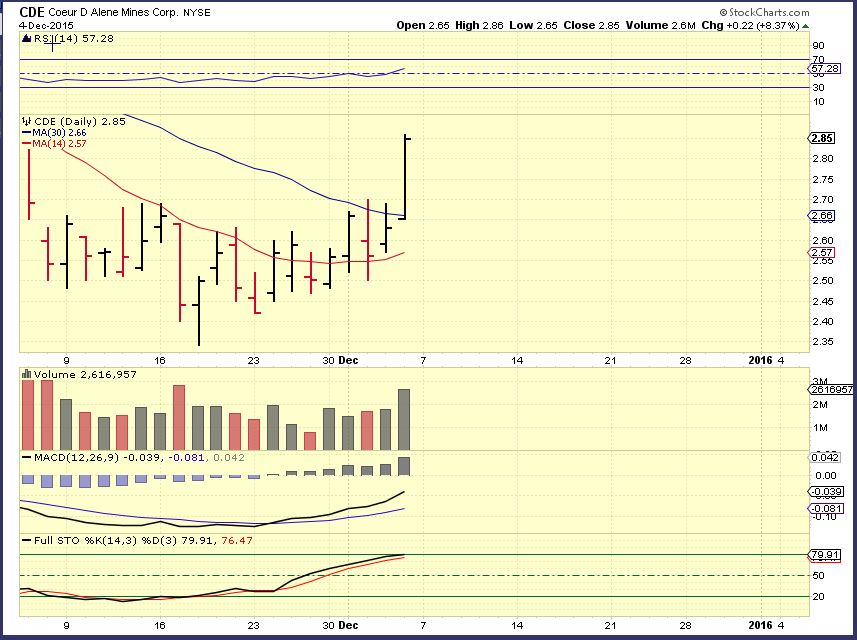
AS SILVER dropped to new lows, CDE did this. $2.35 to $2.86. This may pullback to $2.60 ( 10 & 20 sma not shown)
For the sake of time, I will just quickly run through a few more charts with potential.
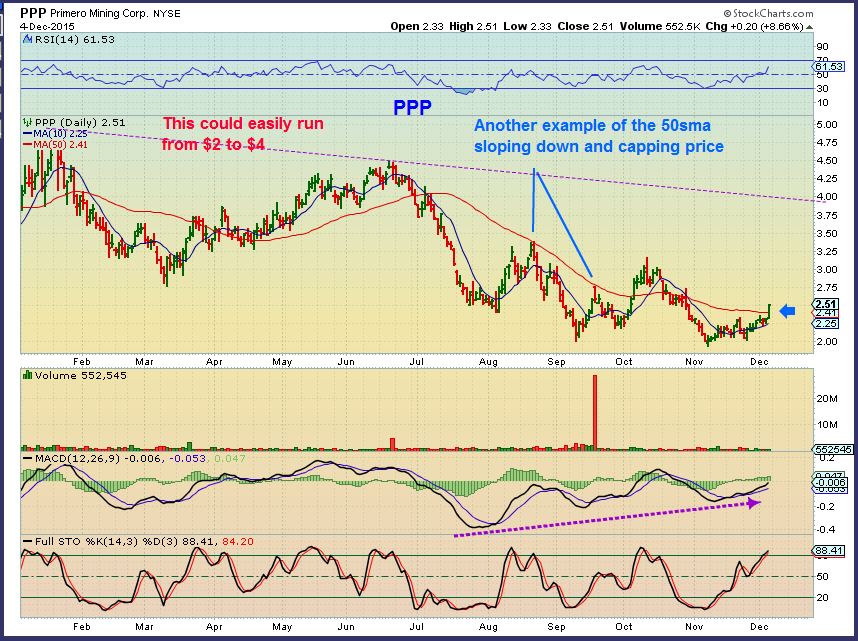
PPP – breaks above the 50sma after a consolidation. See if this holds on the pullback.
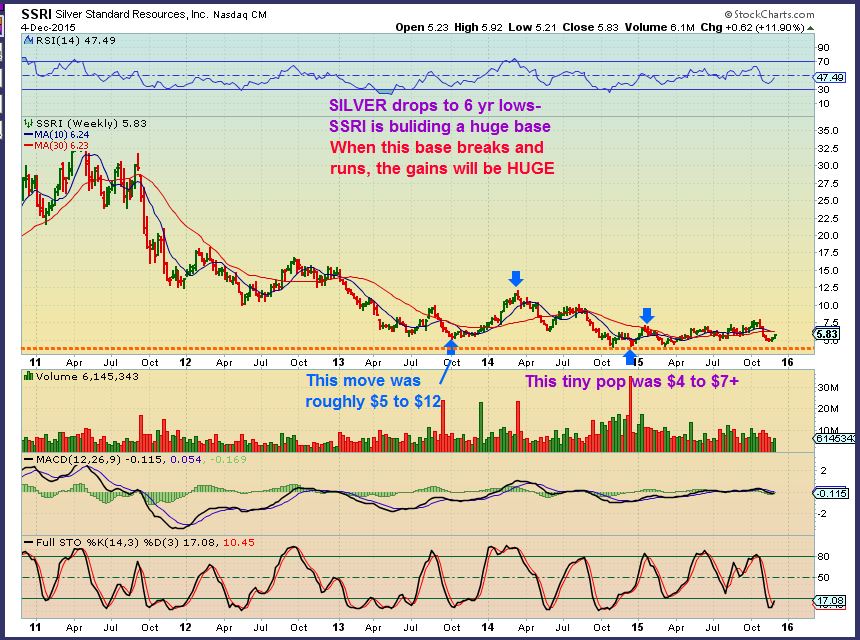
SSRI looks to have bottomed over a year ago. New lows on Silver last week and this was moving higher. Very good longer term potential.
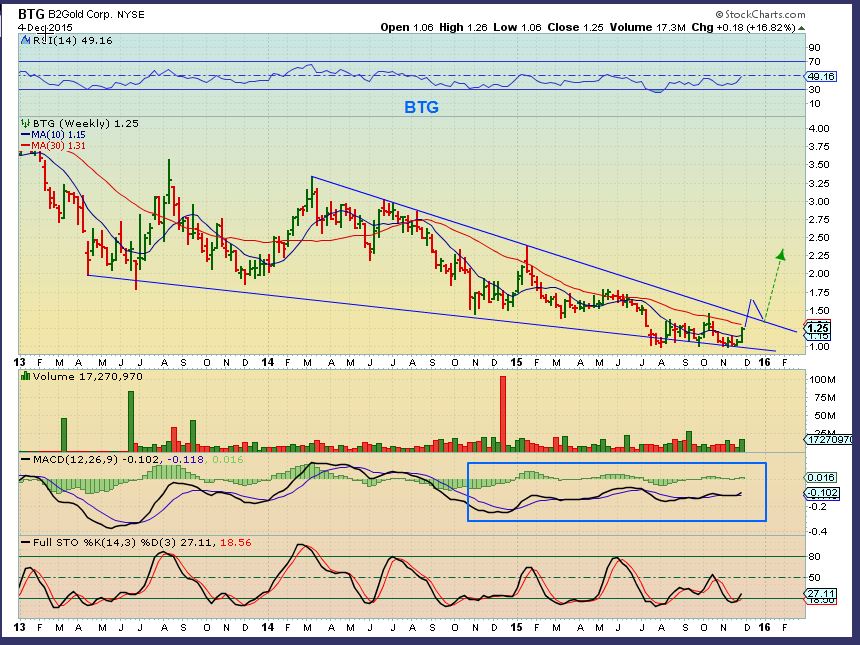
BTG WEEKLY- Lots of potential when this breaks out. It popped 16% last week with Gold at new lows.
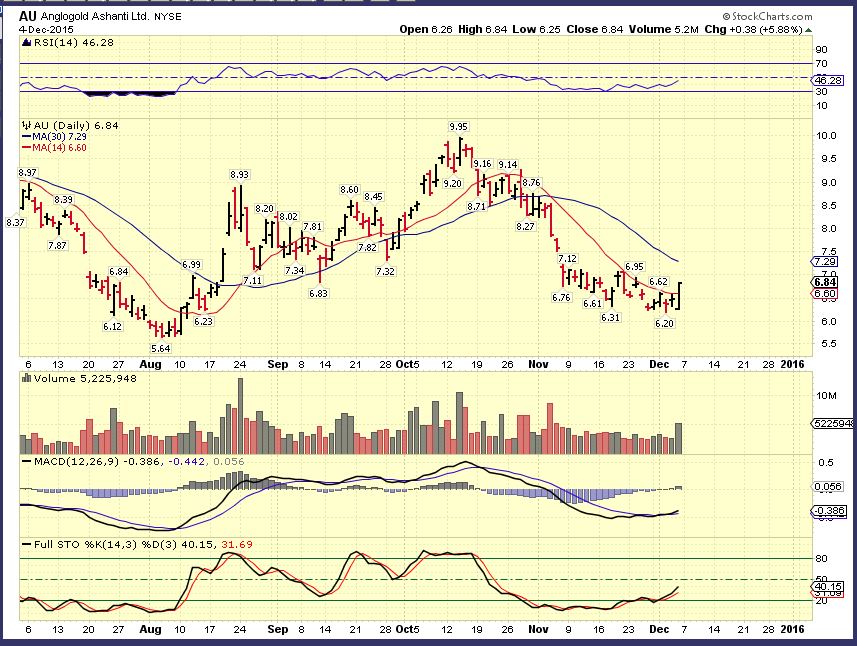
AU – I bought this on the summer run. It doesn’t look like it runs much, but it ran almost from $5.64 to $10. Over 80% from each low.
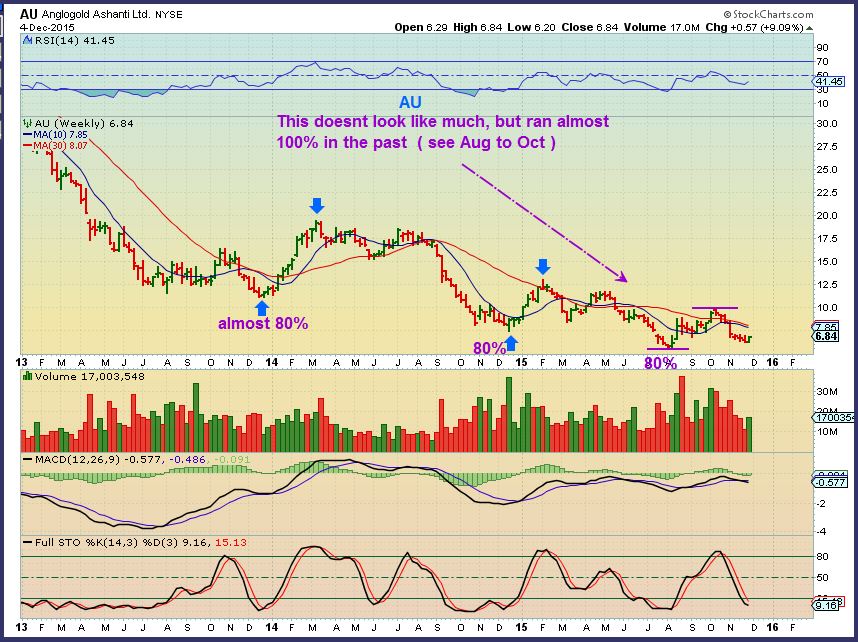
AU – Bullish engulfing & MACD cross Friday, this is a buy . The 50sma may hold on a pullback.
I need to move on here, so you get the idea. I have pointed out AUY, EGO, IAG, GG, NEM, PAAS, MVG, GOLD, and many more in the recent past . Look at their charts and either buy a pullback to the 10sma or 50sma, or even add a lagger ( over $1) if it starts to show signs of life.
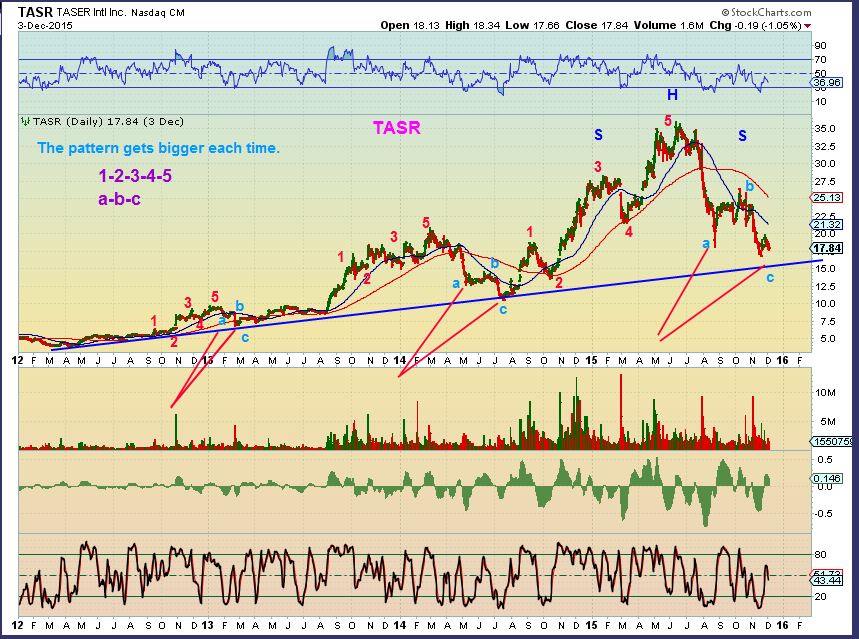
Other ideas. Look at this chart of TASR. Dropping to $16?? It just stood out as very repetitive, with wild swings. It may be approaching support nearing the next lows. Place it on a watch list if you are interested. Nice uptrend with WILD SONGS, this is not for the weak at heart in the 4-5, a-b-c area 🙂
 .
.
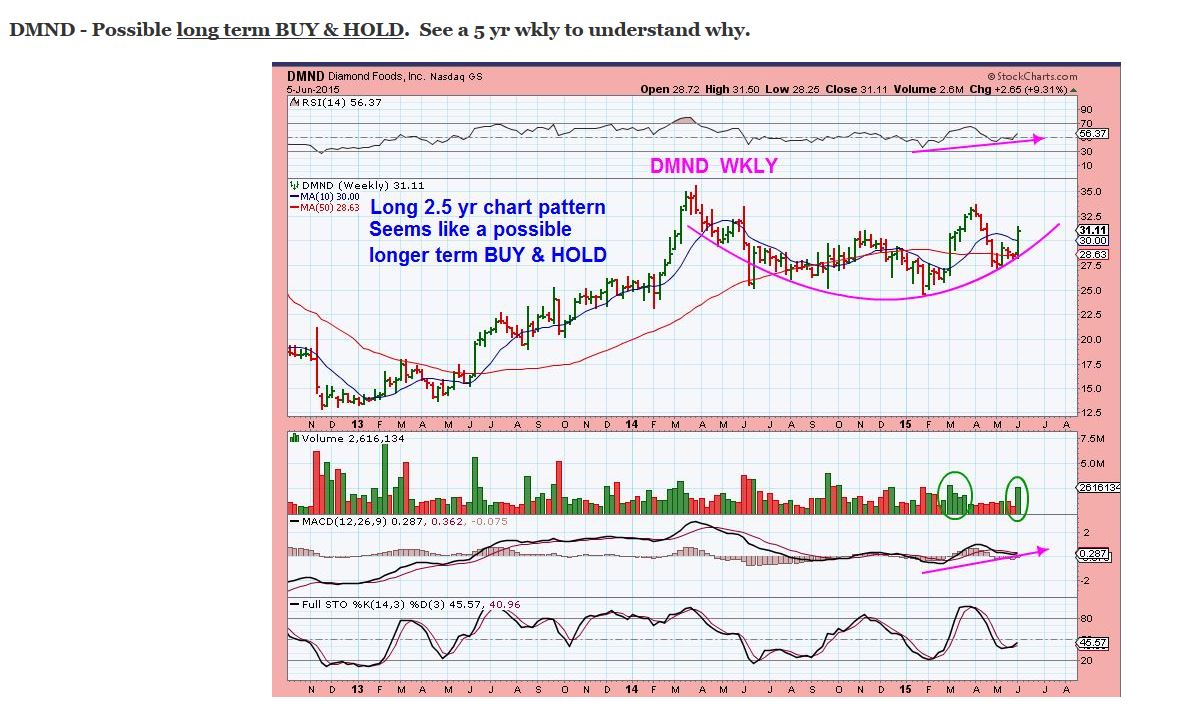
I mentioned DMND foods this summer and I was asked by a reader that bought it for an update, buy -sell- or hold?. They bought at $30…(congratulations ). My original post has been CUT/Pasted below…
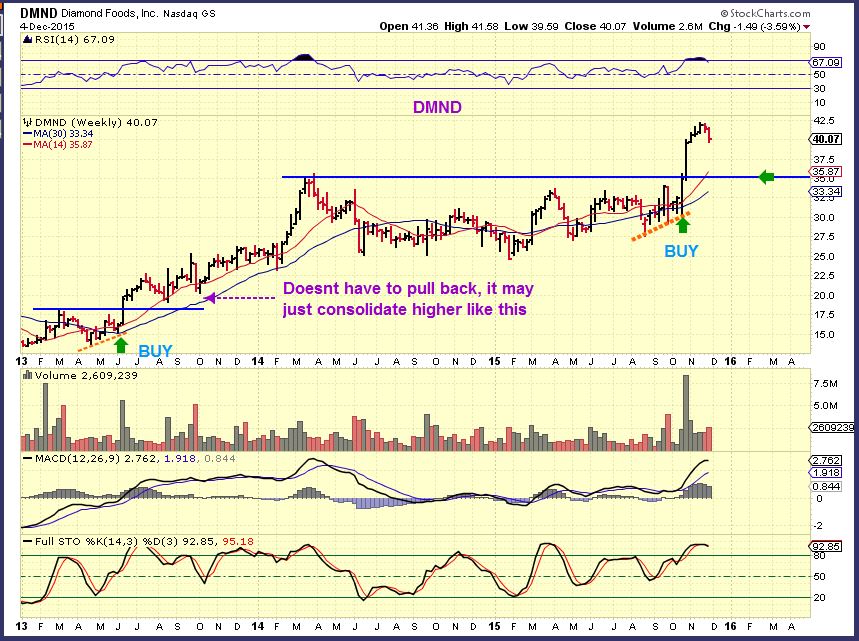
DMND now – yes it is extended, but that 5 yr wkly says that this could go to $100. A consolidation on a wkly chart could take months, could drop to $35, but it also may not. You must decide what your style is. Sell and add lower? Sell 1/2? Will consolidation bore you to tears? Was this a long term hold? I think this goes to $100 in the future.
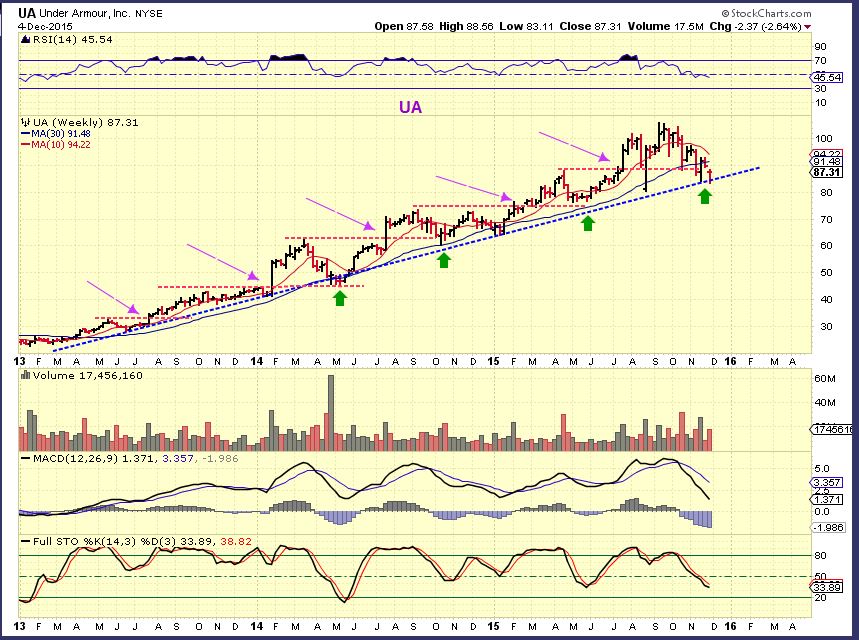
I also mentioned a yr ago ULTA, NKE, UA, PCLN, ( And of course GOOG, AAPL, NFLX, and the obvious longer term items) , as Long Term type BUY & HOLD.
Some people think that “LONG TERM BUY & HOLD ” is easy to just buy & hold. NOT TRUE. This yr NFLX went from $50 to $125 to $85 to $130. Big scary moves. Lets review a few.
UA WKLY– Great uptrend, also not easy to just “Buy & Hold”, but longer term pays off well. UA broke out again, and again, and again. This one is hard to hold too, unless yours is just a ‘buy & hold & look away’ style. The consolidation periods drop fast. It may be a buy here for the next couple of weeks though, with a reversal at support.
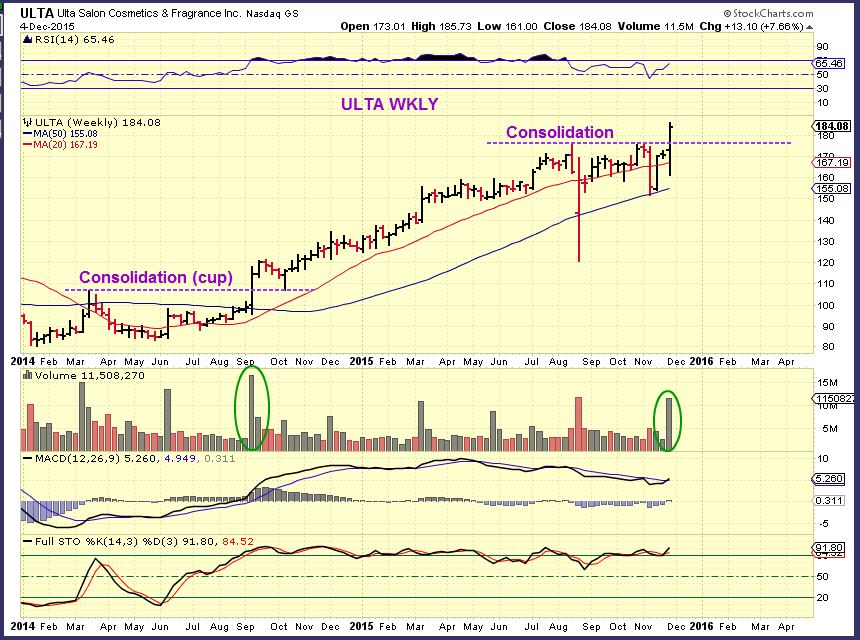
ULTA – Broke out again on a wkly. Buy a back test if it does one? This has been a consistent buy at the 20ma wkly chart. The problem is that it goes sideways for months and bores people to death. longer term it doubled from June 2014 to July 2015.
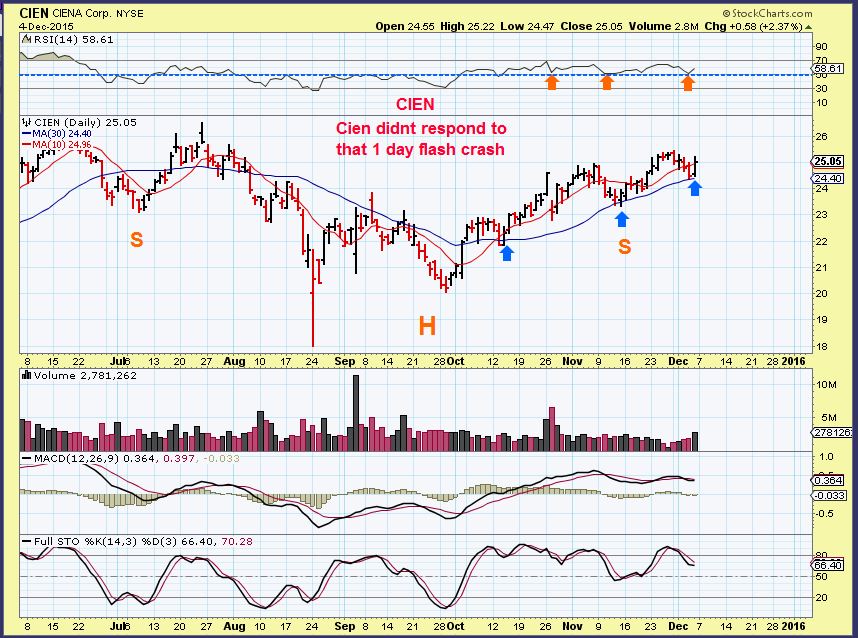
CIEN – Traders: Looks like a buy at support if you like Tech stocks.
FNSR – Long base, looks ready to break out soon.

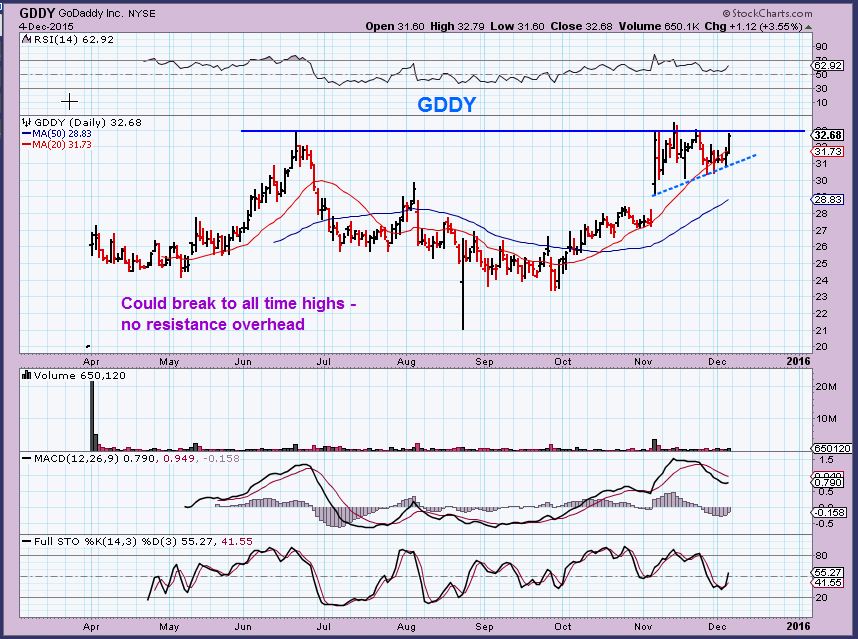
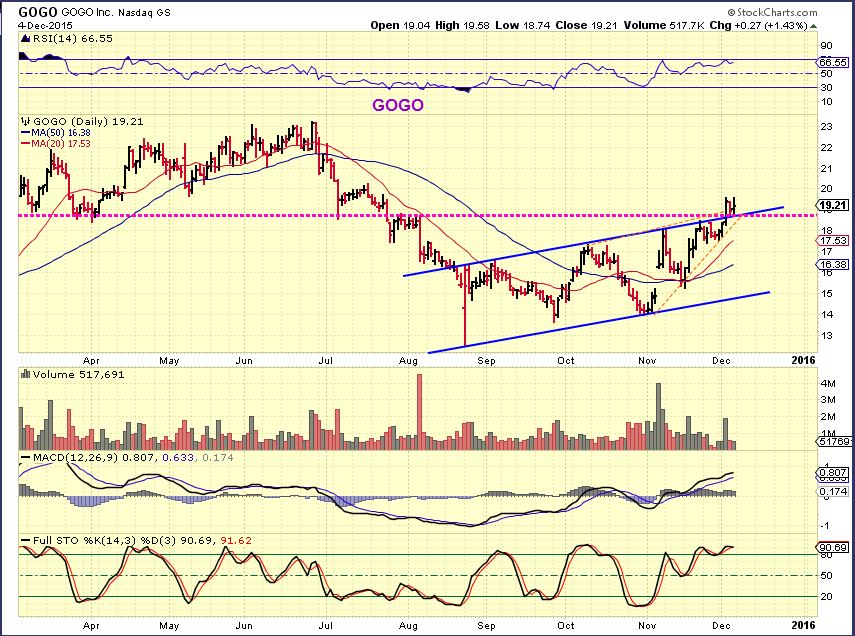
GDDY – I mentioned this and GOGO a few weeks ago. This looks pretty good for buying a break out.
Update on GOGO – I posted this, but it didn’t drop that much
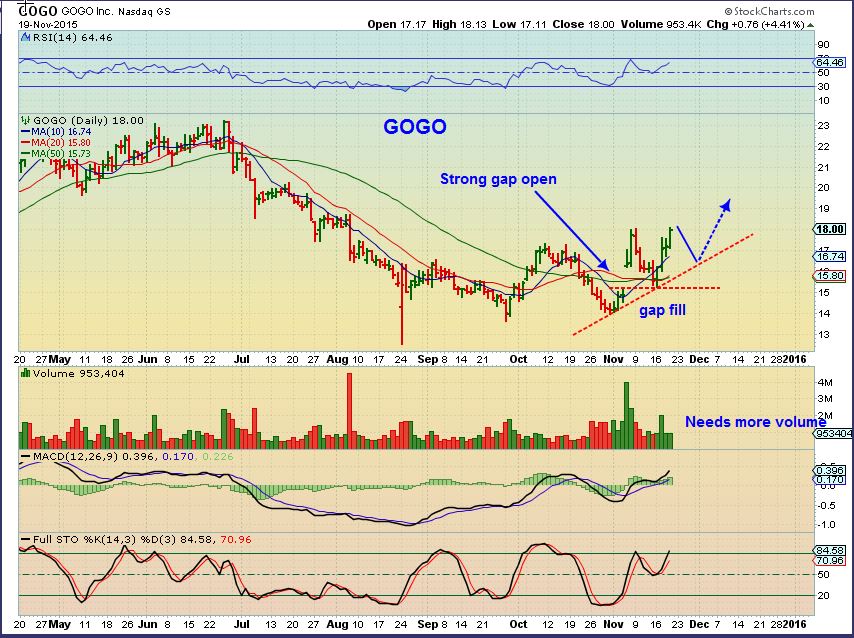
GOGO went sideways and broke higher. Its a buy here with a stop below the blue & Magenta line, but I actually do not like the light volume Friday, so if I bought it I would watch for stronger volume on the way up. If it remains light I would exit.
Note: I also mentioned the set up on NQ a week + ago, it had a nice looking set up . It failed on earnings. THAT is why we must do our own due diligence (D.D.) and know when earnings will be released on equities that we are interested in. Then we can decide to Buy – Hold on – or Sell – if we already own stocks for companies with pending earnings reports.
Those are just a few ideas for trades. I’ve discussed a lot in the last several reports, waiting for Gold & Silver finally to finally start their move. Oil has been bearish and the markets are up & down, consolidating a bit before their next directional move. Now with the weekend report and this update on what to look for in miners & a few Tech stocks, my report tonight will likely be quite short – just a quick review ( Unless something crazy happens). What else is there to say? We can now watch and see how things move as the Fed Wed Dec 16 approaches. : ) Enjoy your day and happy trading!
~ALEX


Oil crashing lower Bollinger band. This is a huge 2-day move here. Will likely take 1/2 puts off table here to lock profit and move stops up well above breakeven.
Alex, think this will at least pause at double bottom area? Do you see any pops as chance to short or be more cautious with extreme oversold conditions likely developing.
Likely to take 1/2 position in GLD and miners this AM. Thanks for extra charts!
Forced liquidation in crude?
If Euro, which has been -0.6X% down today, closes just down or flat or even up, having bounced at…1.08, this could be hugely bullish Euro, bearish US$ and bullish comms.
On verra.
“Don’t forget to send #PresidentObama a thank-you note for today’s rally in RGR”
~Chris Temple
SA long from this morning weakness. Great work Alex.
Did we get suckered in again? I sure hope not.
Hey Carl,
What are you referring too…Miners?
If so, pull up GDX with a 9 sma and you’ll see a gap fill so far , volume is not too bad.
Also Take a look at Nov 20, kind of looks the same as now.
GLD & SLV have light volume on this drop.
So far, it’s a rough day, but not breaking anything.
Yes – miners. More of a drop than I would like to see at this point. Nothing broken yet but a bit surprised.
Refresh (gap fill?)
.
Thanks for these comments & chart, Alex.
Yesterday, just before the close of markets, I increased my GDX with trembling
At 14.20, it was just above the 8day MA and just above the bottom trend-line of the new up-parallel-channel
I figured if I couldn’t add there, I didn’t believe in the longer-term thesis
AND it gave a tight stop-loss of 13.80 in case we have some more of what is hopefully hammering out a bottom
So, which move was fake, Fri or today? I thought it didn’t make sense once Jobs report confirmed the upcoming rate hike. Media says short covering and gold ready for hike. Then today, since we are getting a rate hike, gold is down. Wait? Different directions, but same reason? Hmmm….1 of them is wrong…
I don’t think so, It’s hard to catch tops and bottoms and trying to trade the wiggles can leave you behind. See the chart attached. Notice we should see the bottom tomorrow (gold candle) then move higher. The pattern is still holding up.
Thanks Bill. Volume is light too. Hopefully we’ll get our move soon.
SPY analysis with Eliott waves. Let me know if this makes sense. If wave 3 goes 61.8% of wave 1 (which seemed much stronger coming out of the August lows), that would target roughly 216.7 on SPY, or just about 2170 on S&P cash. Notice today’s down day only half of the volume of Friday.