
Digging Deeper
This is one of those weekend reports were there was a need to dip deeper and investigate several areas of the markets. Why? In the last report you may recall that I discussed how the recent trading reminded me of riding the White Water Rapids. For example the SPX was up about 75 points for 3 days heading into the Fed Mtg, and then it dropped down about 70 points for the next 2 days. Gold rallied with the Fed Wednesday , sold off Thursday, and rebounded Friday. Is there a waterfall ahead, or will this river smooth out? Lets dig in for clues as to what may lie ahead.
.
SPX – I posted this wkly chart to show ‘weakness’ in the indicators that I was using. This would indicate that more downside was likely.
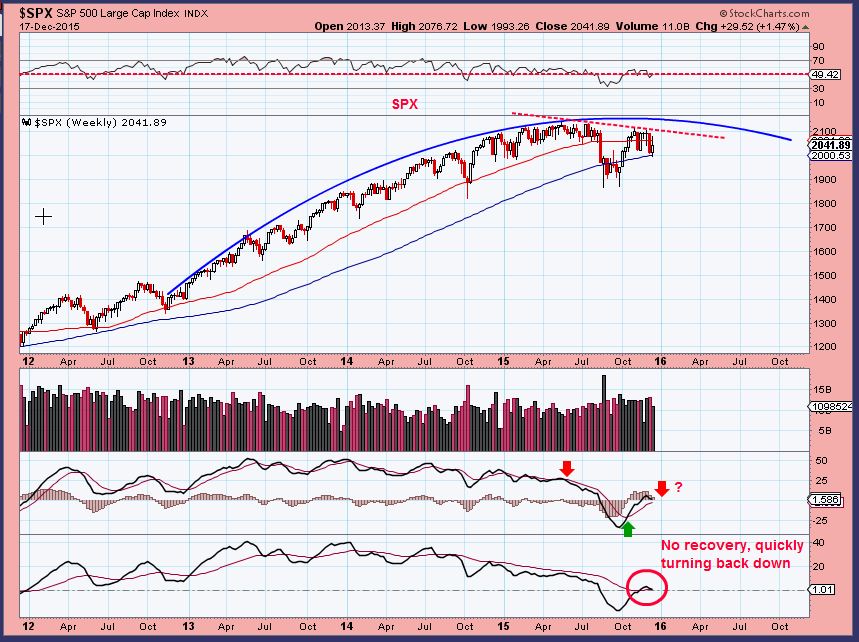
Take a good look at this chart of the SPX. Later in this report I will explain why it is important…
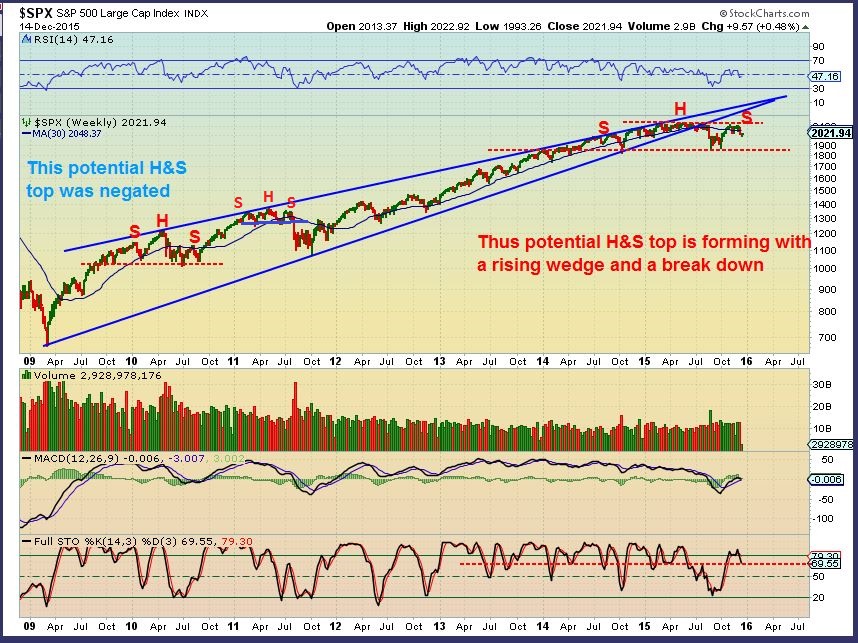
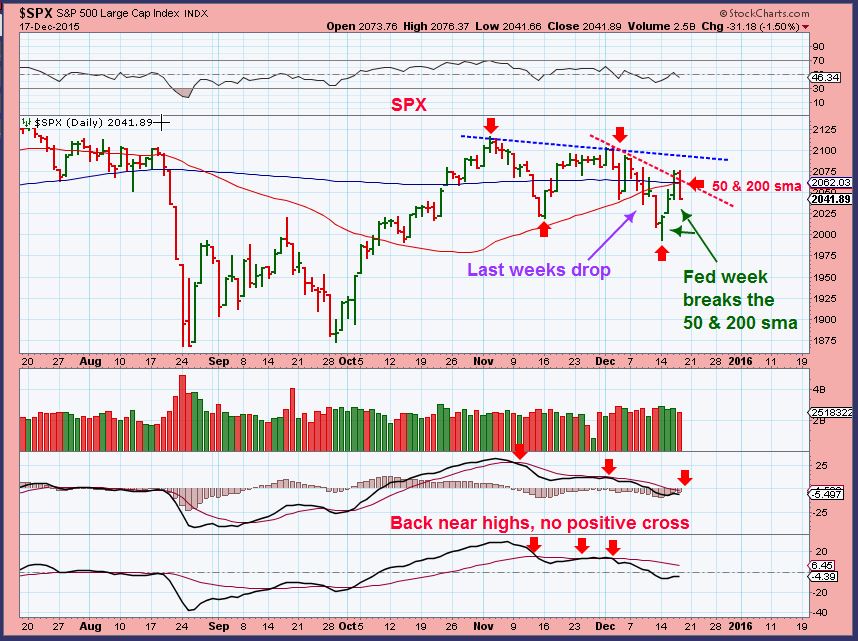
Dec 14 – I noticed that we have a potential H&S forming. I wanted to point out that they can be negated with a break higher ( left side of the chart). However…
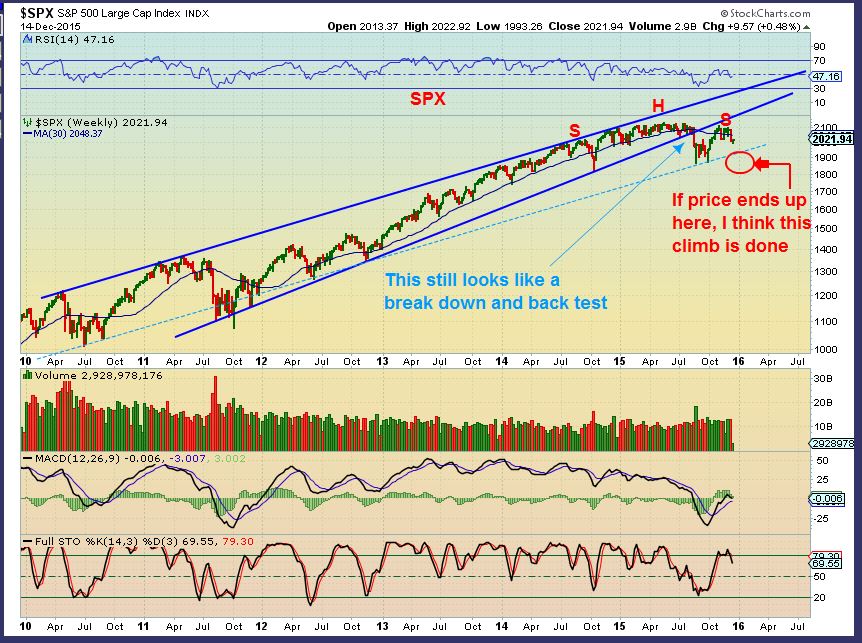
I also drew this on Dec 14 – We find ourselves currently at a wedge break down and back test. The light blue dotted line would offer a channel – so a break below that area would be dangerous.
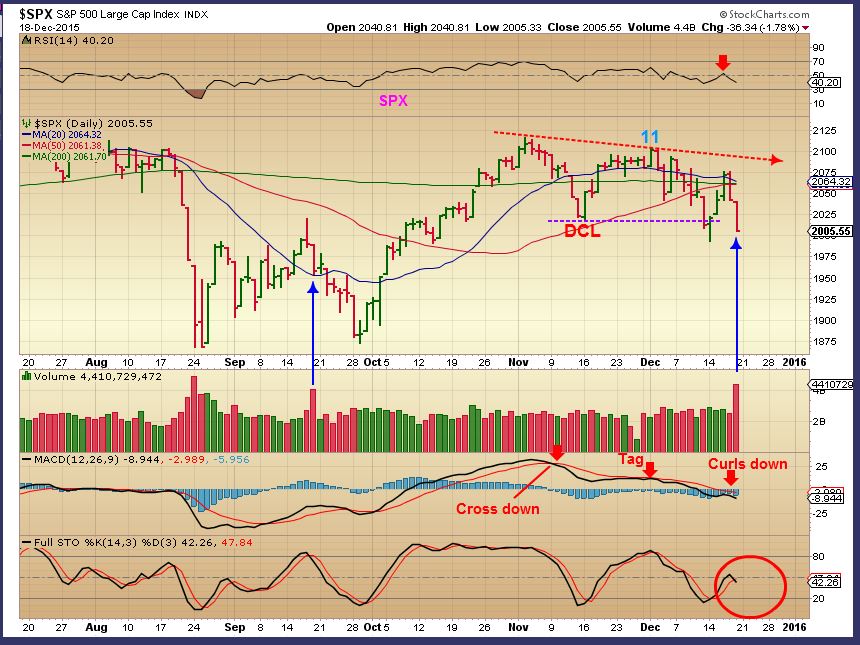
SPX WKLY – Currently price is losing support that held in the uptrend. A sign of weakness in recent weeks, and there is plenty of downside room on that stochastics. At the end of this report I have additional info on the SPX.
My SPX chart on Fridays report. Failing and weak.
Friday showed follow through to the downside. Due to the cycle count, this could play out as a drop or stairway lower for the next couple of weeks.
.
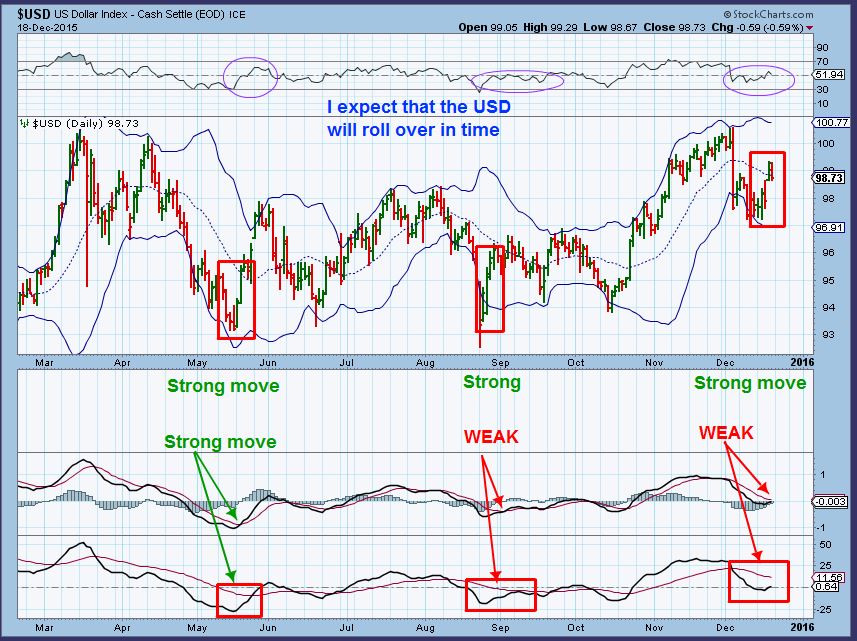
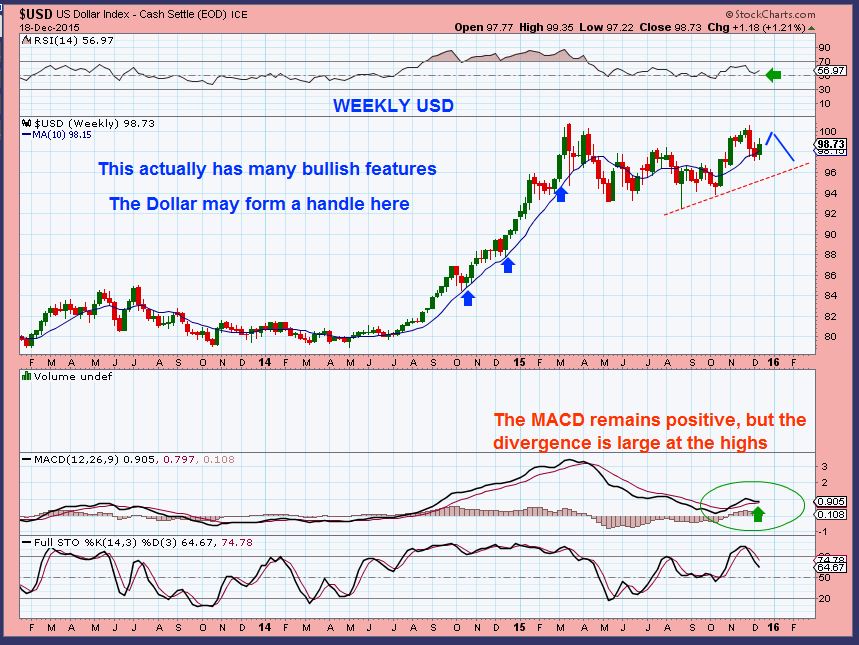
USD – The weekly chart is bullish, but my daily chart indicates that even though we had a strong surge higher, it is going to pause or drop soon. We’ll see, but this would be positive for Precious Metals.
So I would say that the Weekly Bullish chart may form a handle?
WTIC – Oil has been weak and I have avoided trading it. It was rejected at the 20sma when it attempted to rally. I have a $26 target on a weekly basis, so until I see a real sign of strength, I am assuming that this target could be met. A break above that 20sma would have me taking a closer look. A run to and then a break down at the 20sma may have me going short.
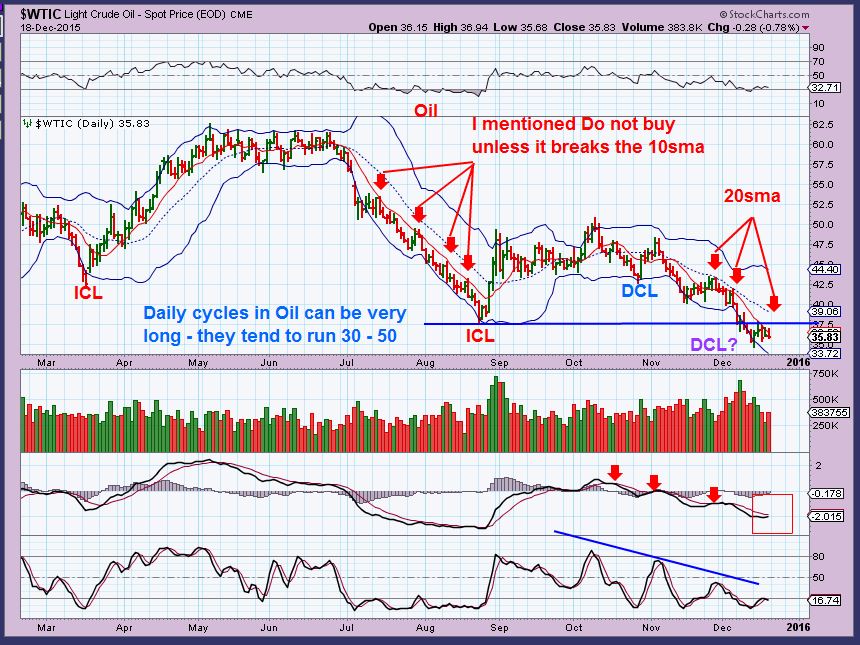
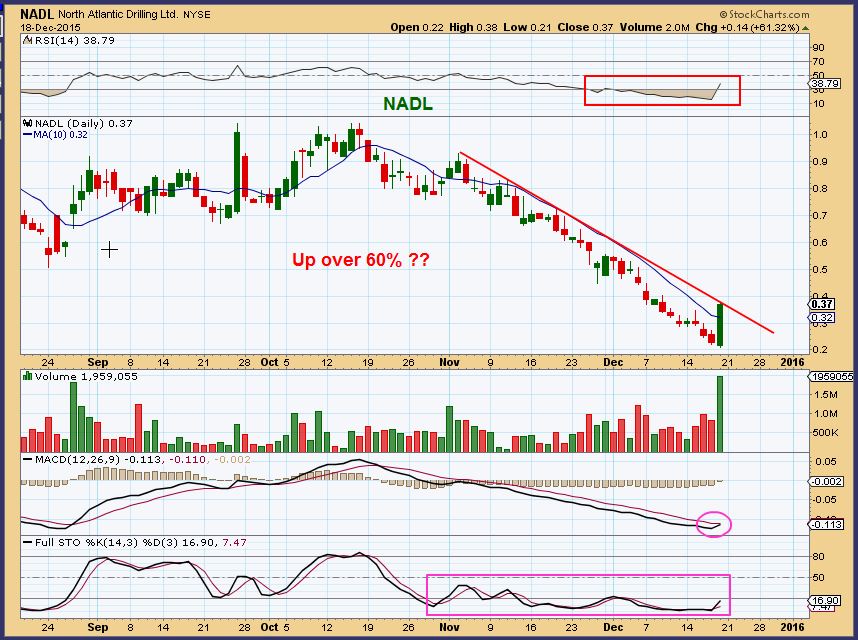
Oil could be ready to put in a temporary low, which I am assuming will be another weak attempt to rally. The XLE remains ugly, but Friday had some interesting reversals in many oil stocks. See REXX, DYN, ERF, AREX, UPL, NADL, etc. Others like CJES and SGY ( former favorites of mine) remained in the red.
NADL – I didnt see any news on this. Short covering? Oversold ? Up 60%.
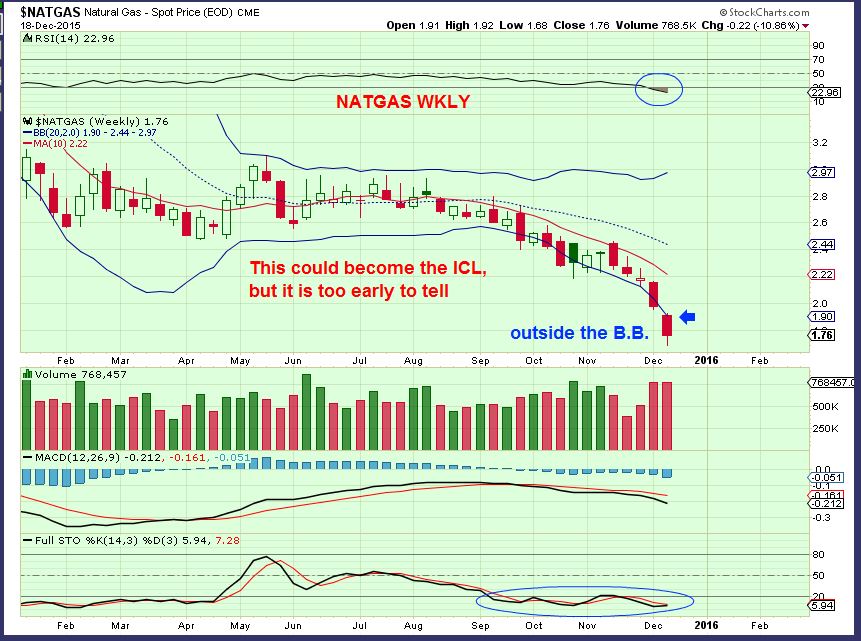
NATGAS WKLY– This was also getting beaten down ruthlessly and I ignored it most of the way down ( I should have shorted it in hindsight) . NOW I think that it is the timing to reach a meaningful low. This chart could be considered a buy, since it is a reversal candle outside of the B.B. on a wkly basis, it should pop. We’ll look at the daily too.
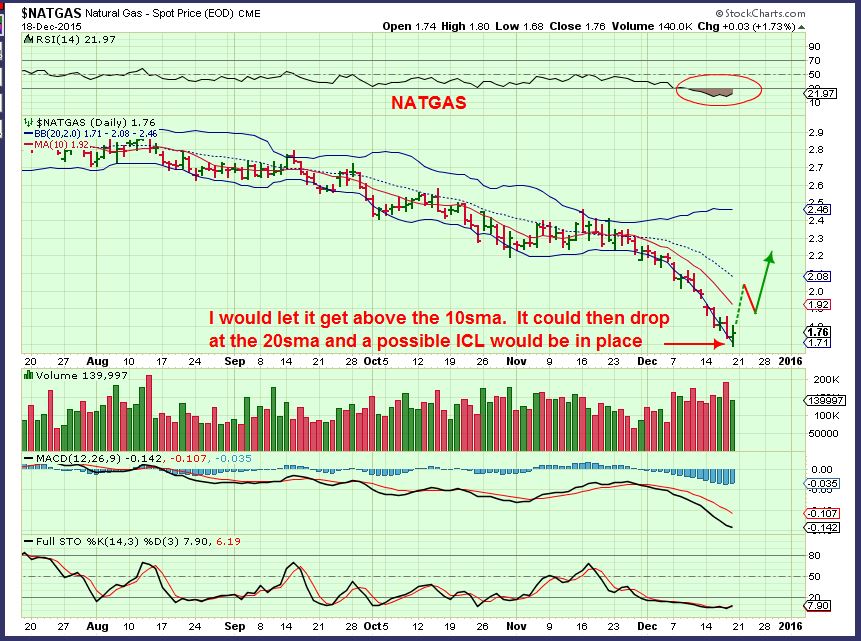
NATGAS daily – I am not personally taking this trade yet, but it may break upward above that 10sma and begin a move higher. NATGAS is extremely oversold and due for a meaningful low. With further proof, I may take this trade.
GOLD, SILVER, & MINERS
.
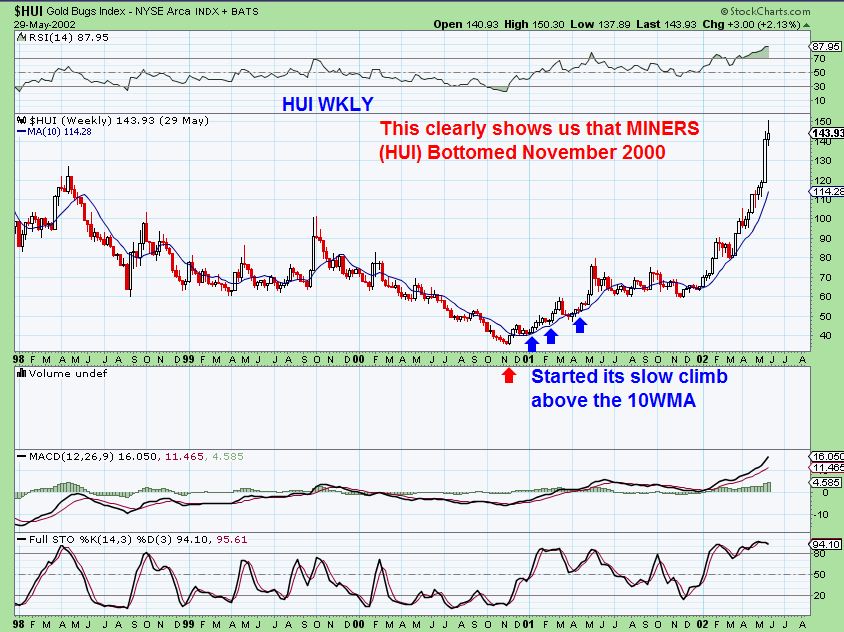
First this reminder : I have shown these next 2 charts in the past , but decided to repeat it as a reminder. MINERS BOTTOMED BEFORE GOLD & SILVER at the 2000 lows.
HUI BOTTOMED NOVEMBER 2000
GOLD BOTTOMED IN SPRING OF 2001
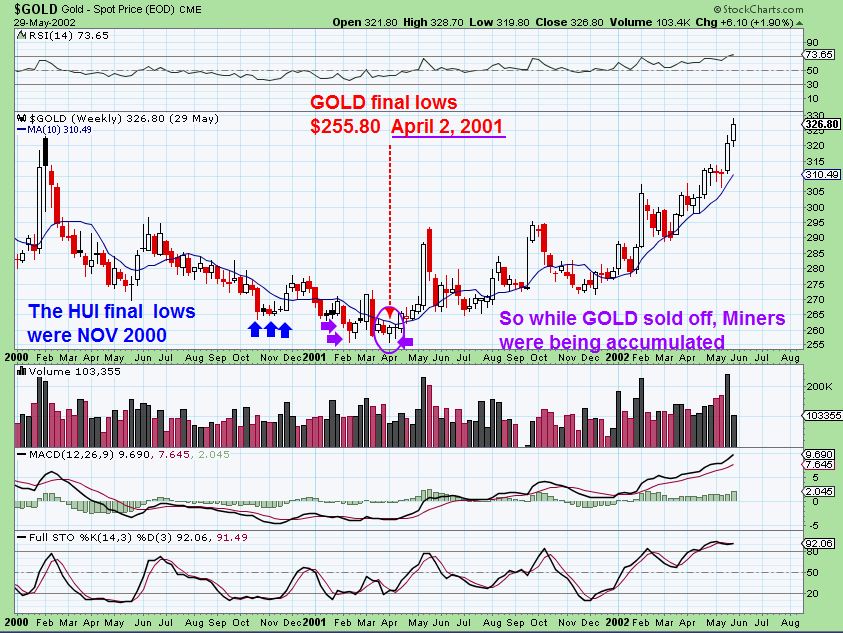
With the above reminder, I feel that Miners are currently acting as though they may be bottoming. They were holding higher lows as GOLD & SILVER Sold off recently. Time will tell if this is the case.
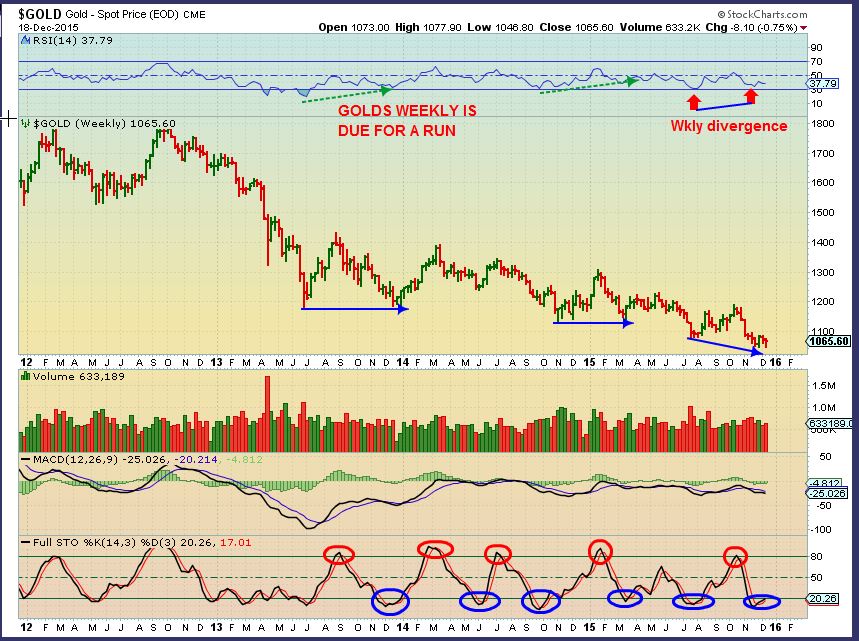
GOLD WEEKLY – The C.O.T. is very Bullish and the weekly chart looks like it wants to rally soon. Lets be ready for that, though I may wait for confirmation before reporting a confident buy. ( Reminder: Miners bottomed before Gold in 200-2001). The Gold COT is Bullish. Miners have higher lows.
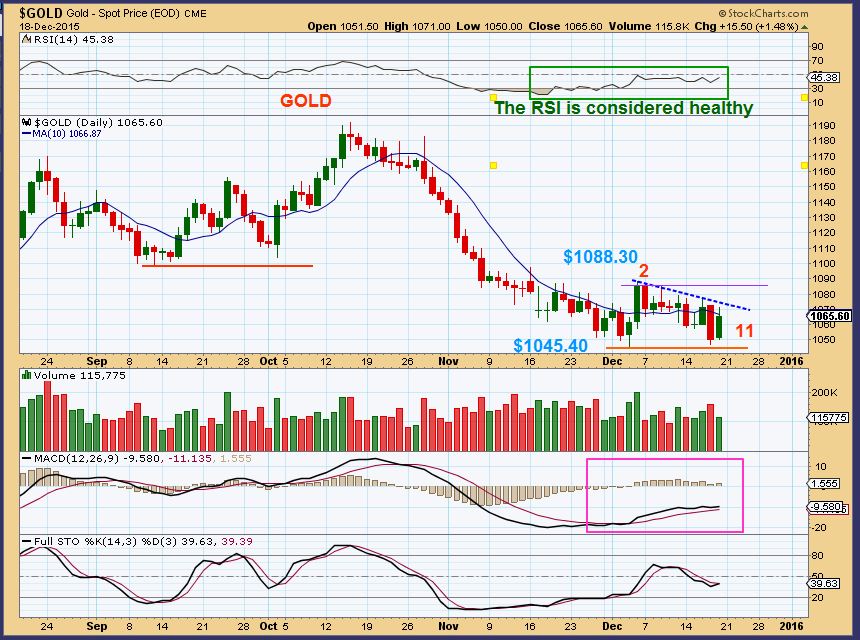
GOLD DAILY – There are healthy signs in this chart, but cycle -wise we wouldn’t want to see it tale out the recent lows. If it did, this may be a final daily cycle for Gold that could drop into the end of the year ( Again, have Miners bottomed and would ignore this drop too?). A break above the 10sma and the $1088.30 is bullish to me. A new ICL likely. A break ( And close ) above the blue dotted trend line is bullish enough for me to go long. With the recent COT levels, this might rally strongly from here if it breaks higher. The RSI is strong for double bottom lows.
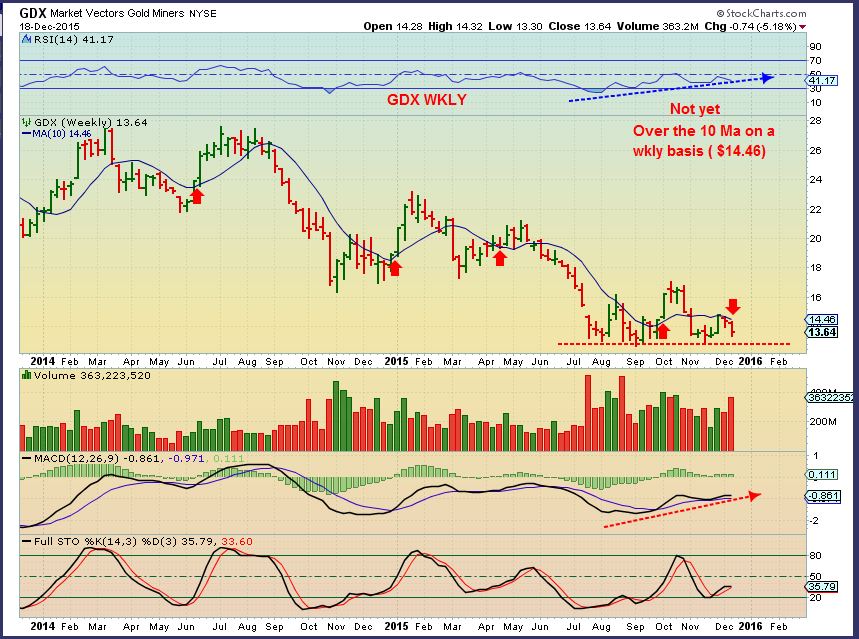
GDX WKLY– The weekly chart is mixed, but the reason for that may be that GDX is further along in its daily cycle. The MACD and RSI show positive divergence. A close above the $14.46 would be good for this weekly chart. Lets not break below Sept 11 lows. Lets see the daily chart…
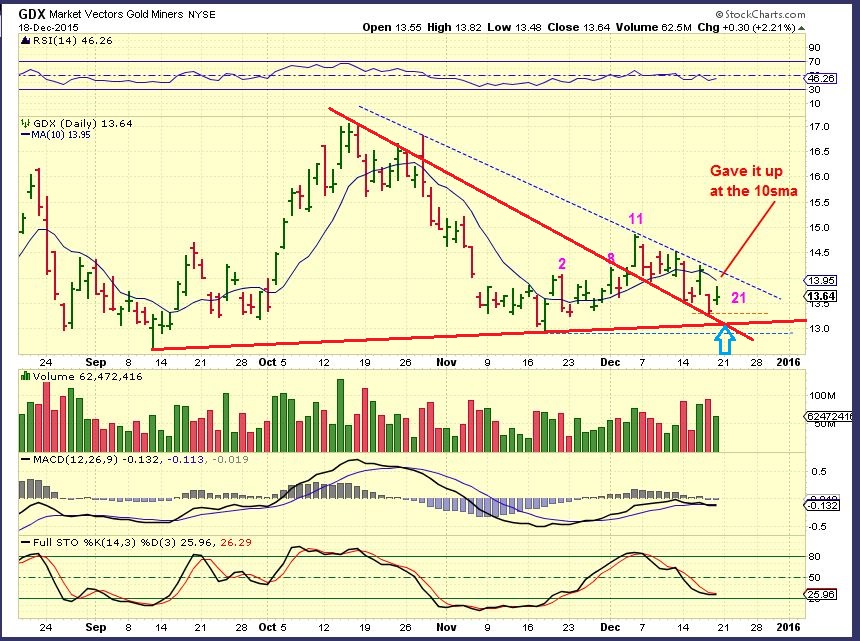
GDX DAILY – With a day 11 high, a daily cycle low Thursday would give us a day 20 low and a L.T. daily cycle. A drop to the blue arrow on Monday would give us a day 22 possible low. Also bullish if you ask me. We want to see GDX overtake the 10sma to confirm a Daily Cycle Low and a trend line break.
Conclusion – We need a little more time to see whether GOLD will hold these lows and whether Miners will hold above their Sept 11 lows (Bullish). If not we will have to discuss the possibilities going forward. I have done some additional research in this area, and will present it in future reports when it is applicable. My overall view? Bullish Precious Metals. I think we will be rallying in the early part of 2016 and it may be starting now. I think OIL could have another daily cycle down, and my target of $26 may be reached in future weeks, so I am staying away from Energy unless I see a real sign of strength , or bounce and final break down (Possible Short) . Eventually Oil stocks may bottom before Oil, similar to some Miners before Gold & Silver. NATGAS might be nearing its final lows. It is very oversold, even on the weekly chart, breaking below the B.Band. It has been a bloodbath day after day, so it is risky, but I know that traders may want to buy with a tight stop – that is your call.
I also said that I dug deeper in other areas, and I want to share what I’m seeing in the equity markets. I will use the SPX as my subject.
.
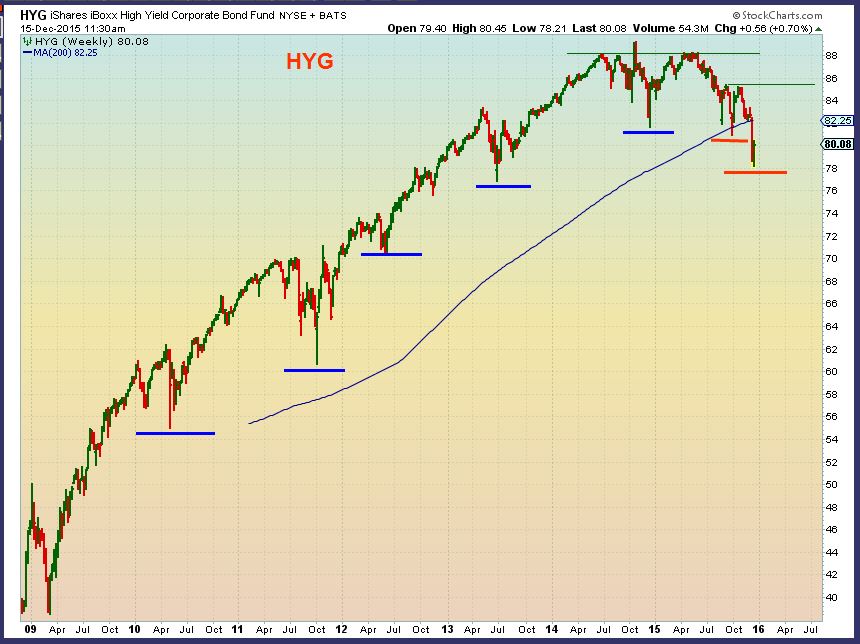
I want to show you what is happening in High Yield Bonds. They have put in some very bullish runs over the past 6 years, but this year we see a change.
HYG – Notice the Higher lows year after year until 2015. A break down without recovery .
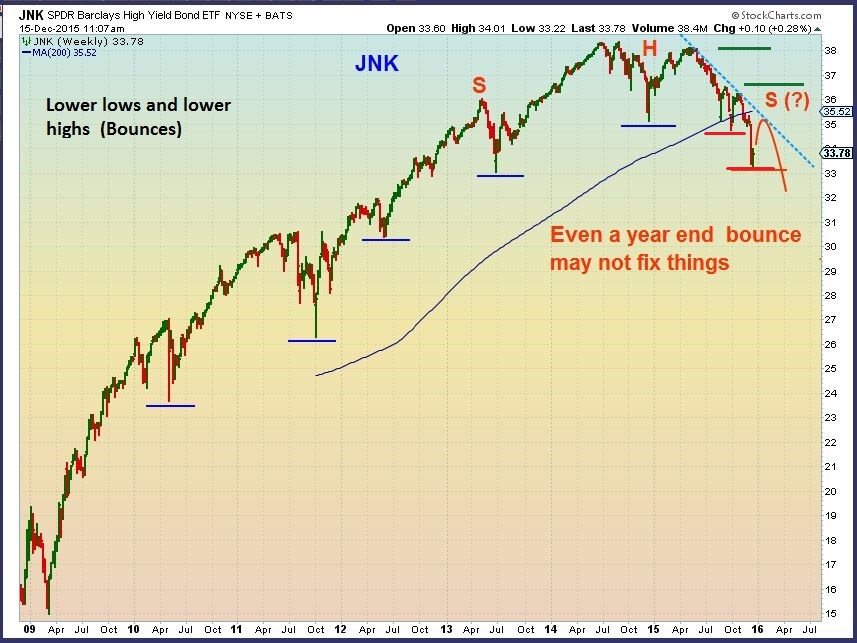
JNK – Higher lows, until 2015. A break down.
HIO –
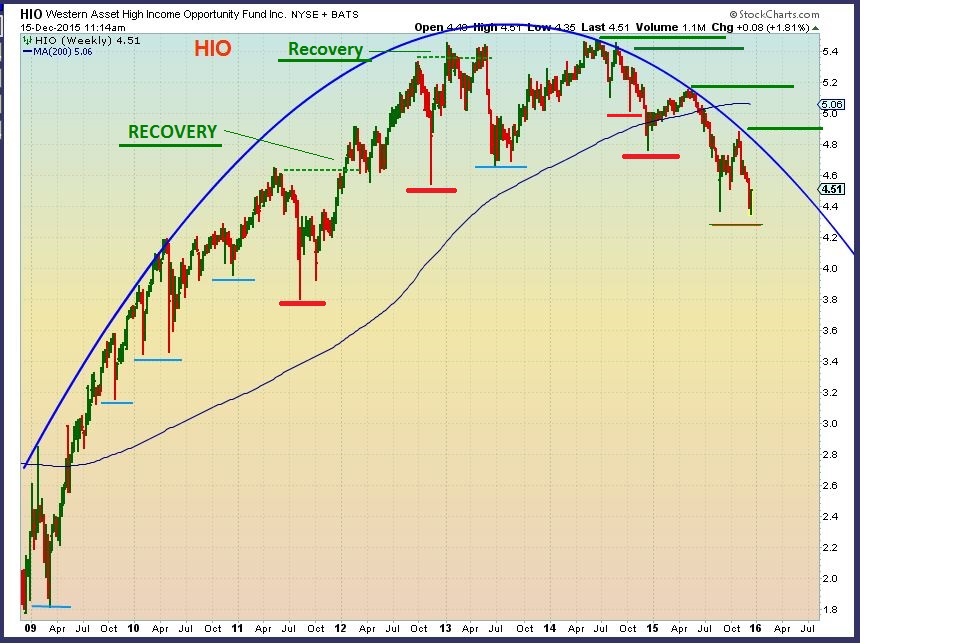
High yield Bonds are not only rolling over, but massive outflows are occurring and some funds are shutting down.
Below is a quote & a clickable link to an article that discusses High Yield Bonds.
.
What to do if you own High Yield Bonds
The above article states , “Investors are getting antsy. After pouring nearly $10 billion into high-yield bond funds and ETFs in October and the first week in November, they have since pulled out nearly $7 billion, according to Thomson Reuters Lipper.
One of the biggest high-yield bond ETFs, SPDR Barclays High-Yield Bond JNK, -0.39% saw investor outflows of over $1 billion in just the five trading days ended Dec. 10, according to ETF.com. Zacks Investment Research reported that the $10.7 billion ETF has lost 10.6% so far this year.”
.
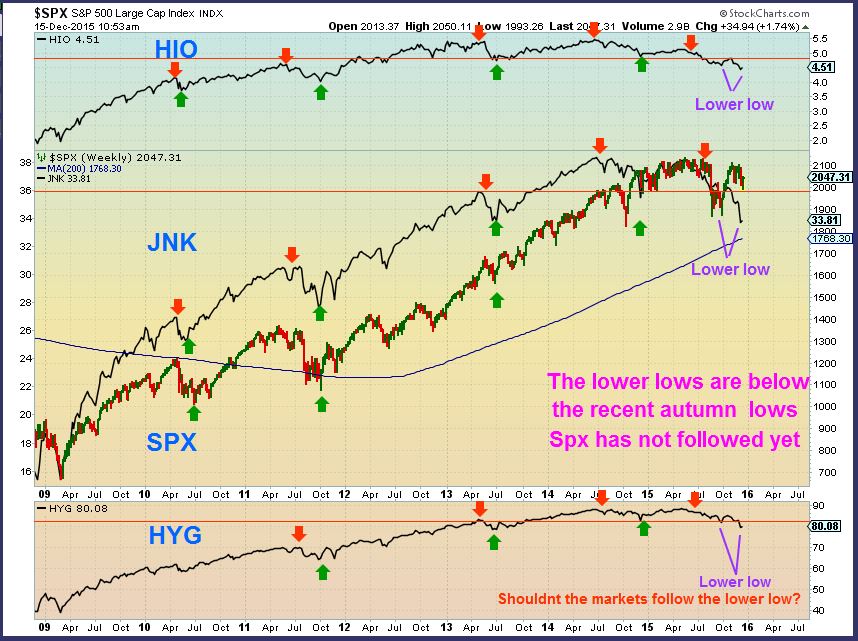
When you do a little research you can see how the junk bond market is related to the stock market, and has moved step by step with the SPX. Let me quickly show you a chart that shows that movement. Notice the red arrow highs and Green arrow lows are almost step by step matching up – EXCEPT RIGHT now in the SPX. These Funds made lower lows below their AUGUST lows recently and are falling apart. To me, this could be indicating that SPX will play catch up. NOTICE THAT HIO, JNK, HYG Broke August lows.
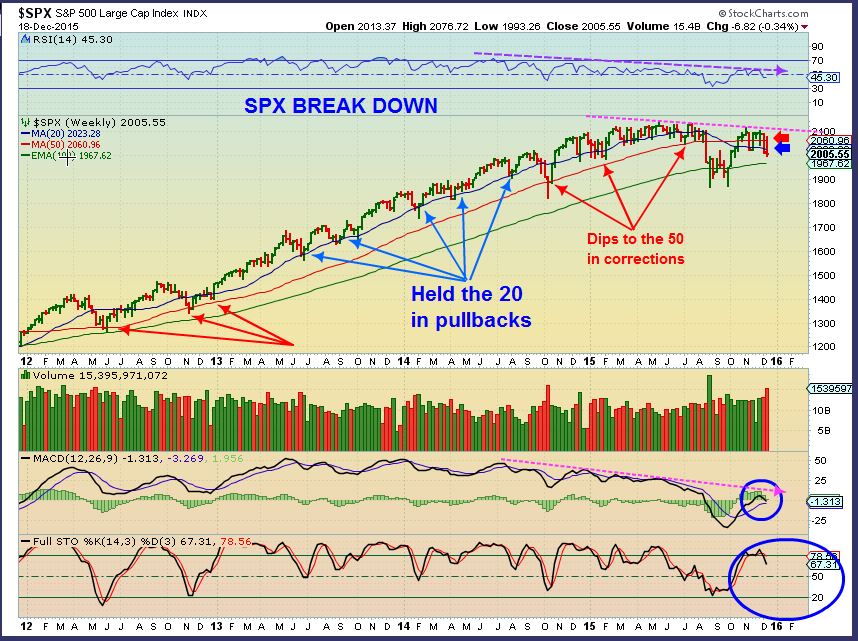
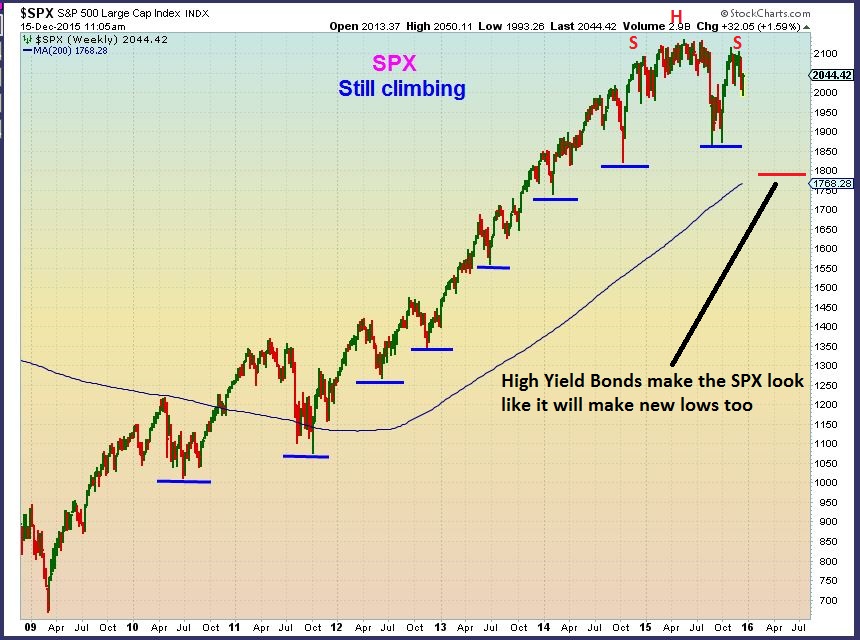
SPX – So if it plays catch up with High Yield Bonds, you should see AUG lows broken by the SPX to get the matching lower lows. As I mentioned , our daily cycle failed. We have possibly 2 more weeks of downside. This chart and research that I was putting together was done on Dec 15 for this weekend report. The SPX is now at 2005 and sold off for 2 days after the FED interest rate hike. Was that interest rate hike the game changer? Will the SPX sell off to new lows , catching up to what the smarter JNK BOND investors already did “ In just 5 trading days leading up to Dec 10th”, according to the link above ?
I dont short Bull markets, but this may be the end of the ‘bull market’ for a little while, as a larger correction takes place. If you are one that does go short, you can use the above information to monitor your trade potential. How big of a correction can we get and still remain longer term Bullish?
.
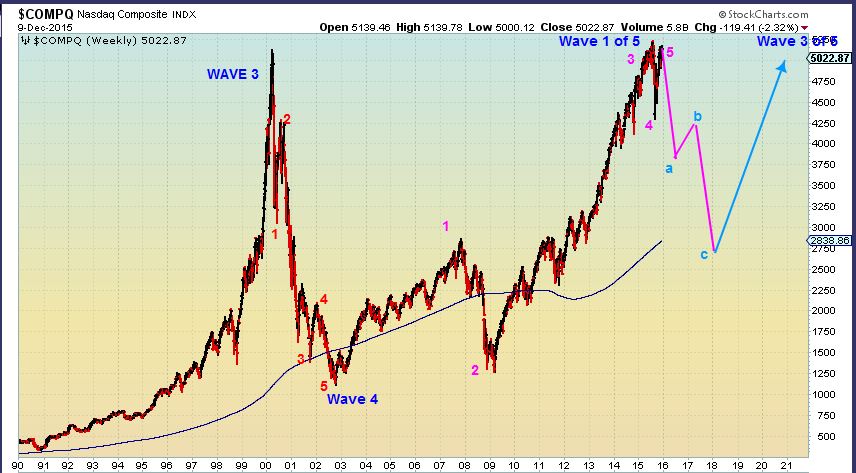
NAZ – You wouldn’t believe it if I told you, but 50% corrections are common sentiment changers. Notice how the 2008 drop had a much deeper sentiment changer. I drew this 2 weeks ago when I saw that JNK etf . This id just an idea of how serious a sell off could get and still remain Bullish.
So really, we are experiencing a fast moving and possibly rapidly changing period in the markets. With that last Fed Meeting we saw Gold up, down and up again. The SPX rallied 75 points and then dropped 70 points Thursday and Friday. There is a lot of action and it can be a little hard to hold on at times. Stay in Cash until things resolve one way or the other? Take a trade and keep a tight stop? The choice is yours based on your trading style and risk parameters. We will have a BUY if GDX breaks higher and has put in a DCL along with Gold itself. I am focusing on the Precious Metals sector for the most part at this time. This should be kept in the back of your mind – In the U.S. , Markets close early Thursday and are closed Friday. Gold does not follow that schedule. I’ll be watching things unfold on this shortened holiday trading week, and report what I see, but Wednesday is my last report this week.
I hope you all had a great weekend! This week should be interesting even if it is a shortened holiday week 🙂


What a great review ! I appreciate the junk bond run down…
BEEK! How are Ya? Nice to hear from a friend from way back.
Yes – The Junk Bonds are not fairing well and I think it may be a precursor to what may be coming.in the markets. We’ll see , but at least it is a warning to tread cautiously in the Bull side of the markets.
Enjoy the rest of Ur wkend 🙂
I should have mentioned to look at charts like the VIX, SQQQ, SDS, etc
BY the way …look at DISNEY ( DIS ) And APPLE ( AAPL) & GOOG – They look ready to head down
DIS > huge star wars > sell the news.
Ok, Friday and this report did the trick. I’m now bearish on equity markets. No, not sell your house and go short bearish. But I’d sell the pops vs. buy the dips. If we can get a Santa rally, that could set up a Jan short.
Did you guys see the rigs report on Fri? Crazy. Oil ADDED 17 (what kind of idiot would have made that decision) and Gas DROPED by 17. But I’ll also be wearing sandals and shorts for Christmas this year. AAA expecting record holiday road travel,(thanks, low gas!) and next refinery maintenance period won’t kick in until mid/late Feb. Decent chance of oil inv draw next few weeks. Could that ignite enough short-covering to get Alex’s next pop we charted going?
wow…great report – kinda scarey.
question (and no laughing — i dont have time to research those damn cycles-tho it is on my 2016 2do list)
in glancing at your 12-18 oil chart… it just occurred to me .. those ICLs – look like the terminus of primary waves – (1 & 3) and the DCLs appear to be the terminus of the lesser degree wave – is that correct?
Terminus………..
hi bill https://uploads.disquscdn.com/images/f861c2f080a1c430f2f12b61c07149be7878d96769827735b5a78819917c6cde.gif
HI Maria,
Yes, I find that Cycles often fit right into E.W. counts . A new Main cycle starts at an ICL, and when it rolls over and becomes a “Failed” cycle, that is when the lows are taken out in the corrective drop and we look for a daily cycle low , then that daily cycle rolls over into another dcl, then a final ICL. That would match your 1-2-3-4-5 down, or a shorter one matches your A-B-C down. The benefit of cycle counts is that you can anticipate those lows in timing ( Counting the days expected before we reach a low).
Does that make sense?
By the way, you said kinda scary .
If you mean the NAZ chart, it is not a confirmed idea, just an idea of how big of a drop can be considered normal and a real sentiment clearer. If you look at the “Crash” drop from 2000 to 2002 – I expect that it could be 1/2 of that (And possibly I drew my ‘c’ a bit too deep). Drop price down to that blue ma line and remember that that line is rising, price may A-B-C its way down to 3250.
OR
We dip down and put a handle on that giant cup by undercutting the August lows ( 4 on the chart) & blow off top higher, but I do not feel that that matches
yes.. thank you.
I imagine that this will be happening to a lot of PM juniors next year – being bought out for cash which will lock in massive losses for the shareholders. Would be much better if the small companies were taken over by the big boys offering stock instead of cash; at least then a recovery of capital would be possible.
The fact that LRE price hasn’t hit the $0.52 bid tells me that shareholders ain’t happy, and this deal isn’t done yet.
-refresh
It’s not often, or ever that you use the word dangerous in your reports Alex. I have to respect that as things on the “white water” are very choppy to say the least. I’m scalping only and not holding anything overnight at this point. Great report and thanks for confirmation of my sentiments on SPX.Really appreciate your insight and charting. Not only do you help us make money, but you SAVE us from losses also. 🙂
Agree, I am day trading, out by close. Just can’t trust miners and gold. Maybe that’s a sign the 3 year low is in place.
Scalping is not a bad idea in difficult markets. Lock in gains before they take them back. Crazy moves lately.
Nice to see you back Bill, hope your ‘travels’ were enjoyable.
No kidding! I had a good day trade in NUGT Fri. Of course then wish I had held it longer. I almost got in Thurs night but wanted to play it safe. Last 2 Januaries have been excellent, looks like we are setting up for that again!
I didnt even realize that I used the word dangerous, I’ll have to go back and see what I was referring to. 🙂
,,,maybe u shoulda payed closer attention to what the teacher was sayyyying…..
…. instead of daydreaming ………………..
Uraniums are bouncing , and they do this from time to time, but DNN broke above its 50sma.
See DNN, UUUU, URG, ( Quite the base on UEC, but no upside break yet).
SOLAR STOCKS still looking good – JASO, SCTY, FSLR, CSIQ, TSL, RGSE, SOL, WNDW, etc
RBY is up 100% today………………………but that’s a bit deceiving 🙂
Miners selling off a bit, same as Friday. Gold isn’t turning down, profit taking I assume. Don’t want to hold overnight.
A lot of buys came in right before 4:00 on NUGT