
BOOM – Gold and Silver
It’s what we at Chartfreak have been expecting, but I think there could be even more to the story 🙂
More later in the report, lets review all market sectors first…
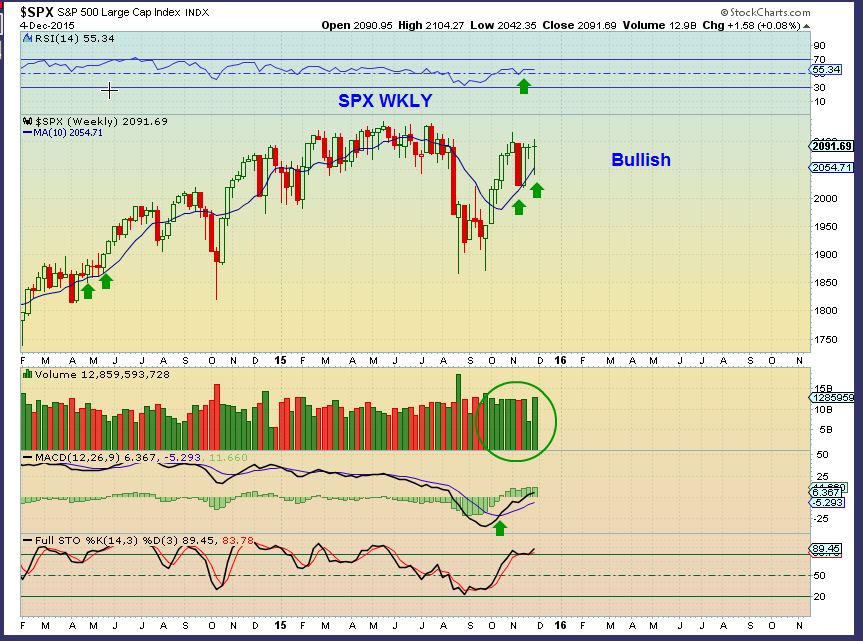
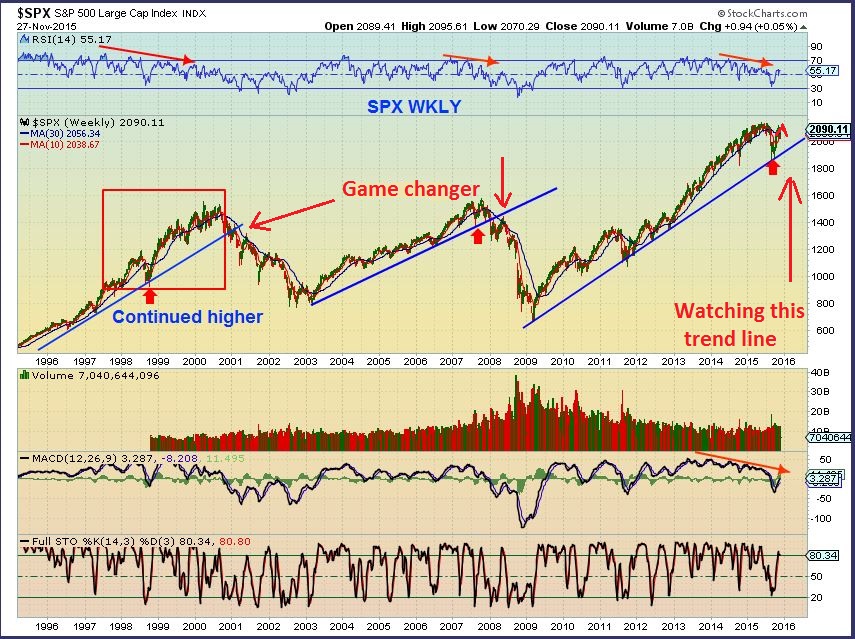
The SPX WKLY chart looks bullish with the recent reversal off of the 10ma.
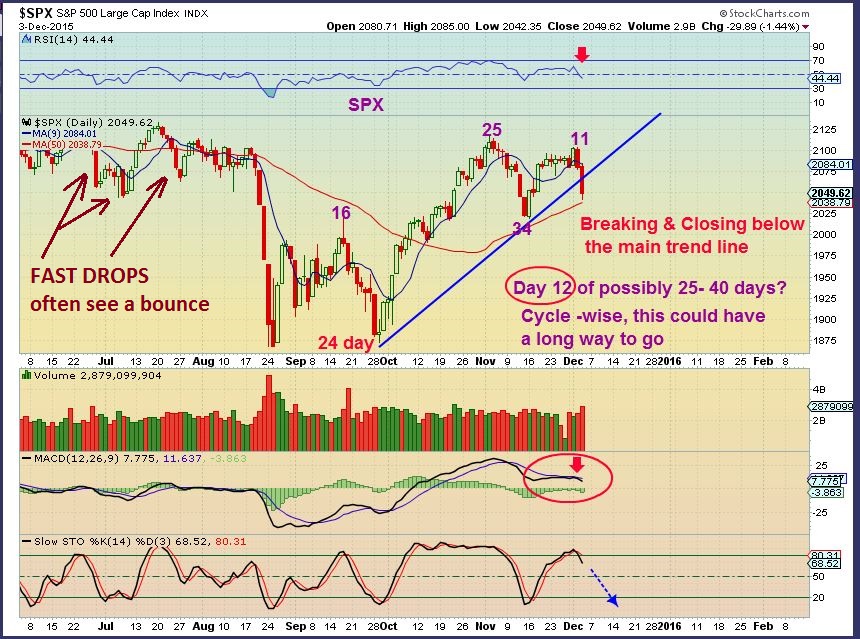
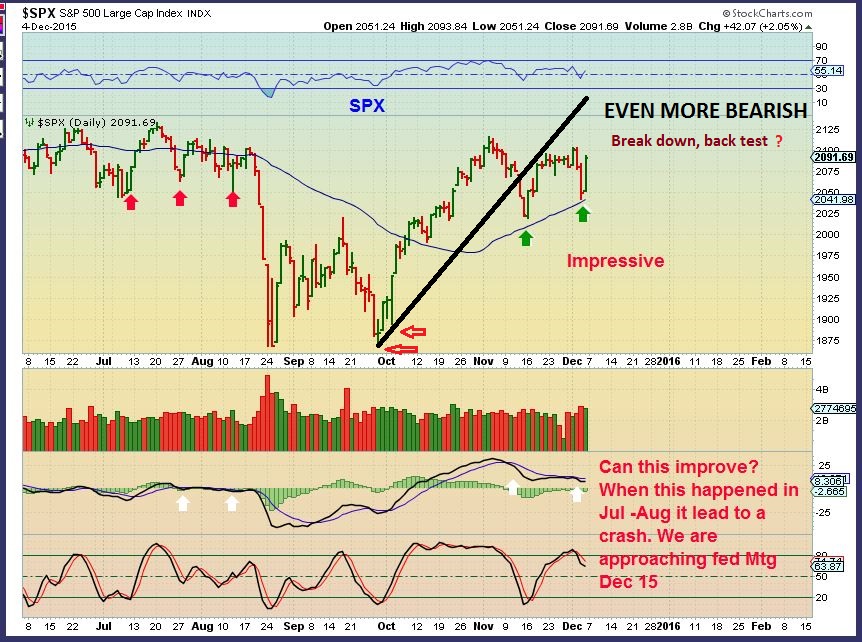
As a review, this was Thursday SPX DEC 3 – This is a break down with bearish implications since it broke that trend-line. In the past these large days down had bounce back days too (left side of the chart), but it remained sideways and lead to a crash. However – After this huge down day, Friday was a very impressive bounce back…
SPX Dec 4 – Just looking at this, it looks very bullish, but the markets are acting a bit shaky and indicicive. I do want to cautiously look a bit closer…
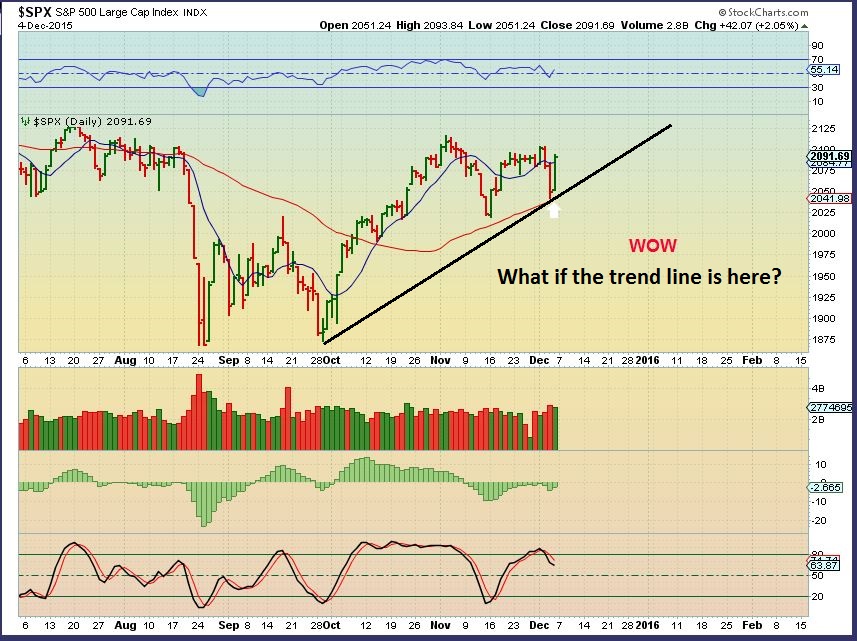
SPX – So this could be even more bearish with distribution occurring at the top. The MACD remains weakening, so I would need more time to see how this shapes up ( or down), and The FED MTG Dec 15 may be the key. I would still trade good stock set ups with stops in place, but longer term it is unclear. We may see what we saw on the left side of the chart again.
I want to share a “Game Changer” chart that I drew up in NOV 27. No violation yet, but it is 1 of many things that I am keeping my eye on. A drop below that Blue line may start a downside roll.
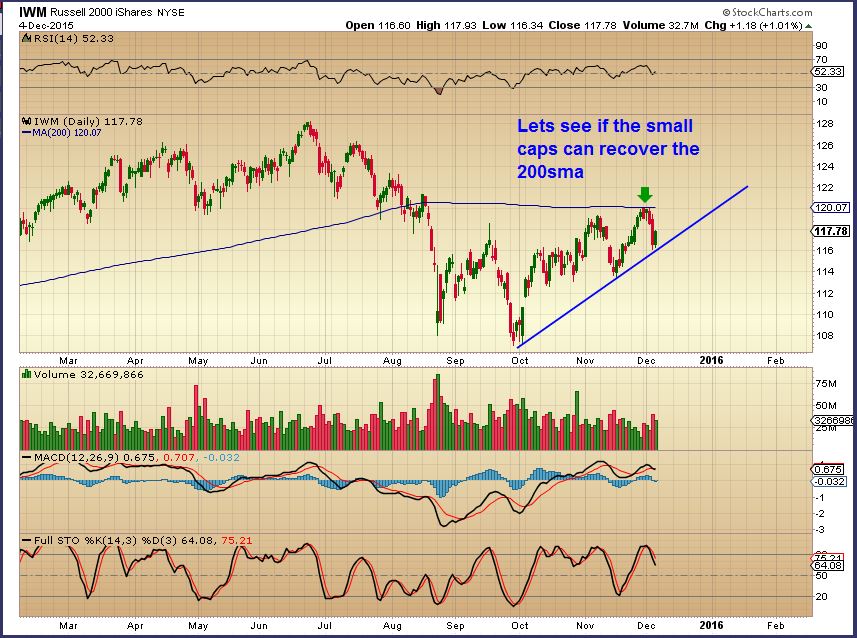
The IWM could hold some clues too. Can it break that 200sma? If this lagger remains like this, it might be a warning too.
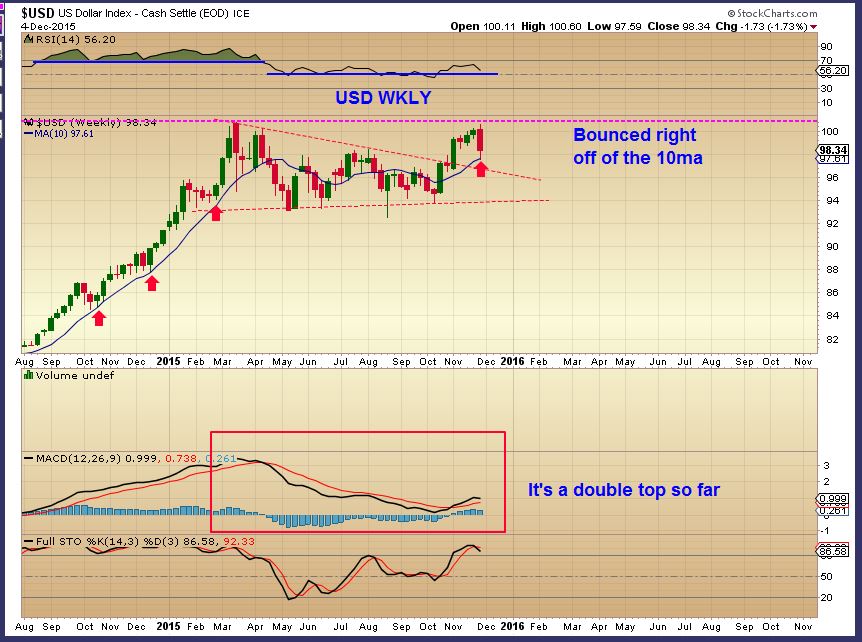
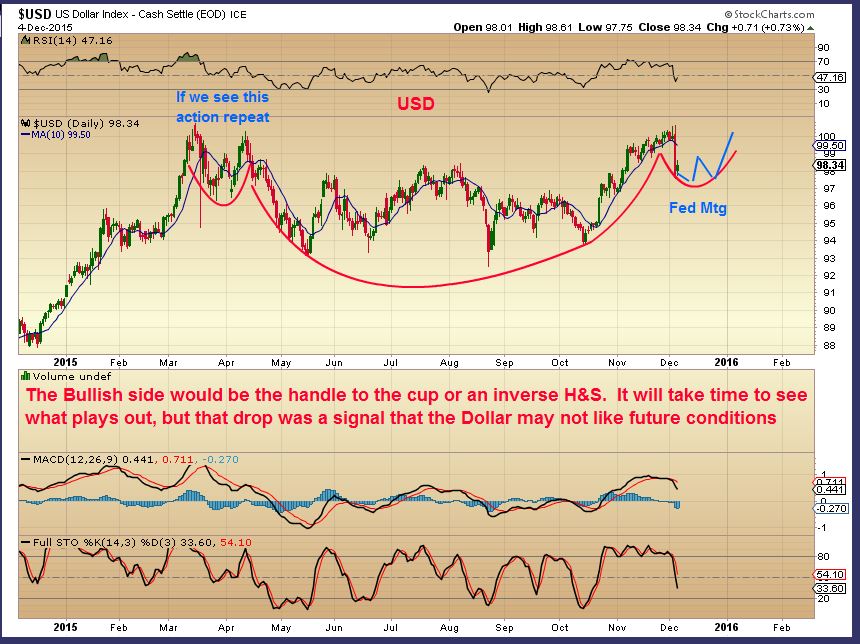
The USD – I had been pointing out that wedge for a long time. What a break down on the week of the FED, DRAGHI. Is it a sign of things to come? Is the game changing? We need time to know for sure, but it looked pretty convincing.
USD WKLY – no serious damage yet, but that drop may turn the MACD down and the divergence is already huge.
USD DAILY – A sideways type consolidation could turn bullish. A close below 96 could turn bearish. I’ll explain several reasons why if it happens.
NATGAS – After a long sell off, Natgas MIGHT be short term bottoming, but it remains unstable. I want to show you a long term chart of NATGAS to let you see what I think may be the story of OIL. A long negative trend bouncing off of the 20sma.
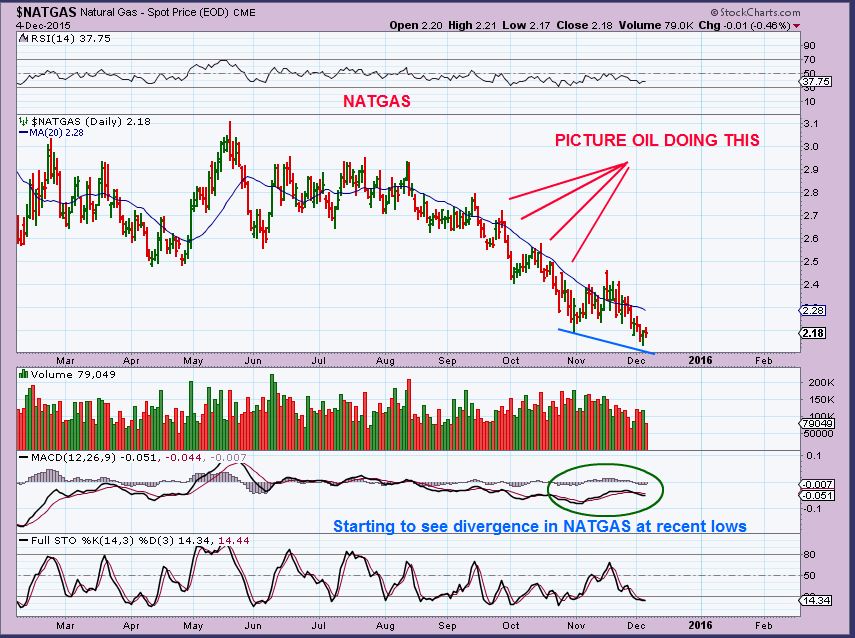
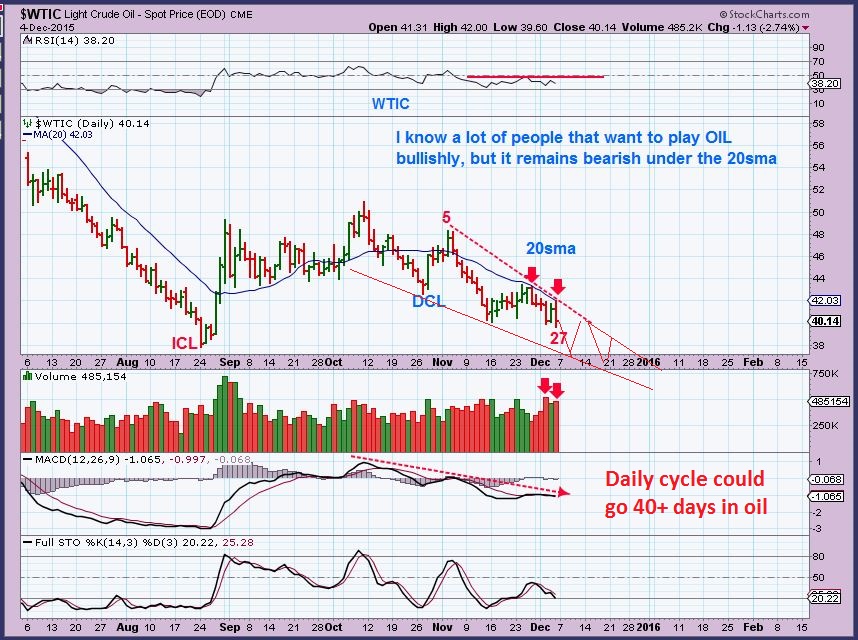
WTIC – compare this chart with NATGAS Above. It looks like we are at Sept in NATTY, right?
GOLD SILVER & MINERS 🙂
If you have been a reader here for a while , then you know that when I start digging into a sector , I want to look for important clues… I TRY TO DIG DEEP. I look at Bullish time periods vs Bearish, I look at many different indicators and use various time frames. I cannot fit everything into 1 weekend report, so I will just say that in many ways I like what I am seeing emerging in this area! I believe we may have seen THE LOWS in miners.
Lets just look at some interesting ‘stuff’. 
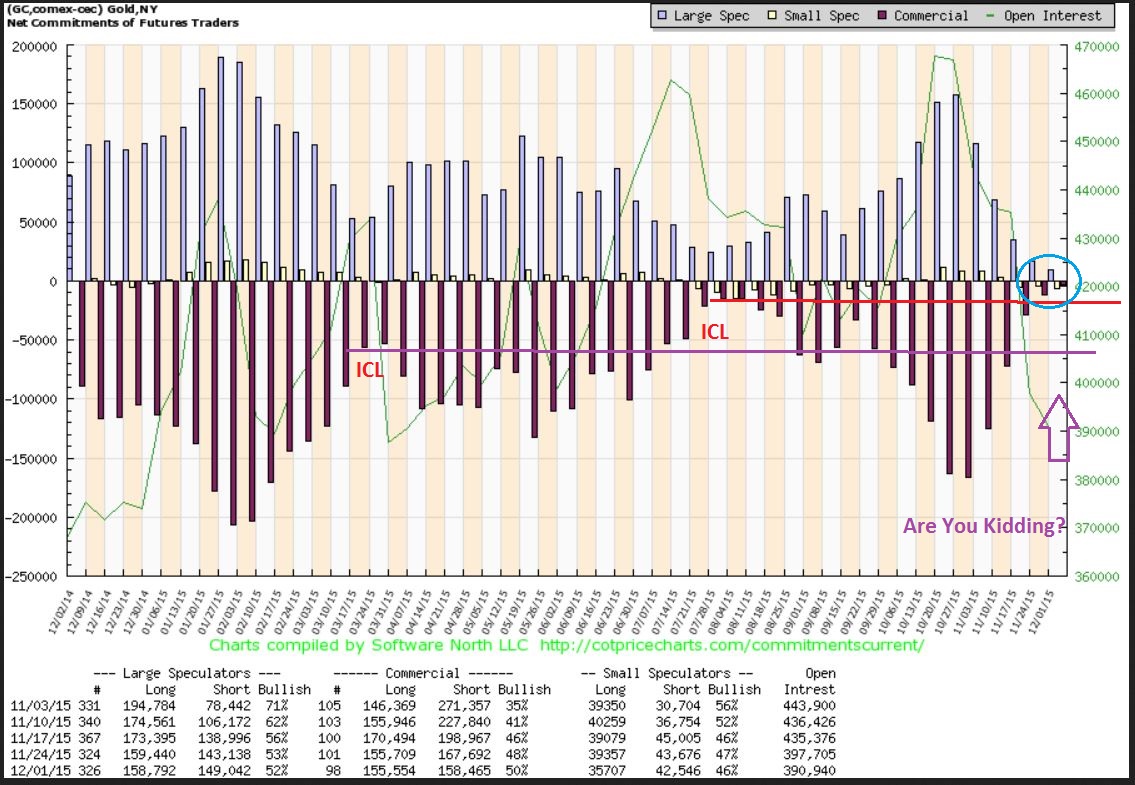
The C.O.T. – REALLY? That looks awesome to me. I would have expected to see this reading at THE BEAR MARKET BOTTOM ( or am I?).
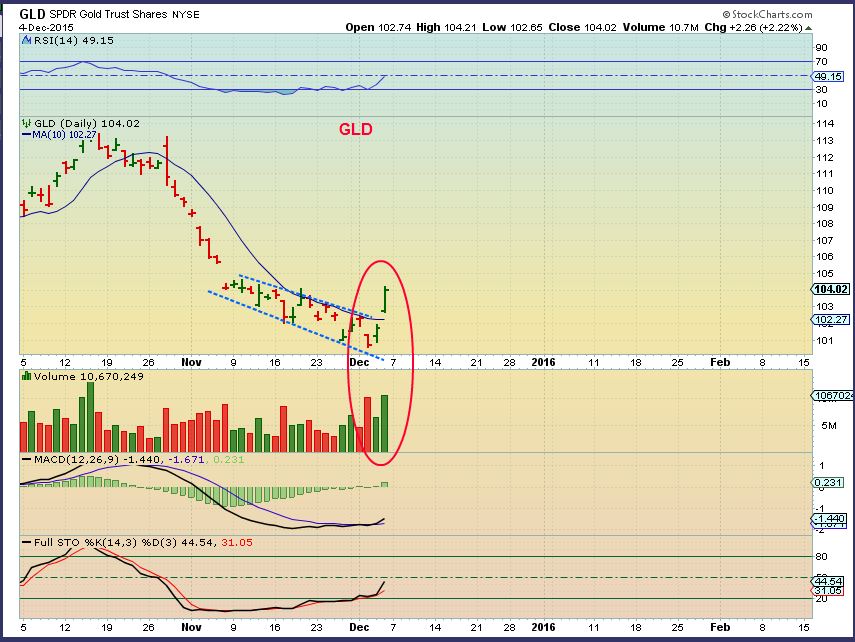
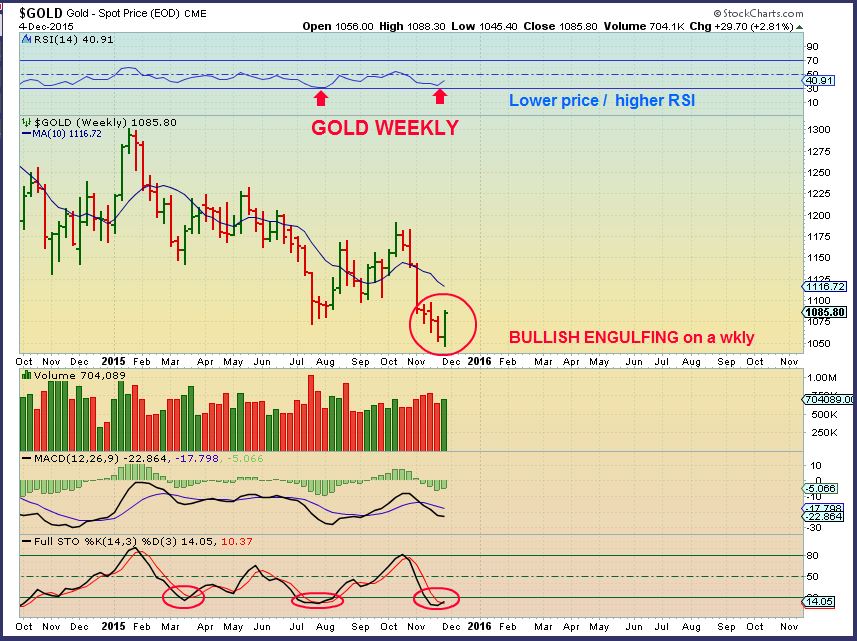
GOLD WKLY – BOOM, Bullish engulfing.
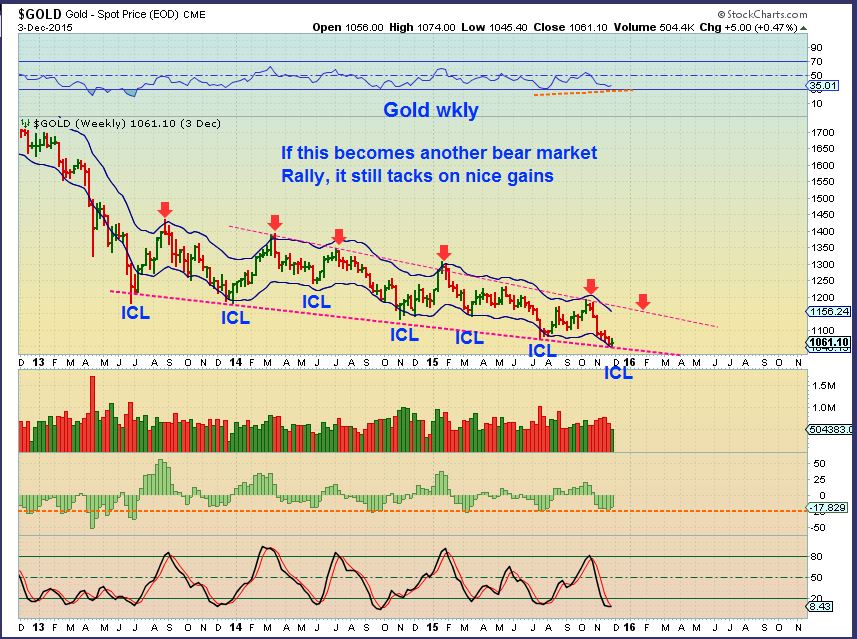
GOLD WKLY LONGER TERM – I drew this before the big ‘pop to show that even a bear mkt rally puts in nice gains for the next couple of weeks. Does that mean that the FED decision is already baked in?
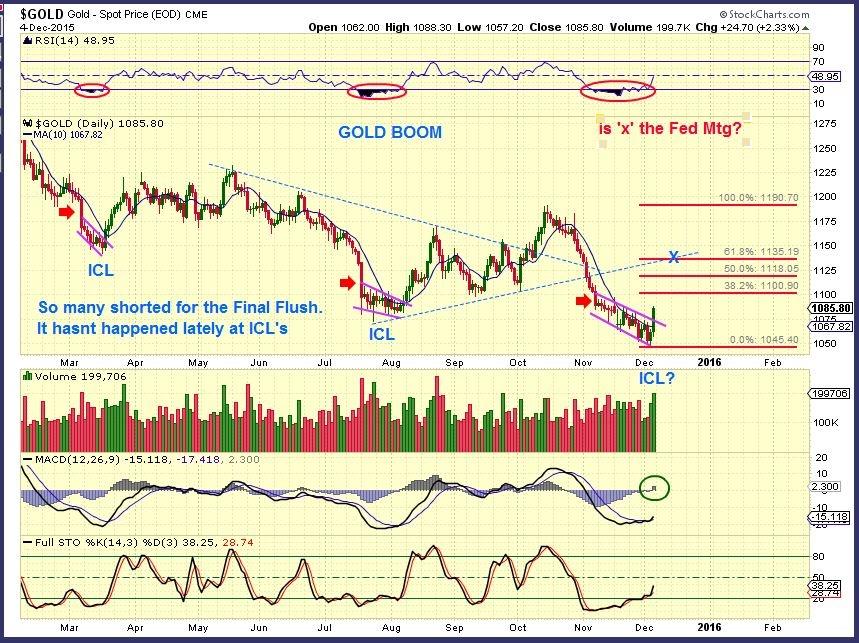
Gold daily – DAY 1 of an ICL was Friday in my opinion. So many were shorting for a final flush to $1000 again, that we will likely see some short covering & buying. Past ICL drag downs produced nice gains. Could we hit ‘X’ by the Fed Mtg, then pull back? Just 1 of many guesses. We could run to the 38% or 50% mark & go sideways until the Fed Mtg too, and then punch higher. There are many possibilities, but the point is, Gold should make a nice run now.
 .
.
MINERS – So much to say! I really have been trying to express here that Miners looked great while Gold continually made new lows. They usually get crushed! I am seeing several things that could be very bullish even longer term too, but I am going to save some of that for a future weekend report, as I gather more data. We will receive further confirmation in time if what I see plays out, and for now I remain Bullish on Miners short term in a big way.
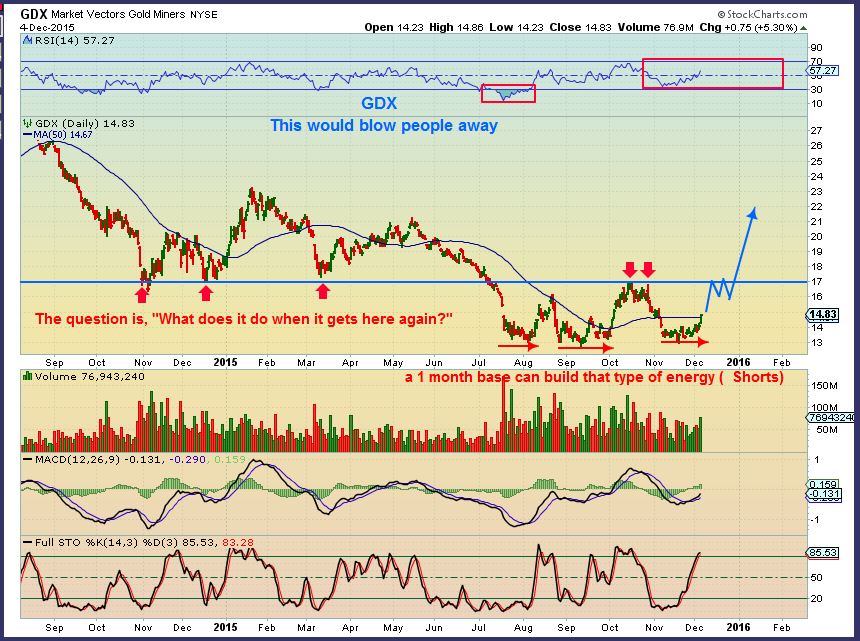
GDX WKLY – No new lows , while GOLD & SILVER broke their summer lows and kept dropping. This is a bullish wkly chart with GOLD POSSIBLY ONLY ON DAY 1 of an ICL . Notice the higher low here.
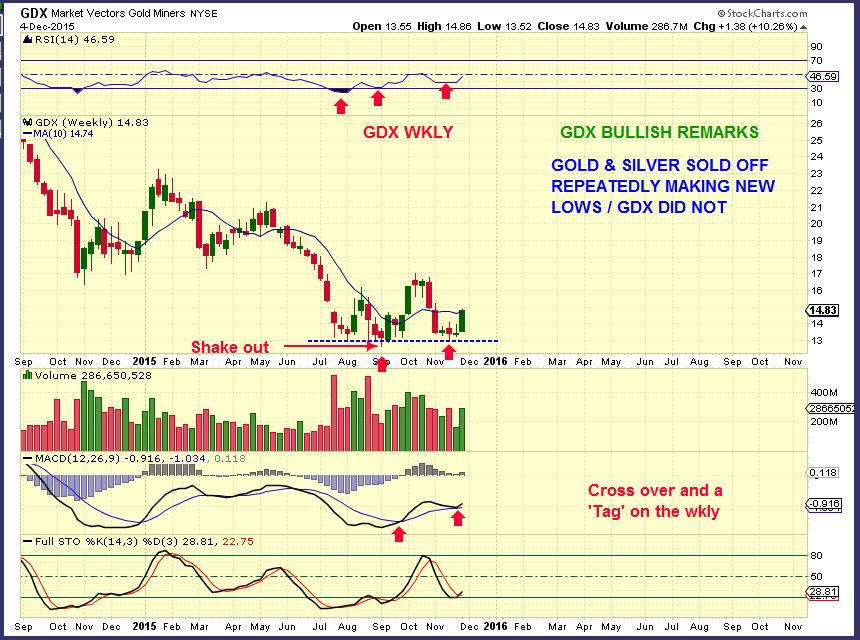
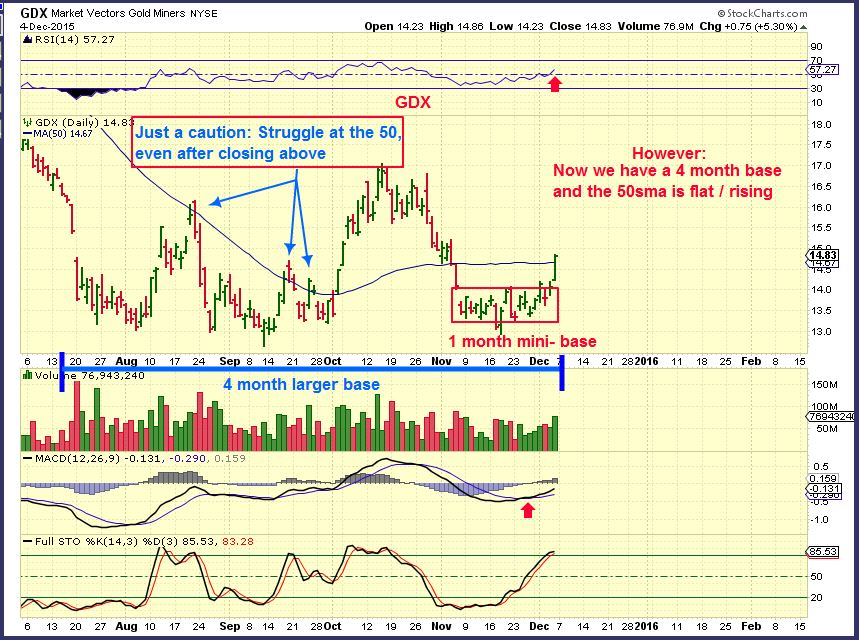
GDX – The crazy part is that this has put in a healthy 1 month base while Gold sold off again and again. We also see a larger 4 month base with higher lows. We may pause around the 50sma, but this can also just power higher like SA did above it’s 50sma. With short covering and GOLD moving higher, it may just run. What if this runs from its base to $17 while Gold finally takes off?
GDX – A run to that $17 area ( Pause around the Fed Mtg) and then break higher would blow people away. Many would still be left behind after being stopped out of their short positions at these lows. I’m not saying this is the path, but did Gold just put in an ICL? With the size of this base and Gold possibly only on day 1 of an ICL – It is not out of the question during Golds second daily cycle for Miners to break the highs of October. That could turn things very bullish.
GDX is made up mostly of NEM, ABX, and GG. If they looked Bullish, the above theory would be more plausible.
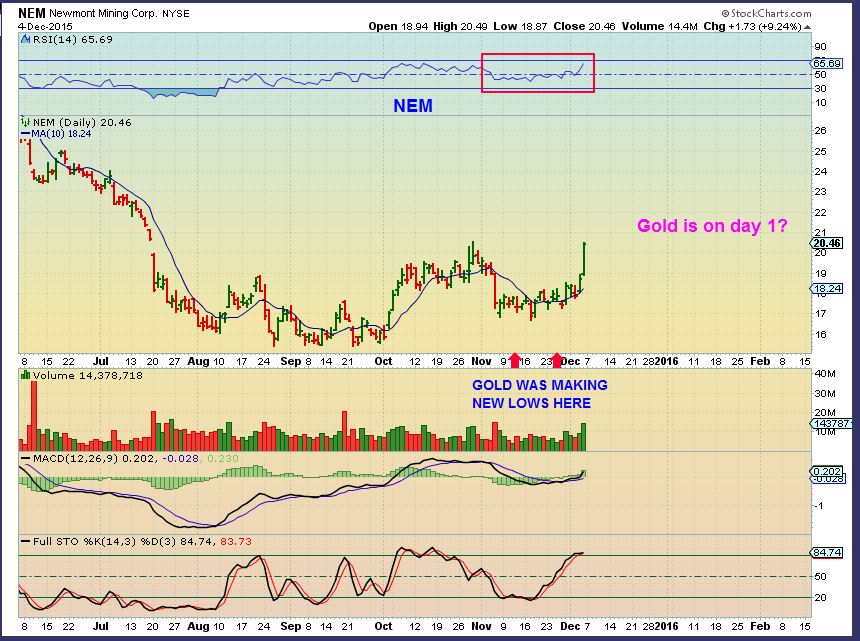
NEM – Friends, this is with Gold breaking down to new lows day after day last week. Really? Remind NEM that it is a gold stock please. 
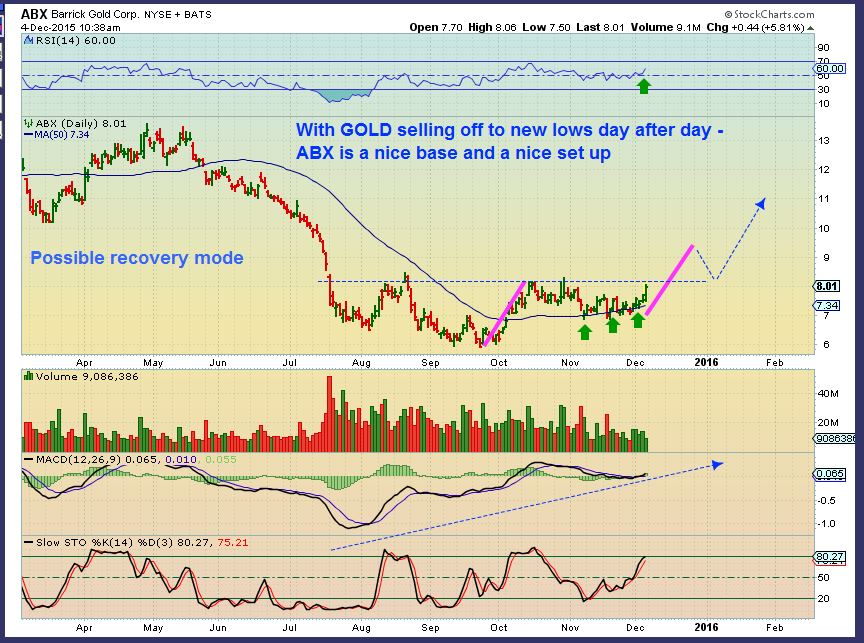
ABX WKLY – As Gold broke to 6 yr lows daily, ABX bottomed in Sept and has a strong base (inverse H&S). This could run to $10.
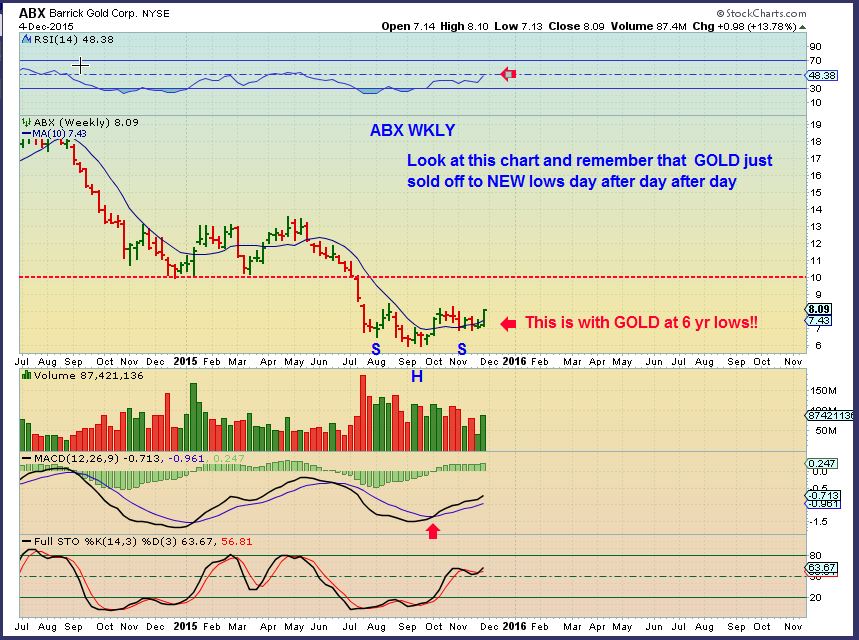
Can GDX go higher? ABX daily looks ready to break out, as Gold entered day 1.
Lets look at a few other Miners – Bullish
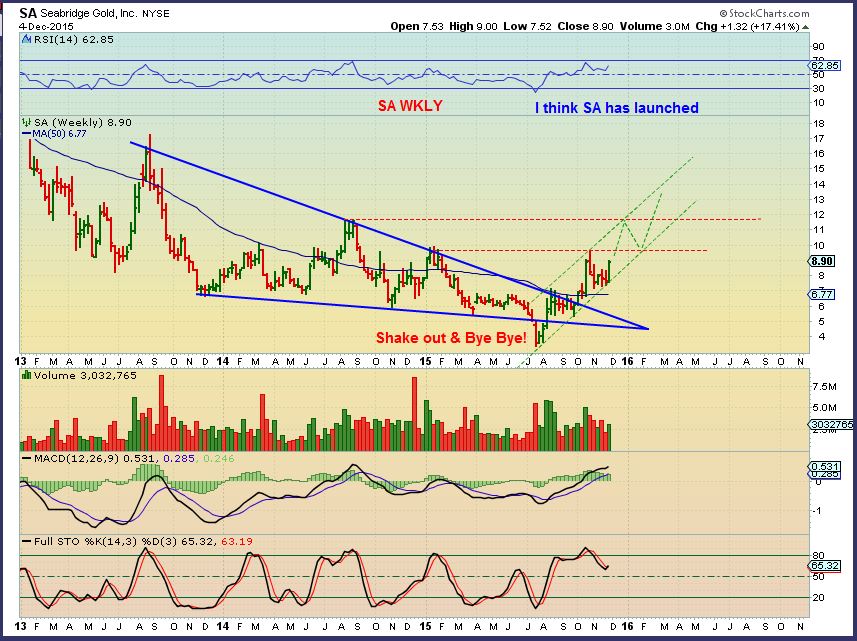
SA WKLY – I mentioned buying this on a tag of the 50sma on a daily chart. This weekly chart actually shows that SA may have seen its bear market lows this summer. It is up 200% since July and looks set to continue higher. Did I mention that Gold broke to 6 yr lows last week? Tell SA that.
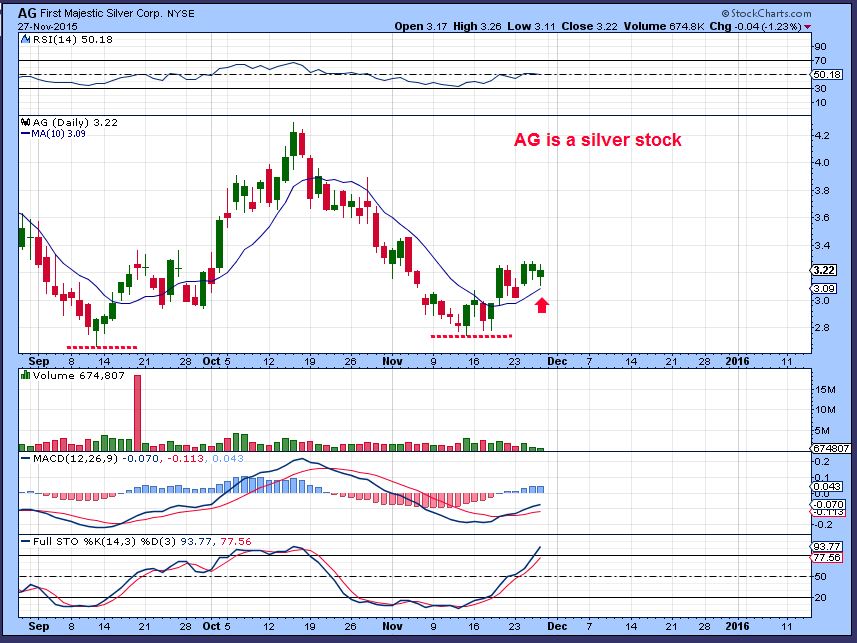
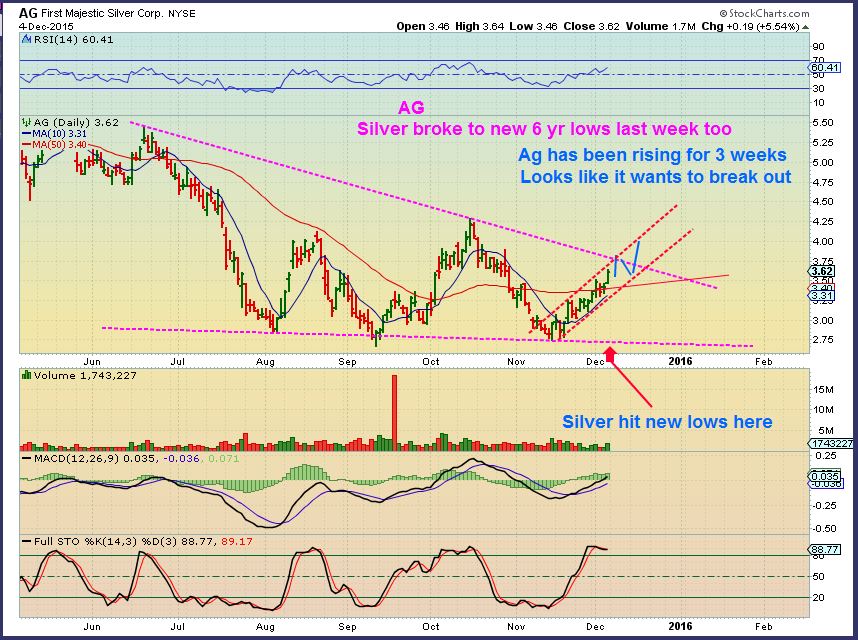
Lets look at AG’s progress
AG – I mentioned a bullish wedge on Nov 19 with a MACD cross coming, and it broke out 2 days later.
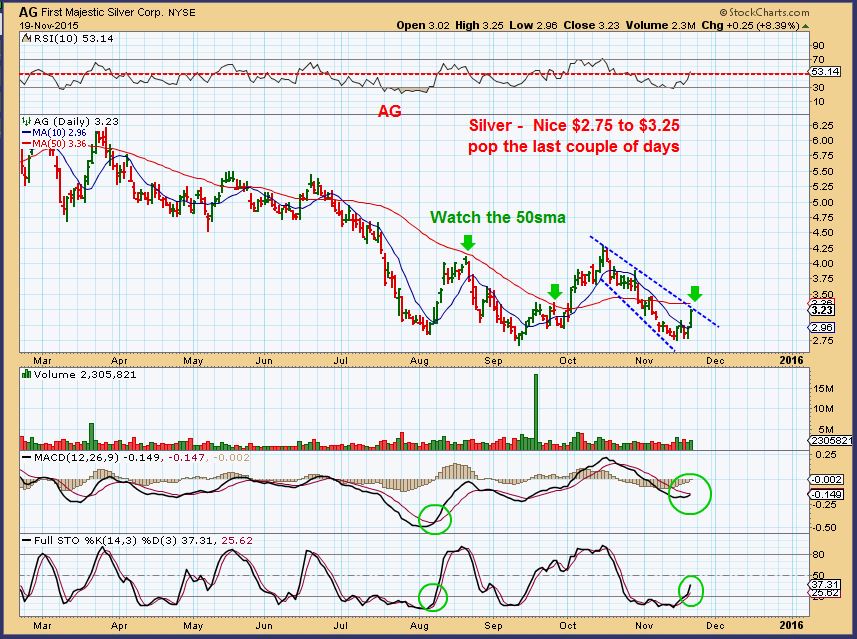
With silver weak & dropping on Nov 27, I then mentioned that AG and others held the 10sma when it dropped to $3.11
AG – Now $3.62 . With Silver at 6 yr lows, AG broke above the 50sma and may be preparing to break out above Oct highs.
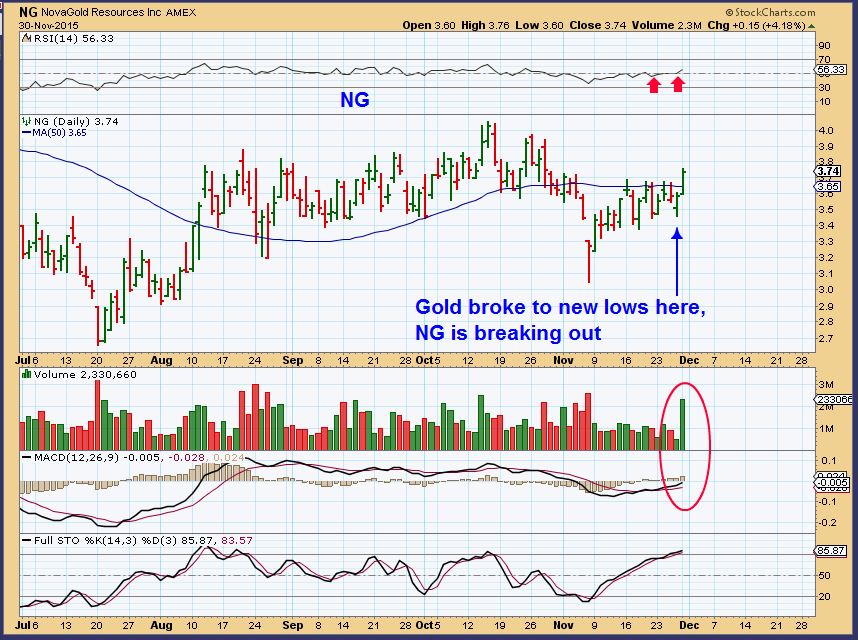
NG – Nova Gold broke above its 50sma with strong volume on Nov 30. This type of long consolidation and shake out can produce a strong run.
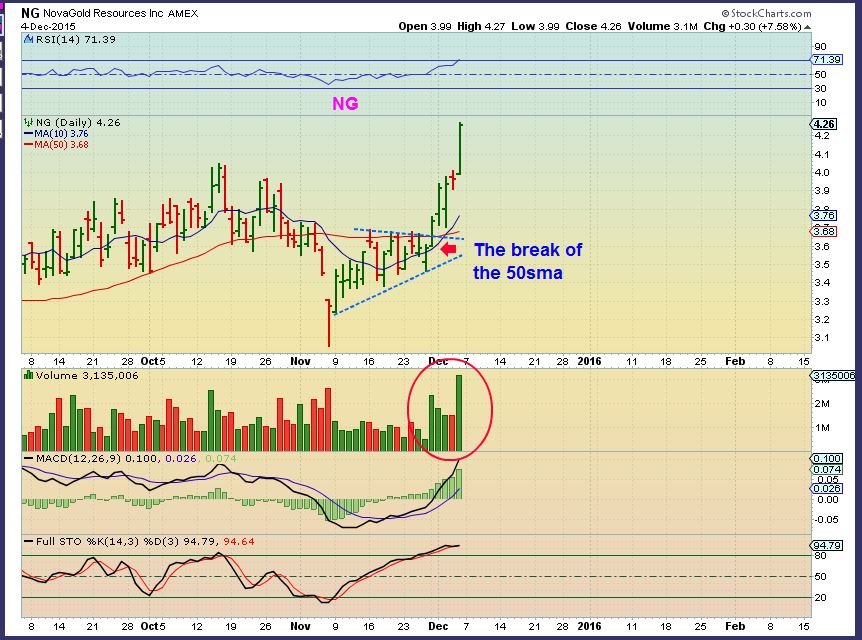
NG – Boom! Did I mention that Gold has been crashing lately? NG gained 25% last week , with Gold crashing to new 6 yr lows. Many were afraid to buy & hold Miners as they left the station.
The charts have been quite clear, but it was so hard for many to believe. Gold drops and Miners get crushed has been the normal rhythm of the markets. Now Miners have been ignoring Golds recent slap down for weeks. This week I continued searching through so many charts past and present, and I continue to see many important changes taking place in this sector. Some changes are very Bullish for the long term, if they continue to play out. I will continue to monitor these areas and add them into future reports. Right now I want to be clear that GOLDS POP Friday looks like day 1 of an ICL and Miners are in very bullish set ups with healthy bases and higher lows. The %-Gains can be very nice, as seen in SA ( 200%) and even NG ( About 40% in a couple of weeks, 25% last week).
I also want to mention that I see a good number of stocks in the tech area that are bullishly set up too. I had mentioned some in the recent past and many were not rattled in the quick sell off last week see GDDY & DANG for example) .
SO I want to release this report now just to get it out on Sunday, and I will try to draw up some charts of the Tech & Miners’ set ups before the market opens on Monday.
~ALEX


Thank you for the early report! As always, great information and charts!
THX T-5!
yup, ditto!
Ditto back atcha
Alex, what do you make of the difference between gold & silver COTS?
….could silver lag behind, and put in a final peak on the G:S ratio chart?
I second sog’s question. Also wondering about your analogies out of other historic bottoms.
If friday was pog catching up to dollar breaking down thursday, then another up day or two might be enough to normalize their intermidiate term relationship? So many apparent head fakes so little time 🙂 Thanks again for all.
I understand that for some, they may be uncomfortable thinking this could lead to a potential head fake. They may rather wait for a dcl and add for the 2nd leg up. We have seen the first daily cycle give up gains in the past, as they rise and swing back down. That is fine too.
I do not see this low as a potential head fake, for all of the reasons listed in my report and more. I have to examine all of the evidence and see this as the next lows, and that is how I have positioned myself. Often at this point, with the 50sma flat or rising instead of sloping downward, the move higher holds above the 50sma , much like SA did recently.
For me , Risk / Reward wise, the potential gains are much greater than a small stop loss would hand me. I also can enter low and raise stops to lock in gains. True – Miners likely wont run straight up, but many miners are quite bullishly aligned, I like the risk reward a lot and the potential %-Gains. Miners charts are good set ups (though some are extended already).
Look back at NEM – Lows form Aug held on the last dip. SA – not even close to lows, So I like the set ups. 🙂
Silver COT is at the same ICL levels that it was at the March ICL and .
It ran well in March , so I just plan on watching things going forward.
If they are on the wrong side as silver moves higher ( Like that pop Friday and if it has follow through) , will they cover shorts or add shorts on the rise, I do not know.
In the past, We did have a large rally in Silver with smart money caught short, so we’ll see what happens here.
…
Sweet Scott –
They dont run straight up, but the set up for SA has been strong.
Also Thx for posting, I dont think that I have seen your name here before 🙂
Two reports last Thursday, a Friday report and now the weekend report was extra early for more time to study!
I’m short oil; should have done that a long time ago but took me a long time to finally give up that there just wasn’t going to be a run back up. With the OPEC mtg unable to accomplish anything, there is no fundamental reason for oil to go up anymore at all until either consumption starts to ramp up or production wants; neither forecast any time soon. Will definitely watch the charts for clues, as it could bounce when setting double-bottom at 37.75 for WTI Crude.
nice job cason
It was pretty much a slam dunk going into OPEC. I only question why not earlier or heavier, but a win’s a win.
CF I was wondering if gold had crashed. Could you help me out on that question please?
…did jd just tell a funny?
I guess that question means no.
It was meant to be.
Note to self: Don’t give up day job
… i laugh at my own jokes too ;o)
someone has too…
I didnt get it…but I do now that the one who made fun of me for mentioning DRAGHI 3x is in the room 🙂
6x
Excuse me…we started a new page/ new report. MOVE ON!
lol
Thanks Alex, so you think this is an ICL not just a DCL! Also, what do you think about EGO’s chart? Looks like an Inverted H&S to me.
Seems like a big drop in gold for an ICL?
June 2013
Yes
Alex,
Recent history GDX first DC’s suggest— probable— re-test lows before continuation higher, no? Perhaps could post recent chart illustrating such your next report? Understand such could be abbreviated correction/consolidation this time around too.
Recent dcl, yes, but not always. Some take off running and do not drop that much. See MAY – July 2014
wow… oil/energy…
37.66 would be a double bottom in USOIL. A likely spot that it could bounce higher. Oil has seperated from my charts and gone the opposite direction since 11-6-15. If it breaks lower than 37.66 then get in. Play DWTI if you really want to go opposite oil. Could be a AB=CD pattern starting CD currently. Target would be 35
oh hello :o)
…im content jusssssst watching ;o)
Can’t win if you aren’t in the race!
.. have at it Willy …
… I just happen to have a proclivity for races of the upward sloping trajectory
** not that I have anything against oils per say .. ;o)