
This Market – Hot And Cold
This week various sectors actually made some moves that could affect the short and longer term outlook. Lets dig right in and review what has happened.
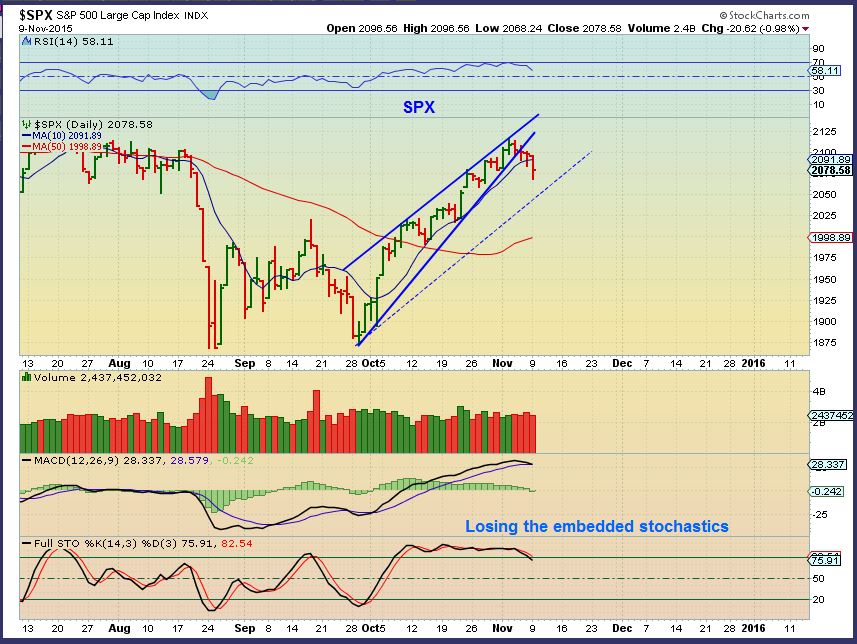
SPX – Expecting a pullback with resistance at former highs, this is wedge was posted and a possible channel could form.
SPX – The channel has been broken, but thats not bearish by itself yet. The SPX tagged the 38% retrace. We could even fall further this week to the purple dotted trend line for a back test. This is also the 50% retrace and the 50sma is there, so good support could be found just below current price. I do expect a bounce soon.
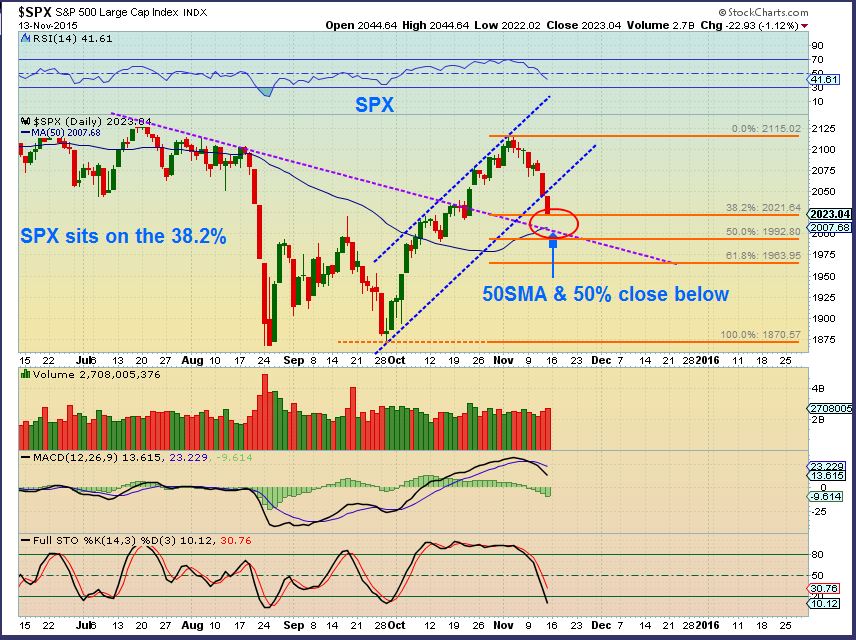
This is not bearish at this point, but let me show you something a little more concerning here…
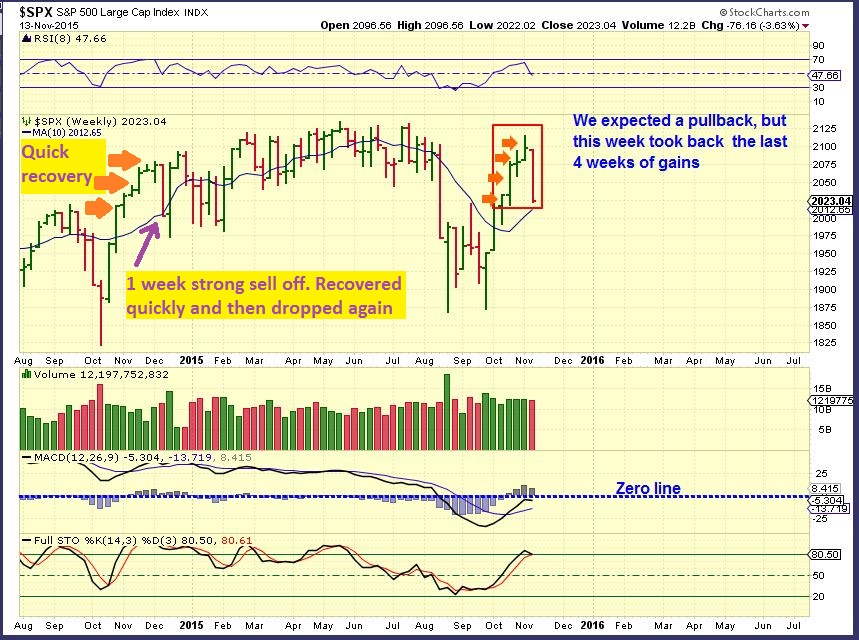
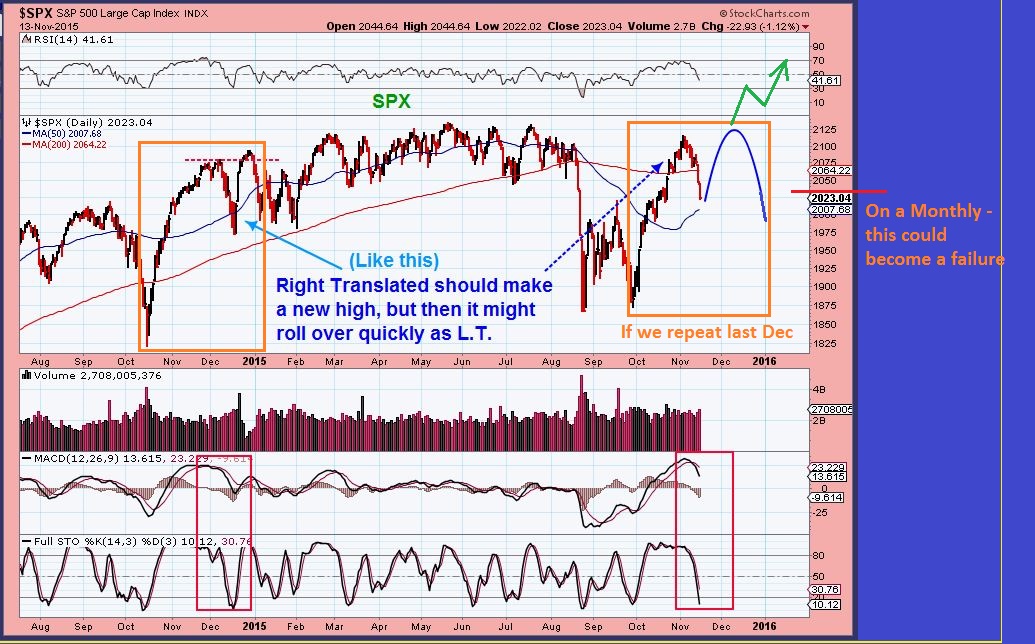
The SPX WKLY CHART – That was quite a huge drop all in 1 week. That needs to stop quickly. I wanted to show that 1 strong wkly drop also occurred on the Dec 2014 recovery. The following week went lower and reversed by the close of that week. We need that now i.m.h.o.
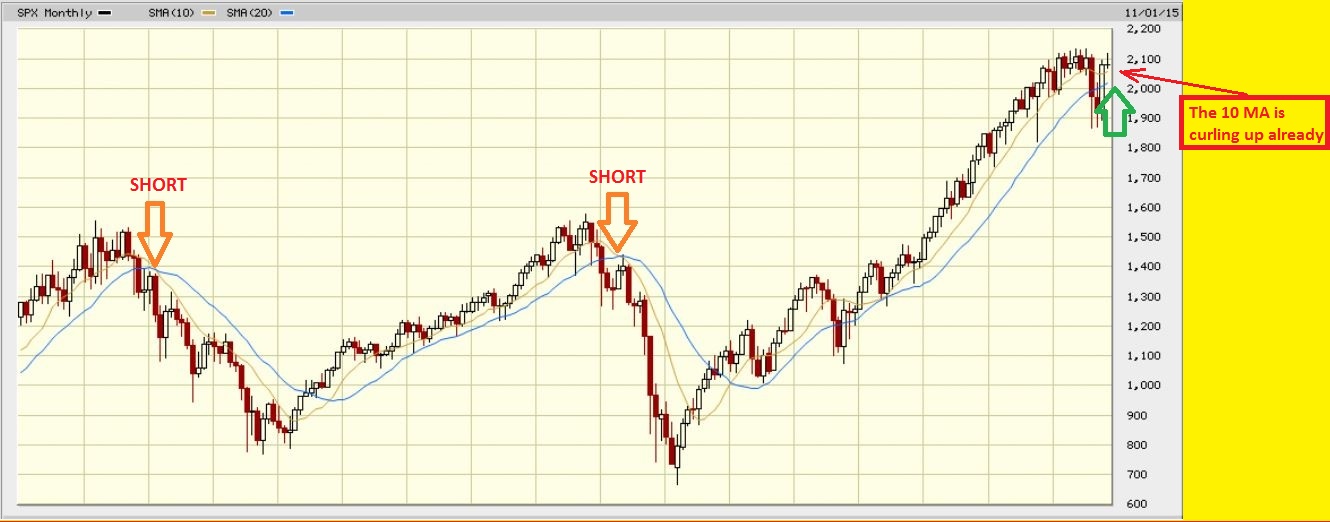
In this chart I show The BIG PICTURE – we recovered on a Monthly basis in October, but now we dropped back down again, so we need to recover the Blue Line for the Nov Monthly to remain bullish.
SPX – Cycle wise, we are in the timing for a DCL, and since this was a right translated daily cycle, I would expect a break to new highs. That makes this short term bullish on a reversal. I dont want to get too far ahead, but if we do what we did last December, new highs would roll over ( Fed MTG) . It also could break out to new Bull Mkt Highs at the Fed Mtg.
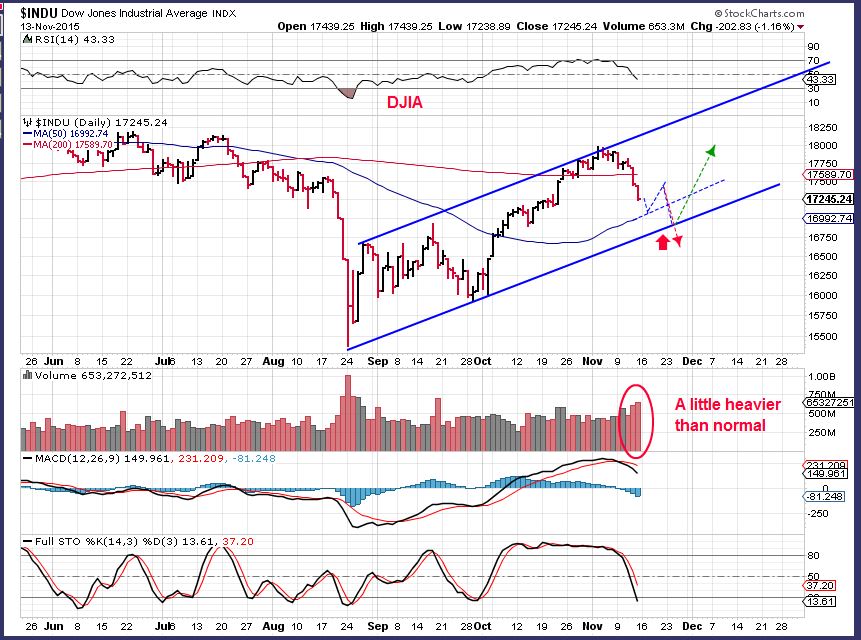
DJIA – In the timing for a dcl, The Dow looks like this. I also expect a break to new highs here, that red arrow down is not what I expect, but that 1 week of slam down last week was eye opening.
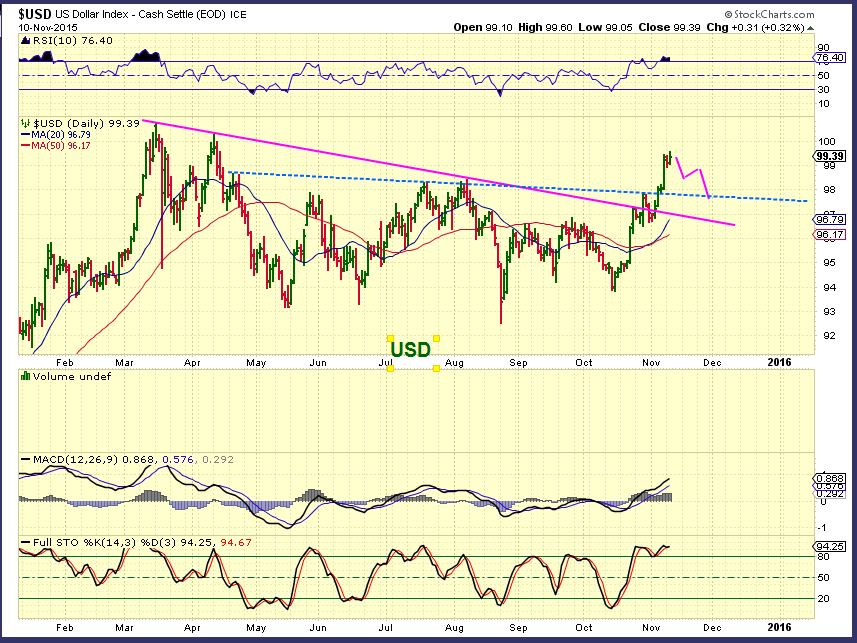
USD– The Dollar is due for a DCL, so on Nov 10 I expected this type of pullback ( Not a big dip).
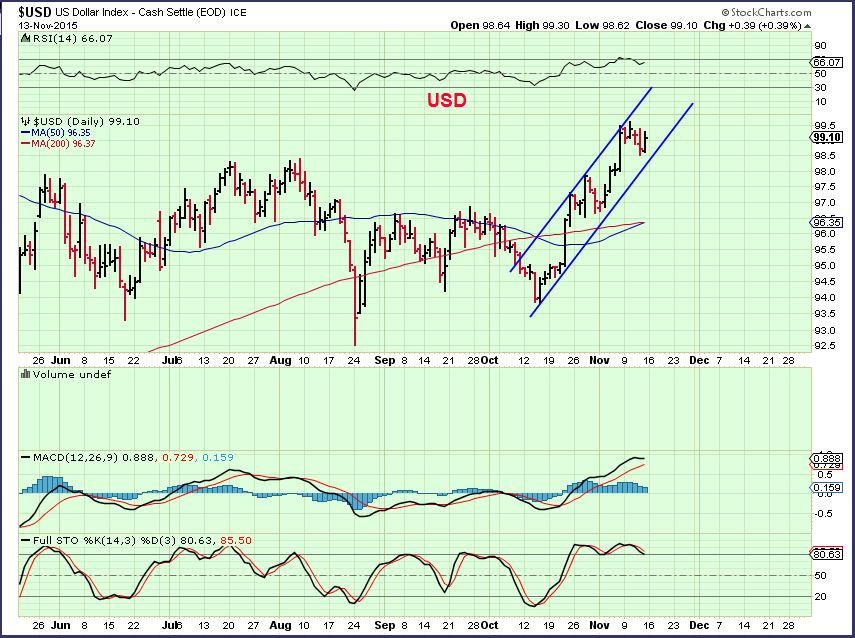
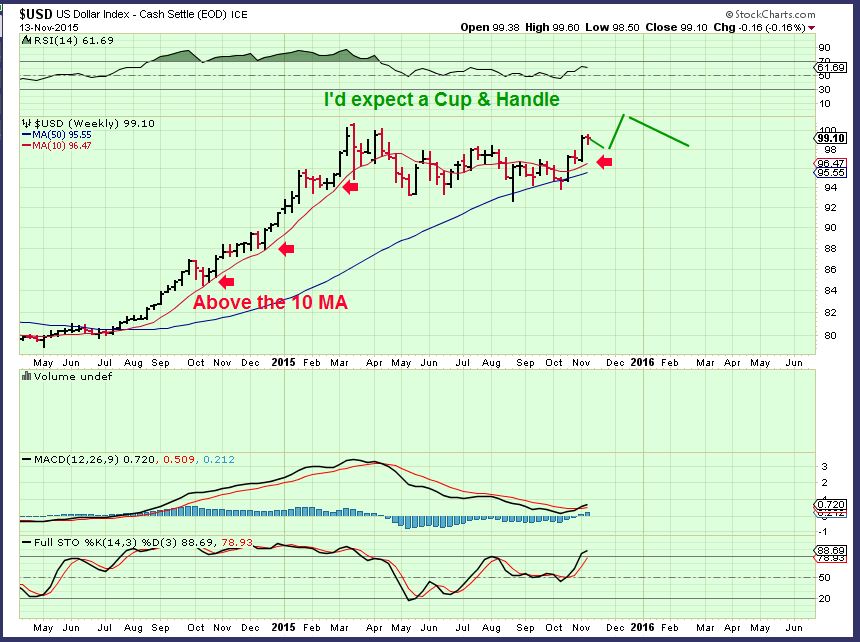
USD – So far it is a sideways pause, but I expect that trend line (Channel) to be broken to indicate that a daily cycle decline occurred.
USD WKLY – A little sideways action would allow a bounce now in Precious metals ( I may have drawn too much handle , since this is a weekly chart. I do not expect the dollar to be sideways into march actually). We’ll be watching all of these patterns going into a Dec Fed Mtg.
NOTE: This could also lead to a fake break out and the dollar would drop and commodities could bottom, based on FED action changing things.
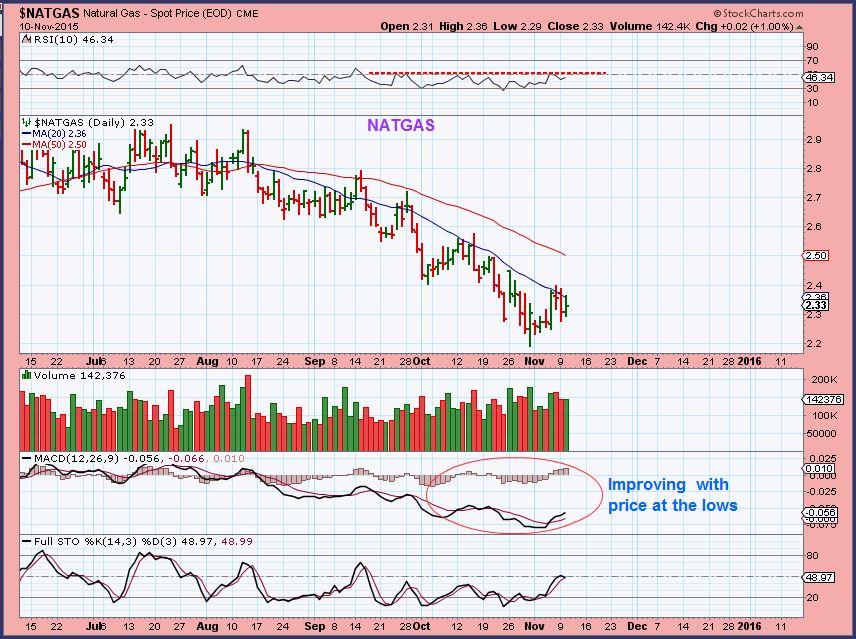
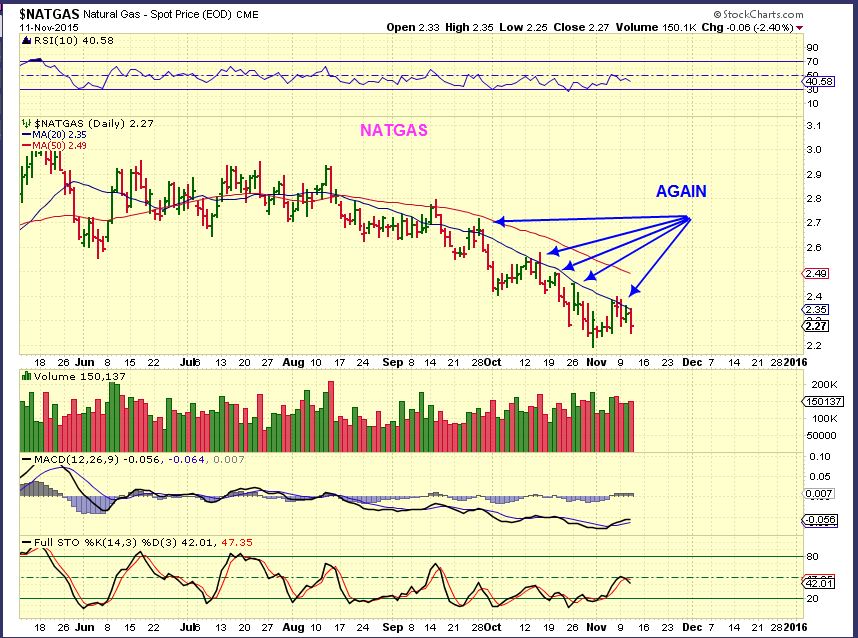
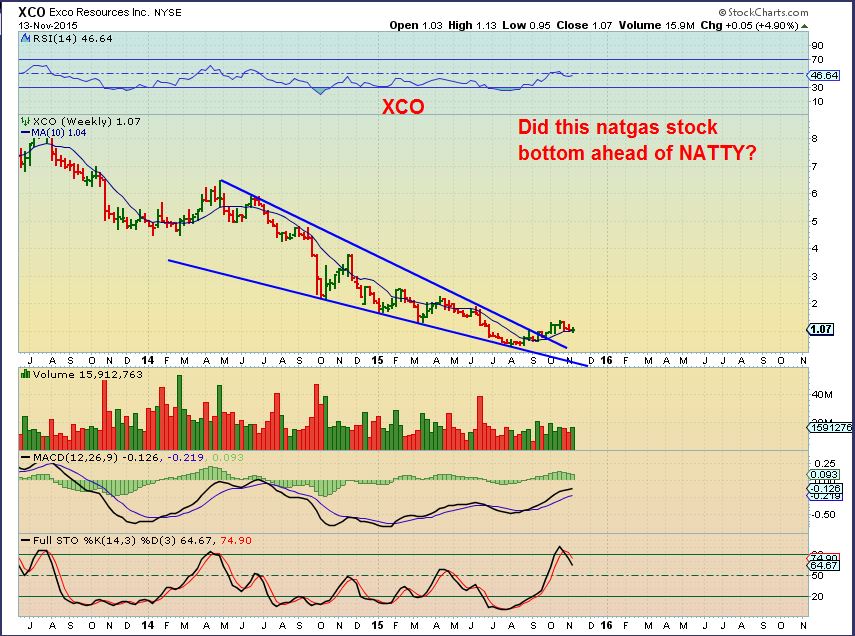
NATGAS – Nov 10 & 11 , I was watching the 20sma as persistent resistance, but I mentioned that the MACD & other signs were improving.
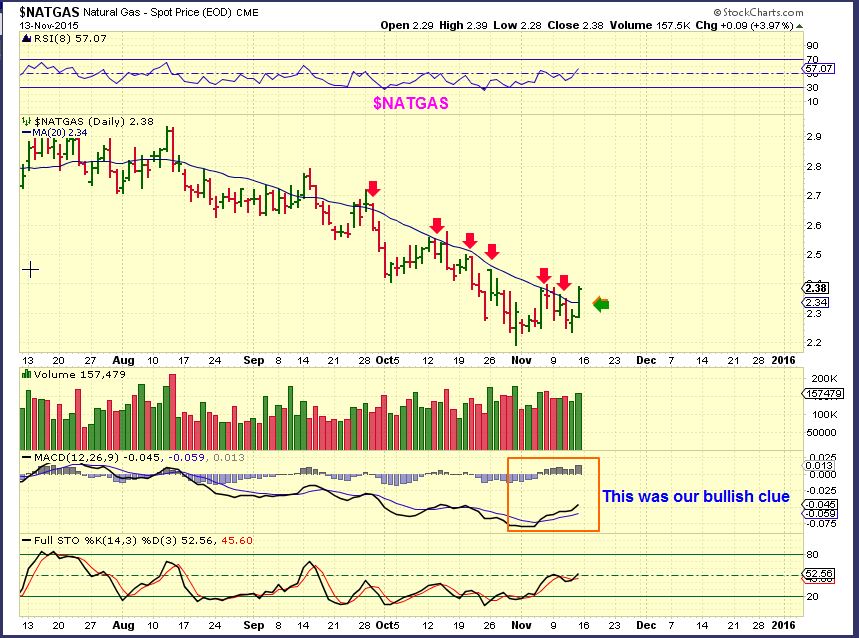
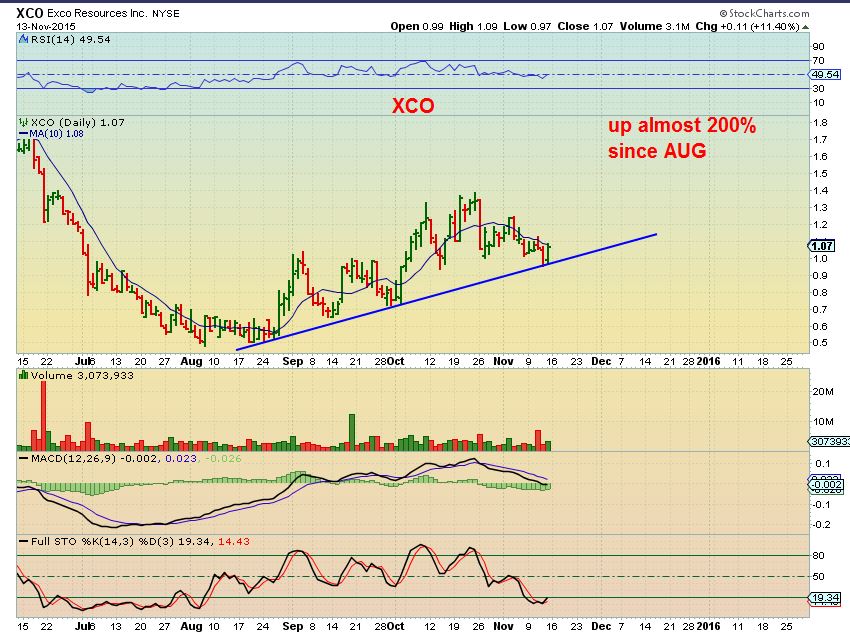
NATGAS – This looks like the bullish break. The volume was convincing and a close well above the 20sma is encouraging. A low risk etry would be to enter and stop out below the 20sma (Close below). Please note that in Sept and Aug we closed above the 20sma too, but timing is more favorable here if any want to take a shot.
XCO – A NATGAS stock
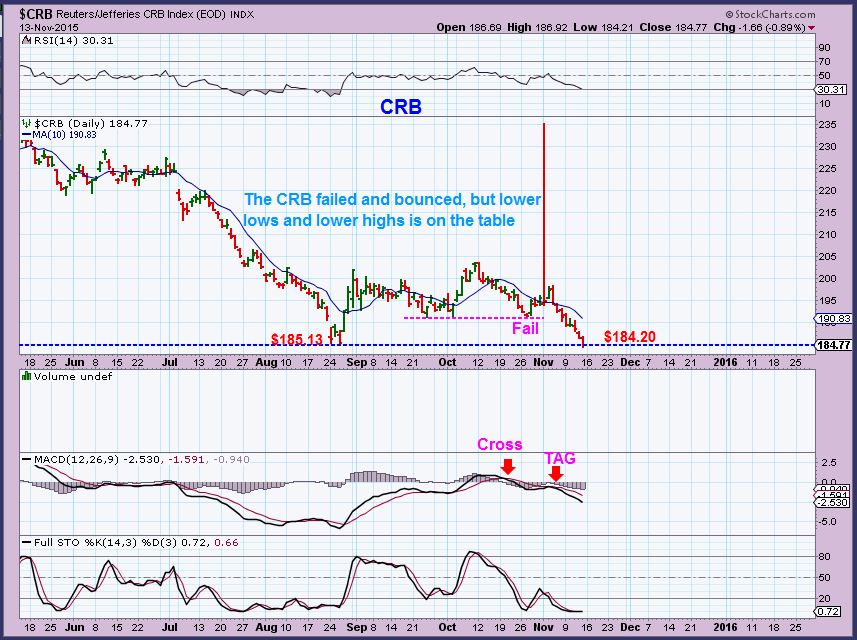
With the DOLLAR STRENGTH – OIL, The CRB, and GOLD /SILVER started selling off. It was believed that 3 yr lows could already be in place for the CRB & OIL this past summer. The CRB actually has broken down to new lows.
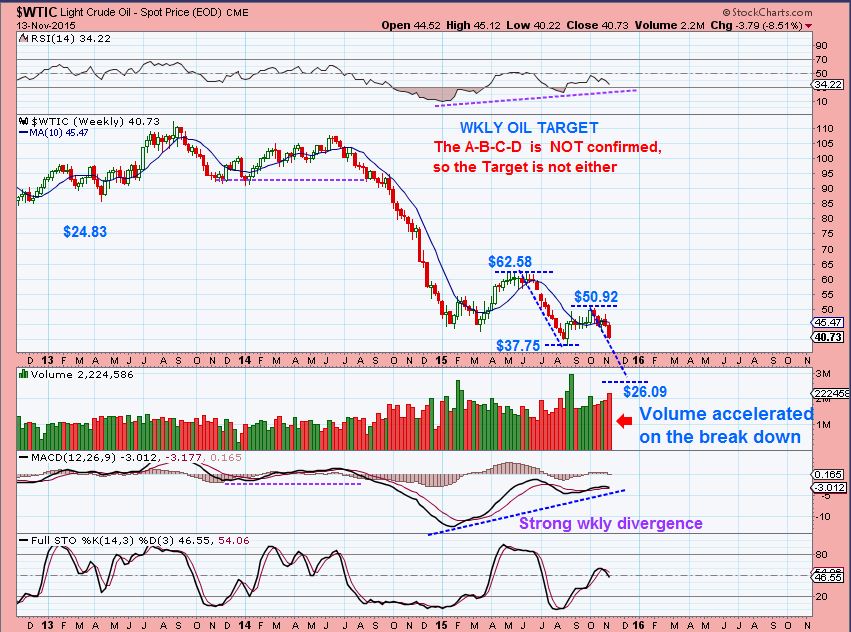
WTIC – Read my Friday report- Oil failed on Thursday. Oil now shows lower highs and lower lows. I Must admit, Oil is confusing in a way. It has failed its daily cycle and that calls for a trend to continue down, but many Energy stocks have reacted bullishly after releasing earnings for the past 2 weeks. The XLE held up much better than Oil . I was stopped out of my last Energy trades. 
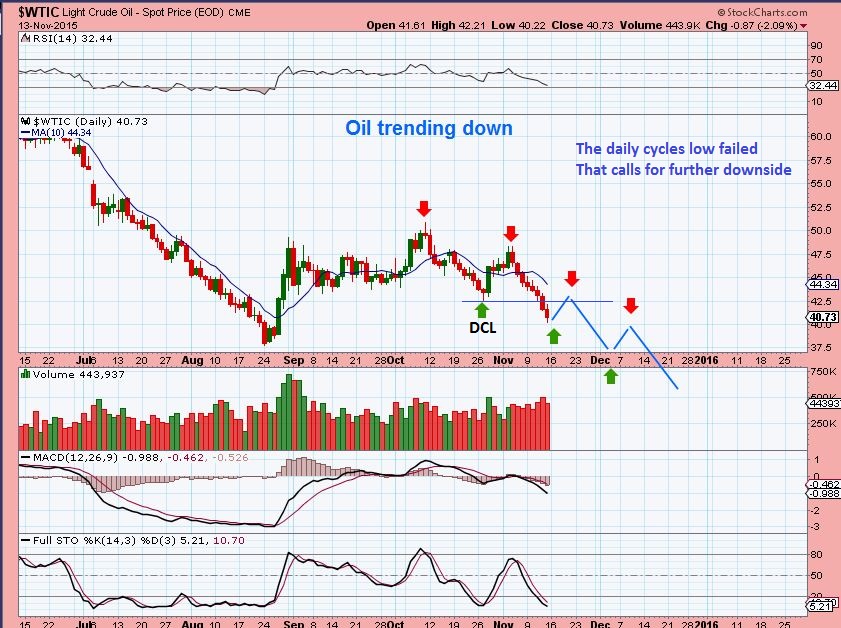
This would be 1 price projection if we got an A-B-C-D move , but this is not yet confirmed. $26.09
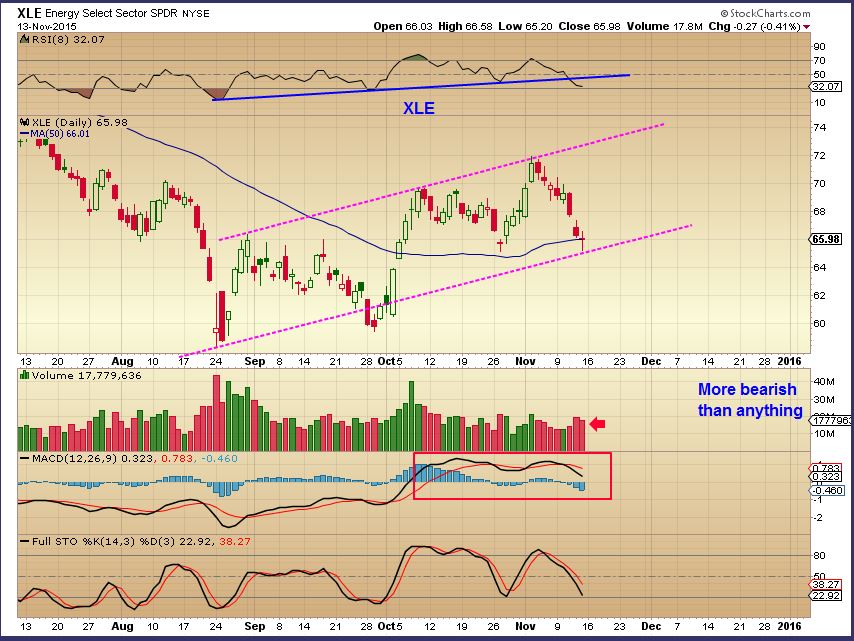
XLE – Slipped below the 50sma Friday and tried to recover. The XLE held up nicely up until Wednesday, but is looking more bearish at this point.
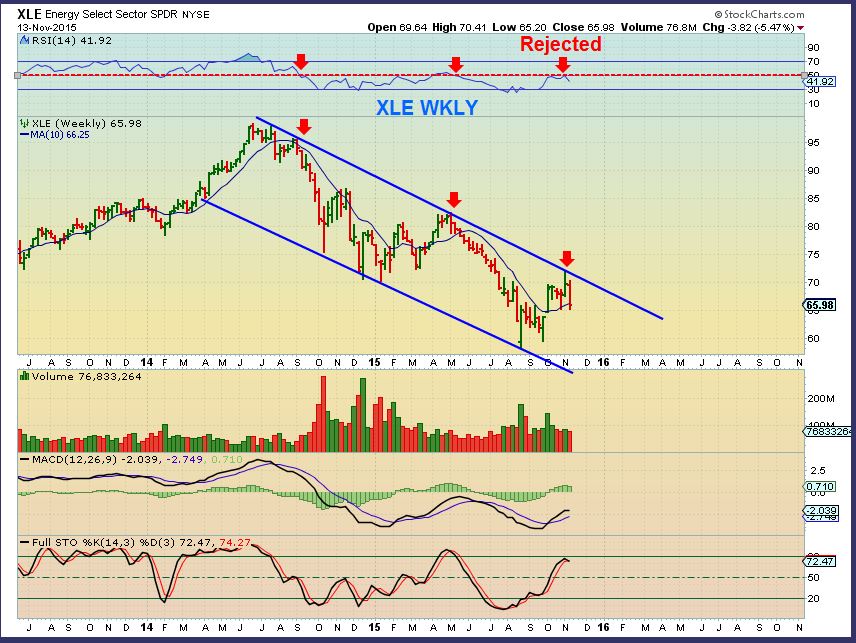
The XLE WKLY – With this big picture view, you can see how this could get ugly. I remain on alert for a break out or further break down, but OIL is damaged.
With all of that mentioned, I will show you why it is confusing or frustrating with some Energy stocks. We see that both OIL and the XLE look like they want lower prices, but a few energy stocks released earnings and acted bullishly last week (As the selling intensified in OIL & the XLE). 
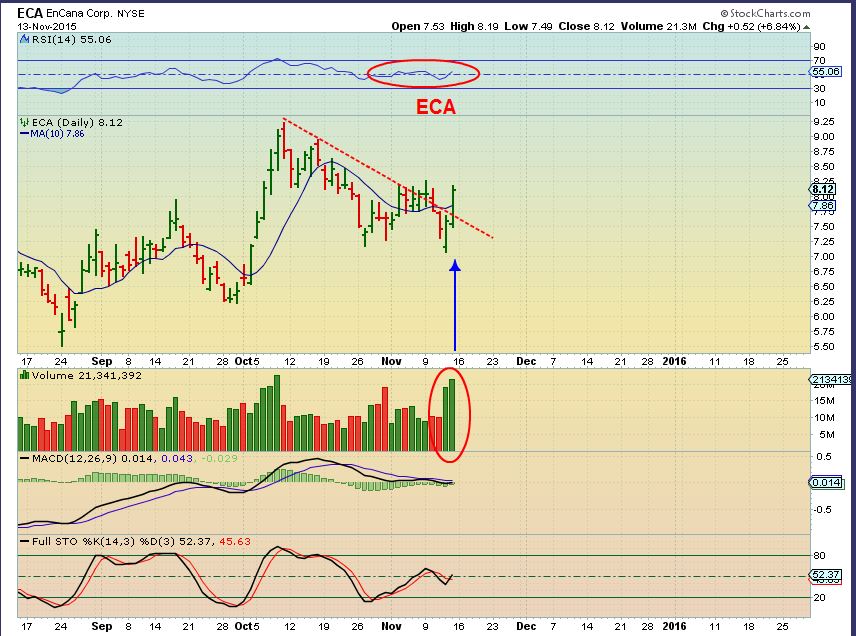
ECA Earnings Thursday and Friday follow through as OIL sells off.
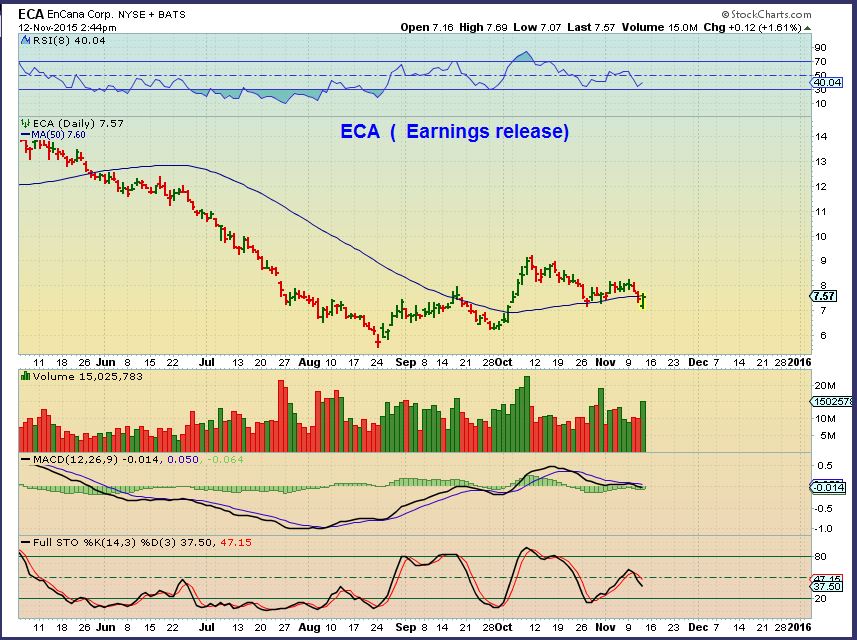 FRIDAY- ECA bursts higher As Oil sells off
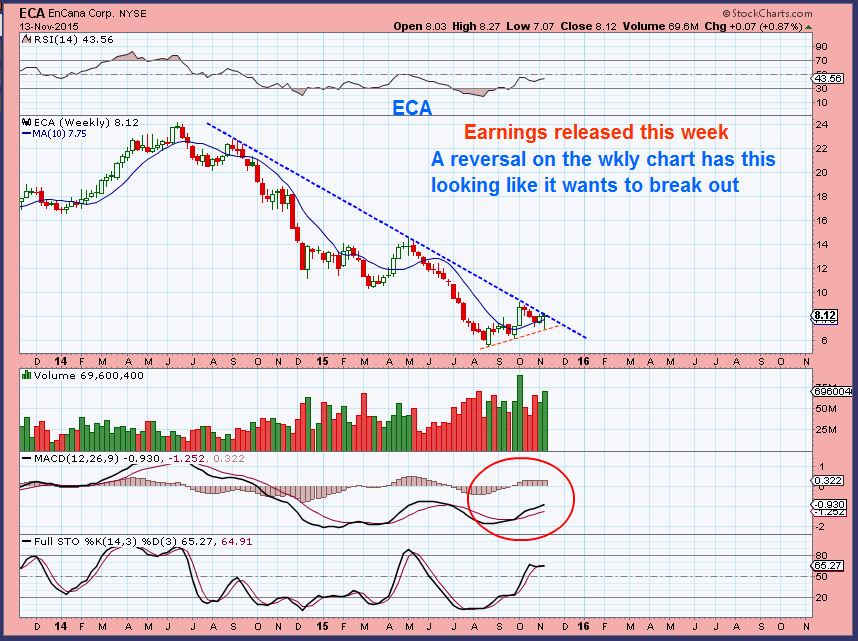
ECA WKLY – ANY HIGHER A WE SEE A BREAK OUT COMING?
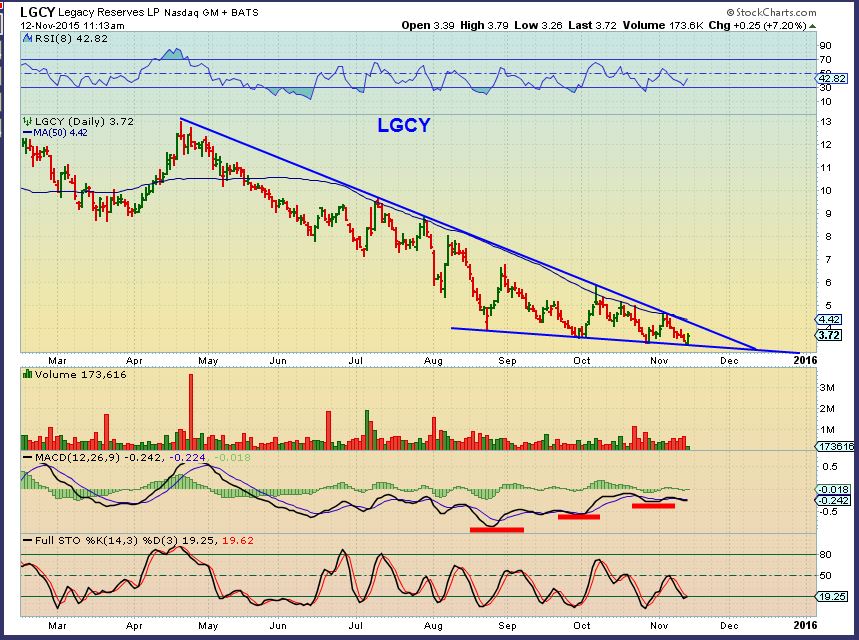
LGCY is in a squeeze play (looks bullish so far)
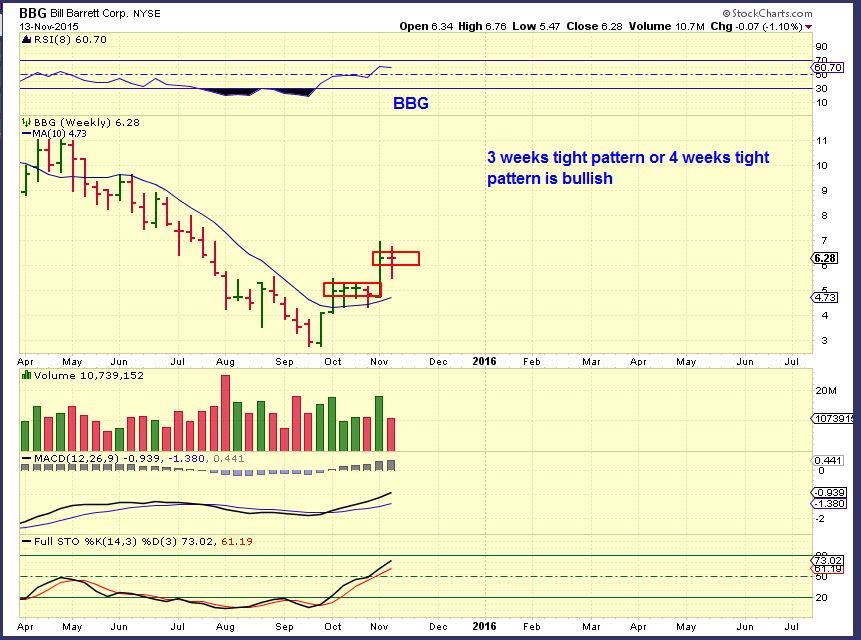
BBG Friday with Oil selling off.
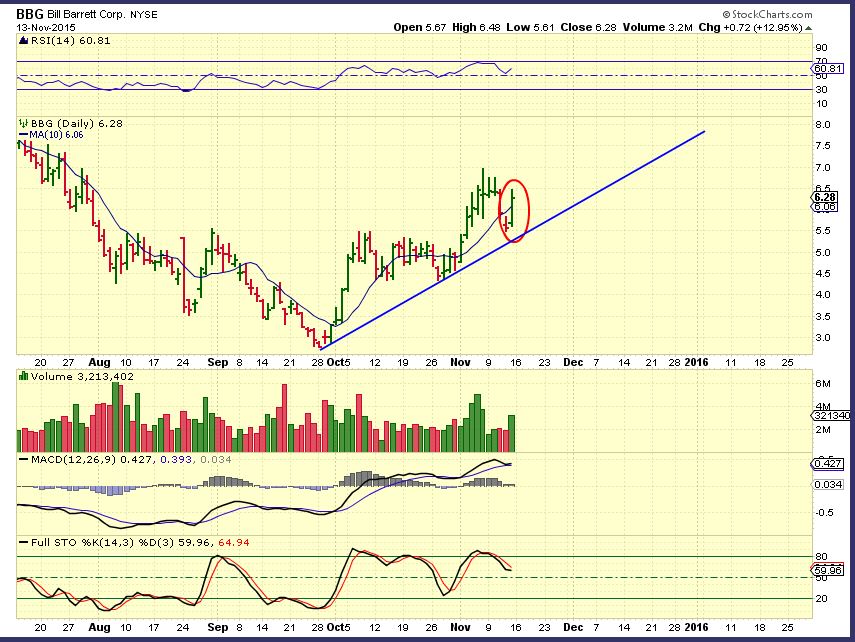
BBG WKLY
ERF – up almost 8% with the Friday Oil sell off
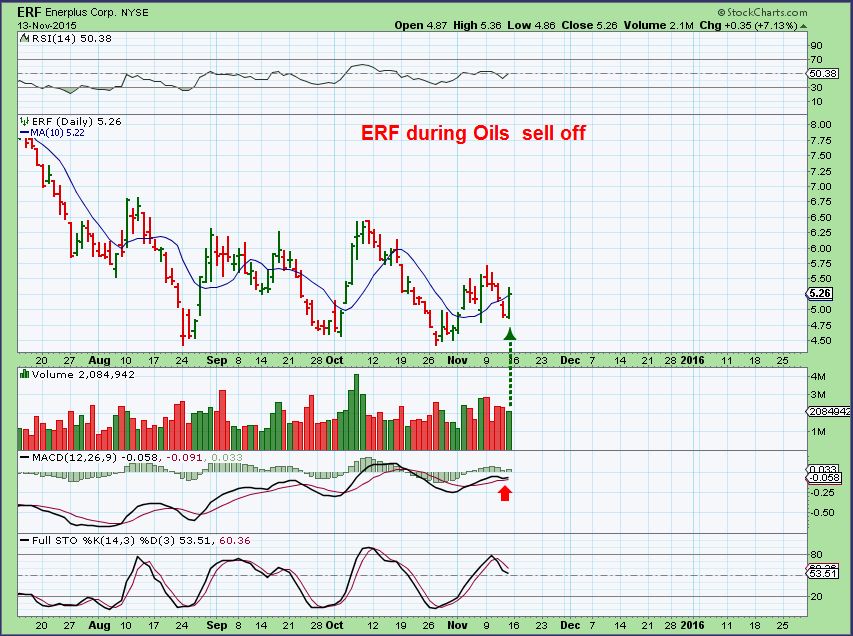
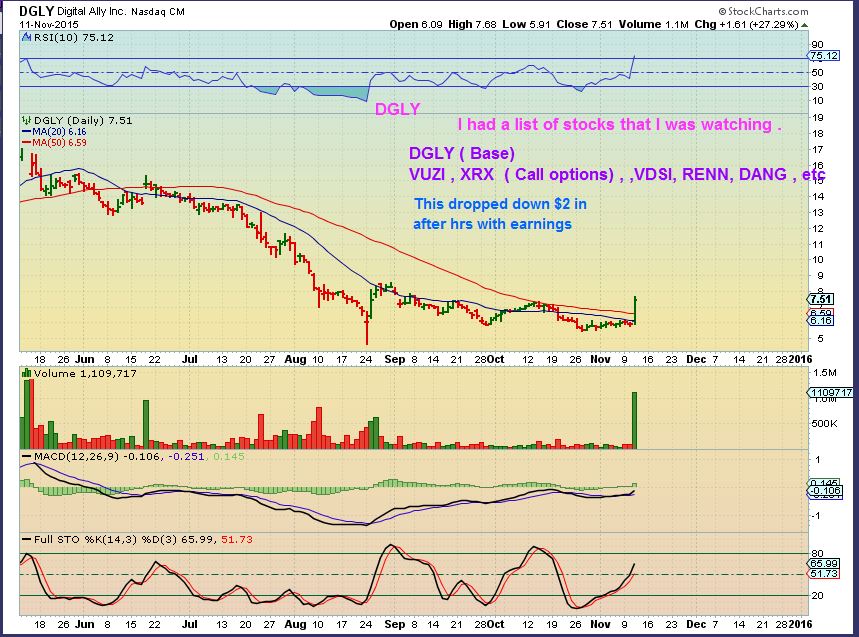
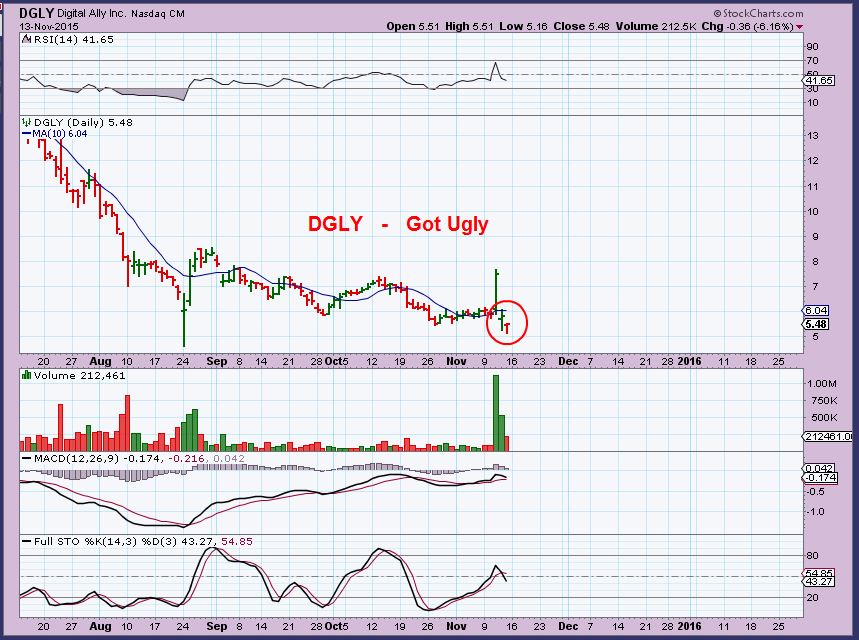
See also Fridays action for GST, SWN, AXAS, CJES, SGY, Nog , etc. We’ll have to allow time to resolve this issue, but they looked like “buys” reversing with OIL selling off. Even Bullish energy charts can get Ugly if the Oil Selling picks up. As an example , Look at DGLY ( Tech stock) with a nice break out Wednesday … And then the next 2 days. So Charts can fail if circumstances aren’t favorable.
GOLD, SILVER, & MINERS
So as we move forward into precious metals, we need to think about the possibilities based on what we have discussed above. If the Dollar is breaking out and continues higher, then Commodities, Oil and probably precious metals will succumb to what has been going on for the past few years. Higher Dollar, markets bullish and Commodities dropping ( This time to final lows).
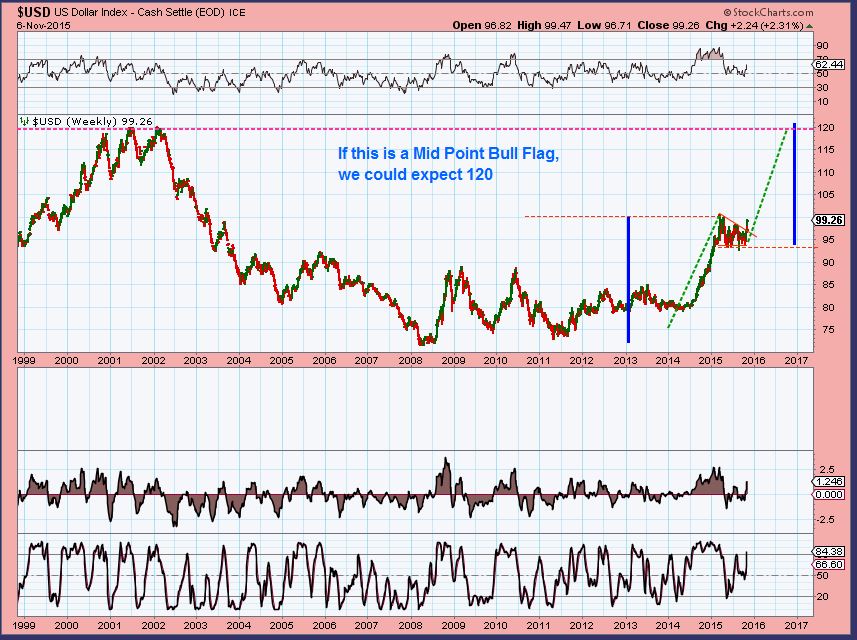
We could get a final flush if the dollar bursts higher in a parabolic fashion to 120, so I am going to show you a few charts of extreme example. I am not saying that this will happen, I really dont think that it will, but we need to view things big picture too.
USD – Lets say that the dollar has another leg up like this. It would equal the last 2 yrs to 120.
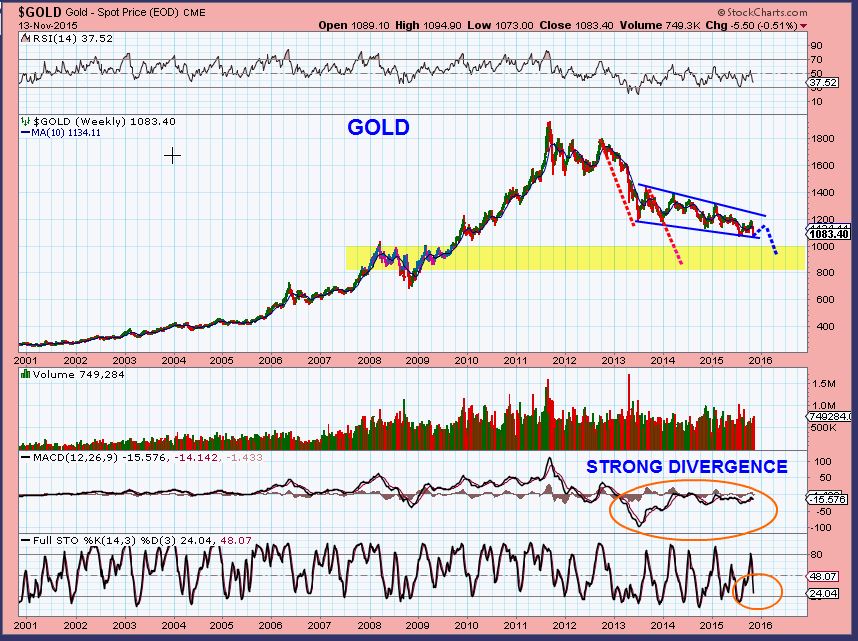
Gold could do something crazy like Flush out into next spring after a bounce now. It is not oversold on the wkly stochastics.
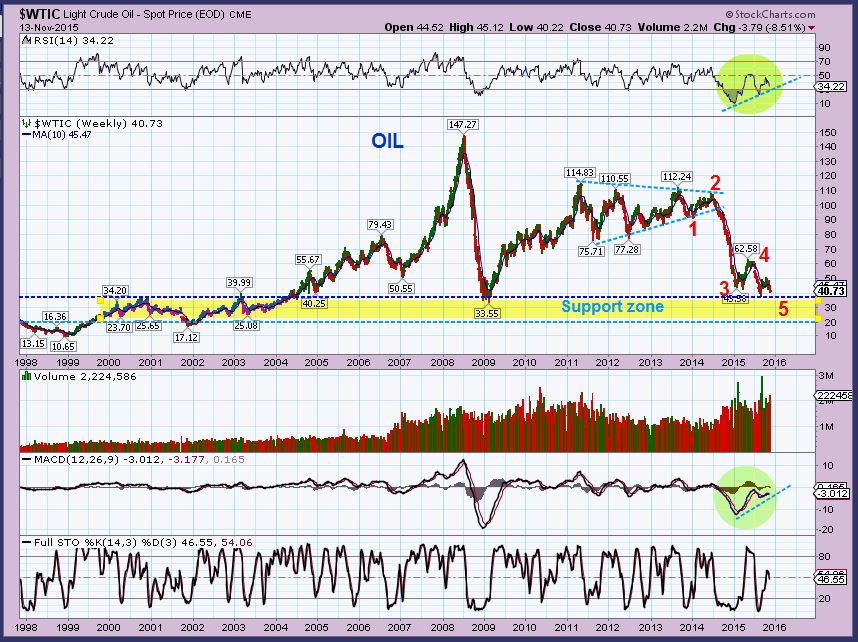
OILs big picture into next spring, seeking #5 into the support zone. That $26 number.
The CRB – It is at support now, but a break & recovery would not be out of the question if the Dollar surged.

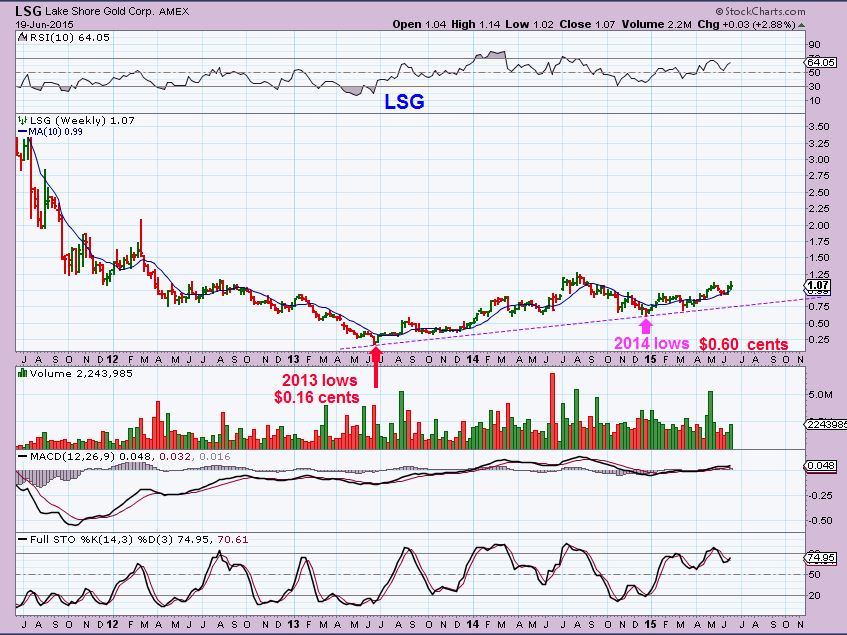
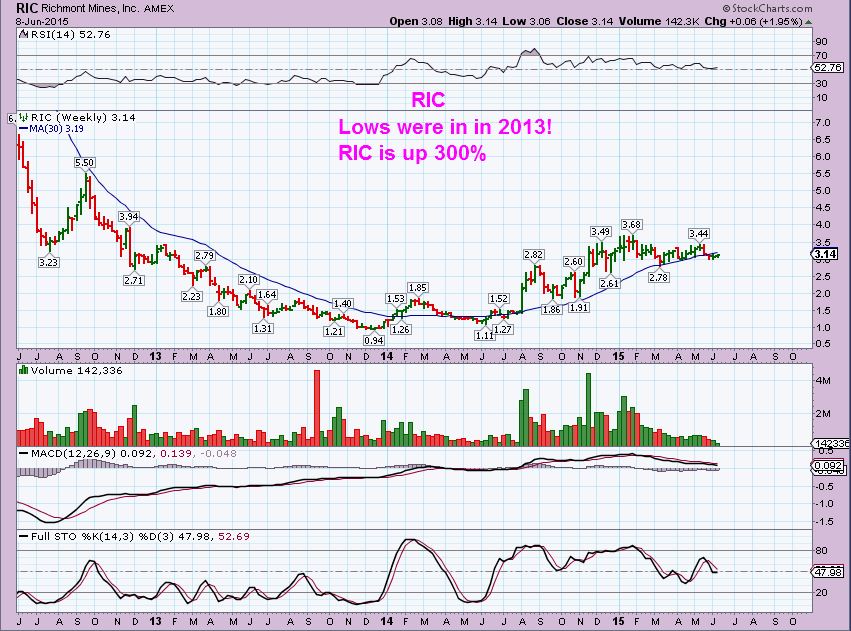
I am not so sure that the above BIG PICTURES are where we are heading. The Dollar could put in a false break out higher and drop with Fed Action in the next few months. This would lead to all other commodities mentioned probably putting in false break downs and recoveries. Currently , as mentioned in past reports, I see some Miners that have already put in bottoms. Look at 3 yr charts of RIC, LSG, MVG, NG, BAA, and a few others – they basically bottomed already. See below.
LSG – Lows seem to be in in 2013
RIC – 2013 lows
This is a point that I have brought out in the past: In the fall of 2000 , The HUI bottomed. Gold dropped further and bottomed in the spring of 2001, so its possible that we may be nearing a bottom in Miners, even if Gold is going to drop further. We’ll stay alert to several possibilities in this area and let the markets tell us what they want to do. I see bullish Miners now and GDX did not break recent lows.
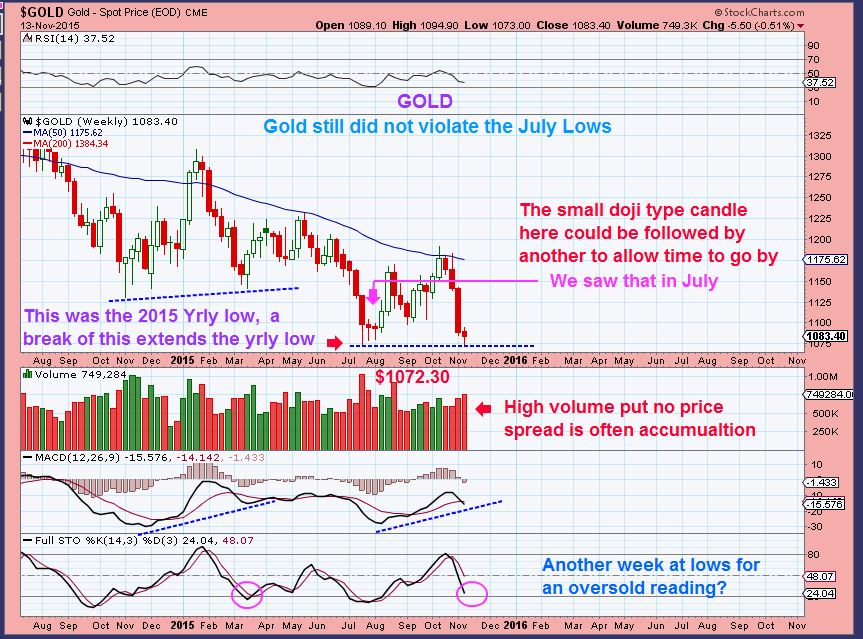
GOLD – Cycle-wise, In the short term Gold is due for a bounce. ICL or DCL ? It is difficult to say. I mentioned days ago (Chart below) that we may just go sideways like the last ICL, and so far we are.
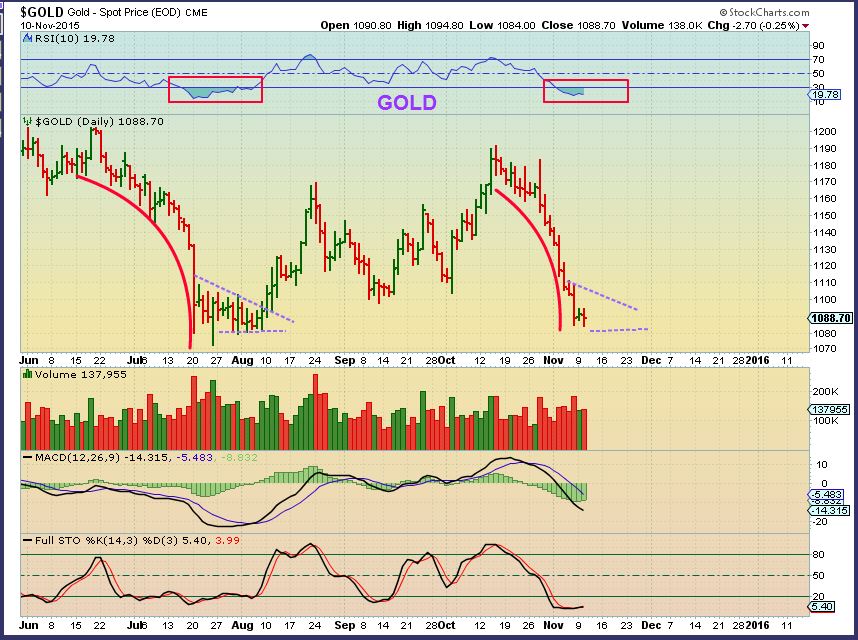
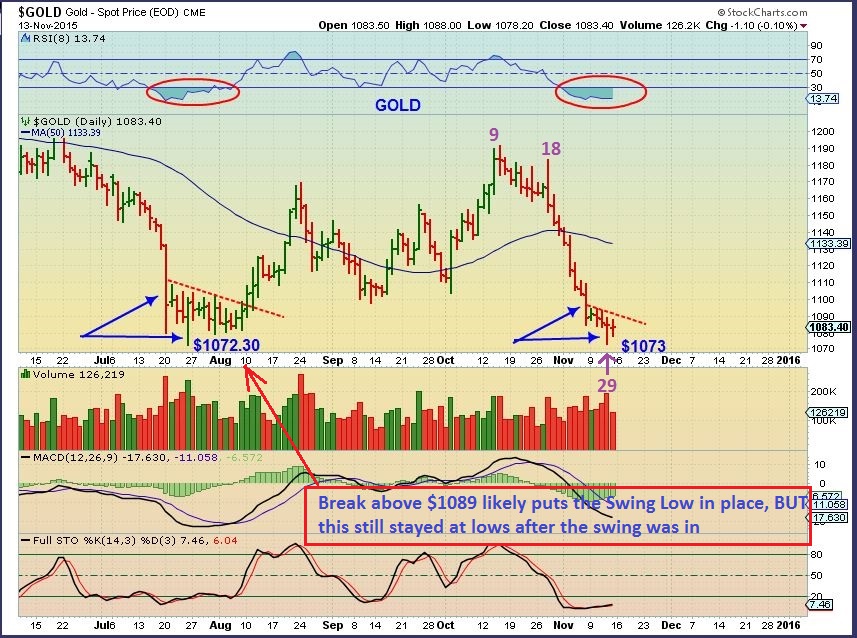
GOLD NOW – A new spike low just like July, and so far the July lows have not been taken out. A break above $1089 puts a swing low in on a daily basis. A move by gold above $1089 is setting up for a move higher ( but I noticed that this summer Gold continued sideways after a swing was in place).
GOLD WKLY – Also on NOV 10 I mentioned that if the selling slowed up on a wkly basis, we have a small candle to put a swing in.
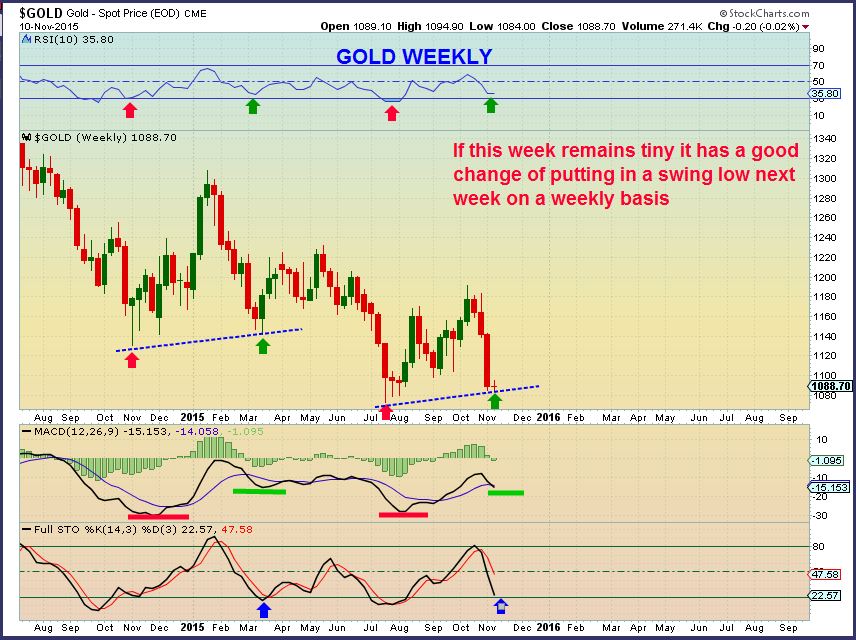
GOLD NOW – We got that small doji. In July we got a second week of small activity, so we could get that again, but at any rate a break above $1094.90 puts a wkly swing in place.
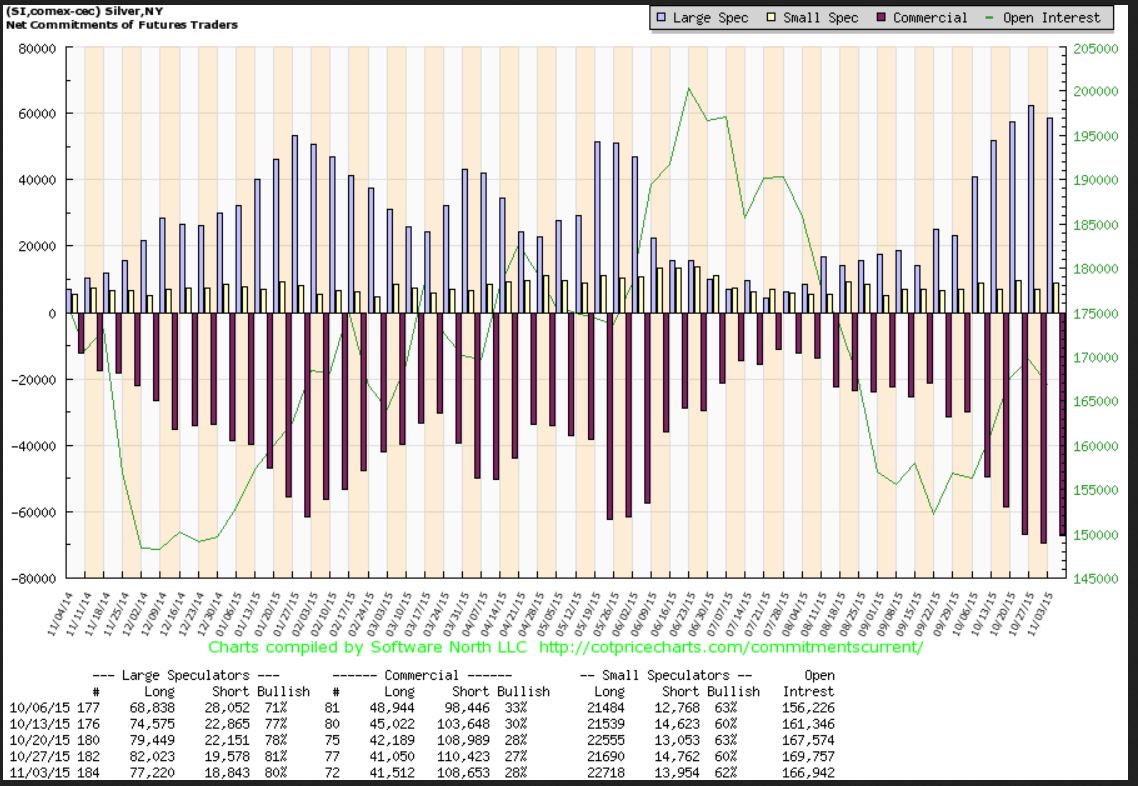
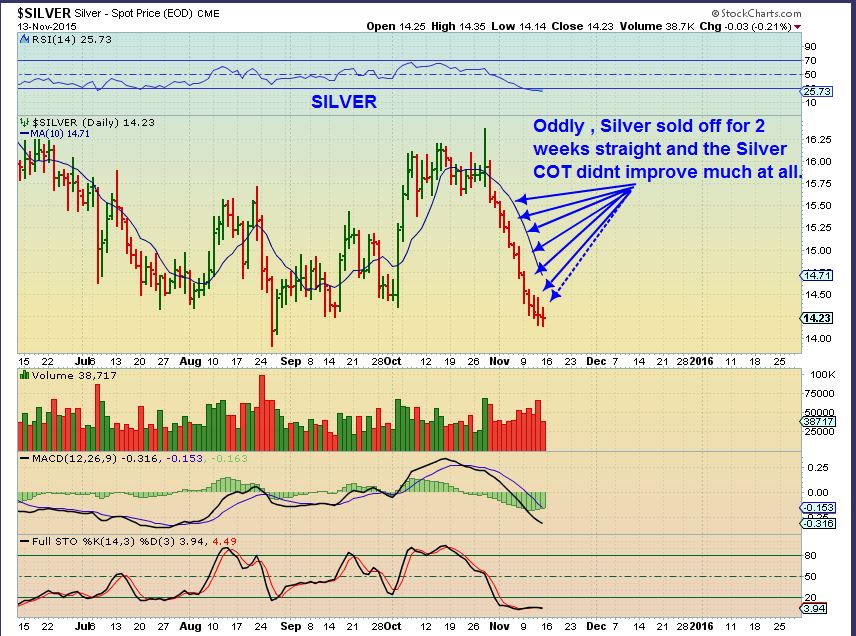
SILVER – Oddly the C.O.T didn’t improve much with the constant selling in Silver.
SILVER – Silver is due for a low and at least a bounce cycle wise.
What will the heavy shorts do if Silver bounces? Could that mean the smart money will be forced to close their longs in a short covering rally? Or is Silver going to really plunge and the commercials would add more shorts on any bounce?
Most would say that SILVERS COT is extremely bearish, but I have seen the Silver COT high at Lows before and the rally out of those lows was HUGE. They are hardly ever wrong, but they have been wrong. If the dollar does a fake break out & drops, Silver could rally here, but right now we take it at face value. Smart Money is short silver, but a bounce is due. We remain cautious.
.
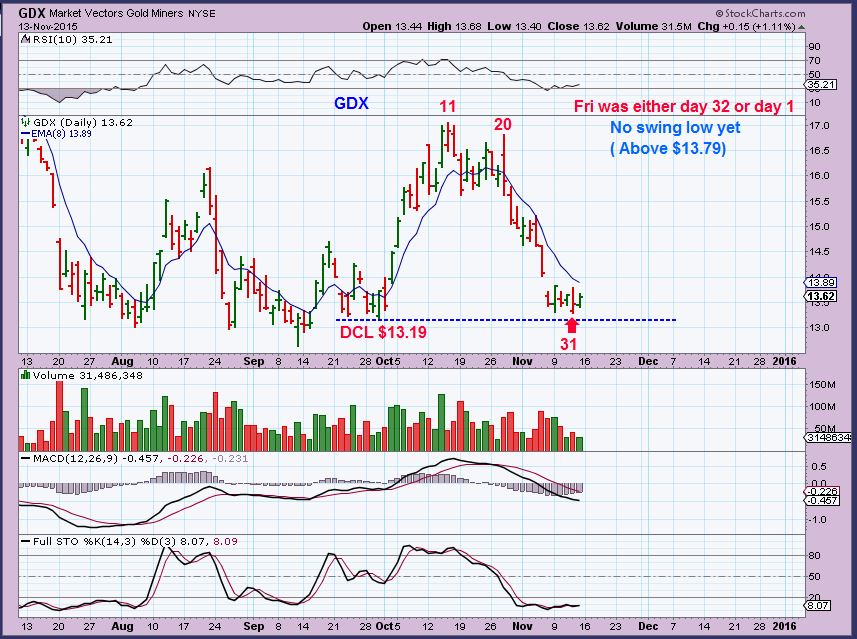
At ICL or DCL periods in the GDX, we can go sideways and linger at the lows before a run higher. I did point that out here, and that is what we are seeing.
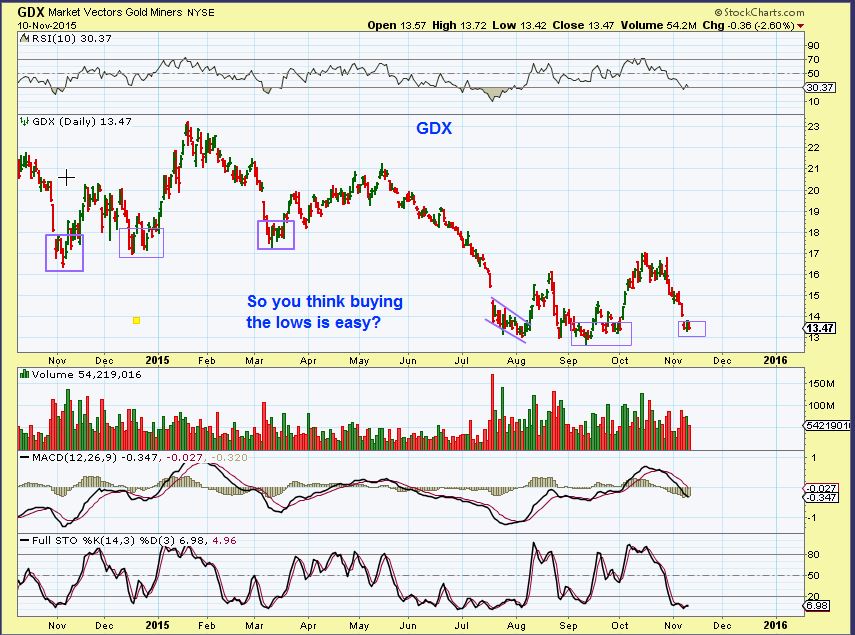
GDX NOW – Day 31 lows so far and the prior DCL has not be broken. A break above day 31 highs should be the daily cycle low ( Monday?).
AT this point I am just going to say this. The way that Precious Metals do or do not rally out of these lows will tell us if we have an ICL or a DCL in place. If we have a 4th Daily Cycle, it will be weak and probably roll over quickly after day 5? Maybe day 8? etc ( A good time to buy DUST) . Then we would drop and capitulate into an ICL weeks from now . However, If this is an ICL, I think the rally will be very fast and it may indicate that the Dollar is sniffing out a Rate hike in Dec that is not really coming. The Dollar could drop back down and Commodities would bottom and run higher.
I’m going to be watching this closely. We are seeing a mix of possibilities with all of the FED intervention. Cycles say that OIL and the CRB have failed and should make lower lows, but Energy stocks are holding up , even after earnings reports. GOLD has made a higher low from the July lows so far, and the Miners didnt even break down below the last daily cycle ( So that is short term bullish).
I hate to say ‘time will tell’, but at this point there are moves taking place that do not quite match up. For example again – Gold & SILVER sold off relentlessly day after day, but the GDX didnt even break recent lows. Look at these Miners charts, not very ugly at all and both have improved since these were captured on Nov 12.
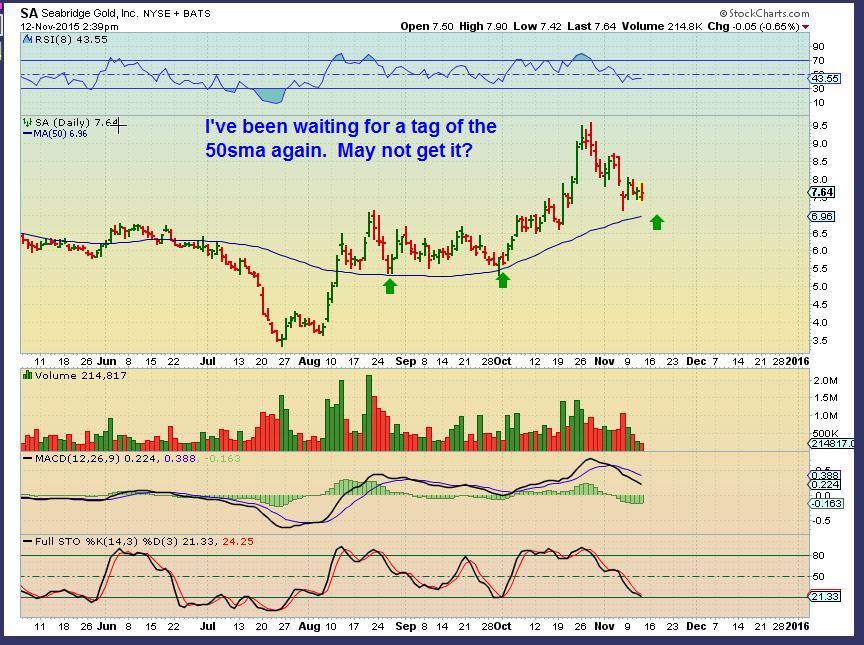
SA – I actually wanted to buy this and it went even higher.
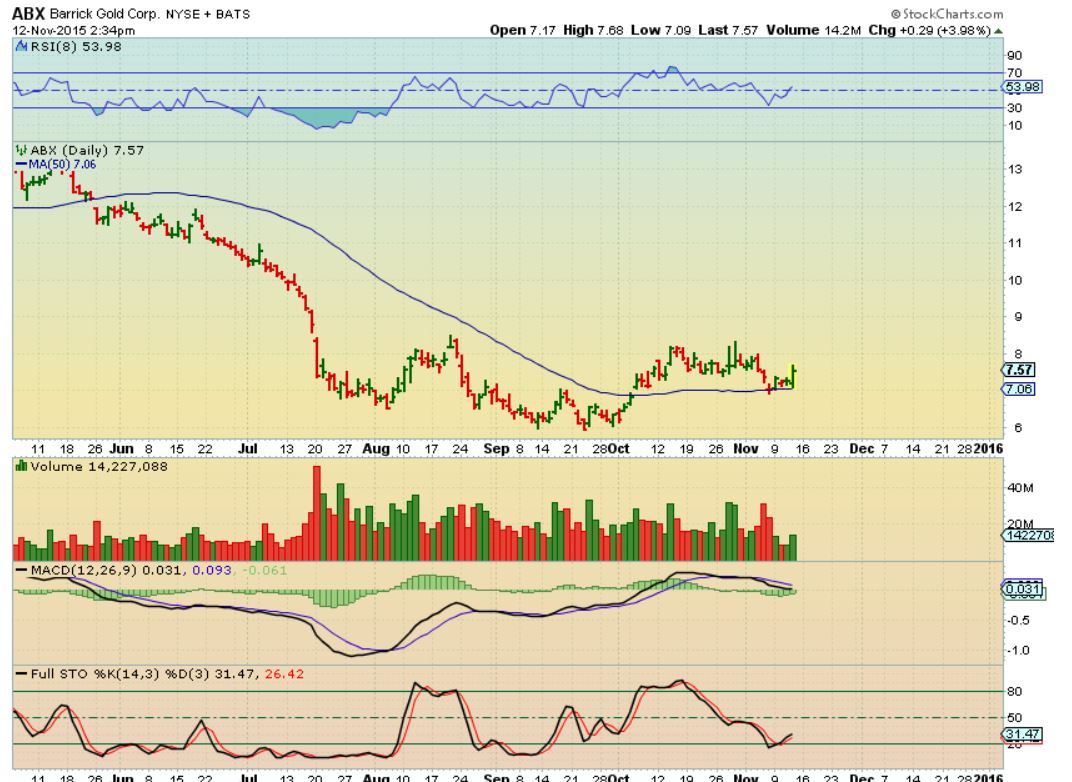
ABX – I owned this, but I sold it with the GOLD sell off. It looks fine.
I want to release this report Sunday night, so please read each section again to get a feel for what has been said. The markets may not pull back much more before a low and a bounce is put in place. Energy stocks acted bullishly, but OIL broke down (Odd). Gold & Silver sold off very rapidly, but Miners do not look bad at all, for reasons stated above. Some may just want to sit this one out and watch what happens for further clarity. Taking a trade in Energy or Miners at this point may have added risk if the bounce is just that, a bounce. For faster traders A quick trade with the idea that it may go either way after a few days could be taken, as long as you are ready to take profits quickly and then see what happens. The trades became more risky with the recent sell offs, but the charts in some Energy & Miner stocks remain ok. Its a little mix of Hot & Cold.
Best wishes, Well see what Monday has in store.
~ALEX
P.S. Please see charts of JWN, CSCO, FOSL, ROST, MOBI , JCP, M – These charts look a lot worse than many Energy and Miners. We might draw conclusions as to whether or not markets are weakening after the recent rally.


Alex,
I think you are looking at last weeks COT. Because of Veterns day the COT won’t be released until tomorrow.
That’s true. COT data is still as of November 3rd.
With that crazy selling in Silver I was expecting a big drop, when I looked up the COT I was absolutely baffled and thought that they must be expecting a huge crash – lol. Totally forgot about the holiday since the markets were open on Wednesday.
That makes sense…I forgot about the holiday, because the markets are open.
hi Alex,
what do you exactly mean with this ?
the 10 m is curling up already ? in your long term monthly chart with 10 ma and 20 monthly ma
Hi Ray
In the long term chart for the SPX, I had pointed out this summer that in prior crashes that turned the markets into bear markets, the 10MA on a monthly crossed below the 20MA ( Where I wrote ‘short’ on that chart. So I have been watching to see if we get that 10MA crossing DOWN Below the 20MA. Instead, we see that “The 10MA is curling up already”, and not down below the 20 MA.
Does that make sense now?
Hi
ok got it,
it’s just that the s&p is under the 10 month ma like most intl indexes – even in euro
exeption only the nas100 and ireland are above the naz is right on it
so you can say that the strong makrets are holding on, where the others are weaker and much lower
how long will strong stay strong?
Thats why I wrote what I wrote above that SPX MONTHLY CHART . As a monthly chart, you basically have to see what happens at the end of a Month. It was a recovery as of the end of OCT. It can dip down and close above again in Nov, or it can give it up.
I continue to like Nat gas here, think the full bearish side is priced in at this point. I’ve said it before but on the fundamental front, this is MUCH more isolated from FED rate risk than gold or oil. Consider that when trading commodities over next few weeks. 🙂
Long term is more 10 than 20… Refresh
Which has been one of my recent theories, that natgas got thrown out of the window with the recent oil disaster. Punished by big sister. If it starts to trade on its own merits and there is any good news at all, should be all right.
wow.. crazy good report; fabulouso breadth and depth …….:-)
Happy Monday ALL ………………………….
back to work now
Thx Maria, hope you had a good weekend. 🙂
Happy Monday Maria!
Wow, Check out CLVS
OUCH!!
Big volume coming in now.
I couldn’t really find the news ( It must be something, down 70%).
http://www.forbes.com/sites/jakeking/2015/11/16/clovis-drops-2-billion-in-market-value-on-drug-setback/?utm_campaign=yahootix&partner=yahootix
Thanks, I did see the news about AstraZeneca, but I couldn’t find this anywhere I looked.
70% down, crazy.
This has to be the 4th DC for GDX, no power at all.
Explain a bit more Bill, if you want.
Thank-you.
Maybe , but I wouldnt go short without proof.
I seem to recall everyone saying that in July too.
“Weak sauce” ” No Buyers” Gold would pop & drop repeatedly, then it took off higher on maybe day 10 after the lows were in. So far the lows in Gold were 2 days ago.
Just a friendly word of caution
All a matter of perspective. If I was in, esp. in JNUG or NUGT, I’d be disgusted. But not being in and watching, am like, hey they are really holding up, might be able to accumulate at each little pullback. Totally just dependent on how you look at it.
Since 0900 (GMT) I’ve seen crude up 2.5% then down 1.5% and now up 1.8%. That level of volatility could suggest a bottoming? All the while Euro has been weak and is at weakest for the day just now (13.11 ET)
XLE and many energy stocks look pretty good today, but I dont trust them for anything more than a scalp trade at this point.
woop…
Have you seen the oil Vix? It was over 45 today. Just been incredibly high recently. Like I posted over the weekend, can you imagine gold moving down 8% in a week?
A perfect 78.65 retracement of USOIL and now moving higher! Hmmmmm
yeahhhh.. funny how that works…
Completed the AB=CD as well, perfectly…..
Bullish Engulfing candle Oil (USO)……if interested. 🙂
RSI bullish turn also.
Will it have some follow thru ???
OIL On an hrly chart had a strong move from around 11 a.m. (Eastern) and looks to be breaking from the down trending channel too.
arex poppin nicely
So many of these charts look like good bases on a 4 month or so.
It kind of has a lower trend line too
Yes, Oil looked real good today. I expected a little more down side, but I’m not fighting it. I went long oil and miners Today.
Good luck, Bill. I’m sure this will work out for you. I’m long a bit in energy stocks. My USO is pretty much worthless at this point, though. 🙁
ken
are u still counting like this? (sorry HK is a chart i have up now – but im showing this but MANY are the same…
https://www.tradingview.com/x/F0scPLNw/
Yes.
If we break your (5) / (v) we’d be wrong ….. 🙂
Risk reward pretty good IMHO…..especially with all the unfortunite negative geopolitical issues going on in the world. Sigh.
But OIL broke the 5 didnt it? So you are just using this count on your energy stocks?
If WTIC breaks 37.75 it will unless I am missing something ?
lol.. jinx
O boy not good ! 🙂
no… 37.73 is my beginning count for “1” therefore the invalidation point
Thx
something like this .. https://www.tradingview.com/x/PTbbXVSA/
that is what i am watching.. (not playing)
tho… still hold my energy plays in my swing acct… they all look good.
Gotcha
That was one rough (V) of 2. Some serious ouch last two weeks. Ugh.
exactly… tx 🙂
Many of the energy stocks look good, but some have weak volume.
BTE is a good example of what I like to see ( see a 3 month chart with volume)
BTE & VOC…those charts really do look bullish.
Does BTE actually have a yield of 33.48% ? It does according to Morningstar.
I do not know, but ask me an easy question like,
” Didnt you buy CRK and CJES where they are now 2x in the last 2 months, and sell them here too?”
And I could say, “Yes, should I try it again? 3rd times a charm?” 🙂
LOL !!!
Been there !
VOC has a 12% yield with very good financials. Hmmmmm……..
BTE on the other hand …………
My only issue with VOC is the volume 🙁
ECA chart looks good too
Agree.
REXX is coming fresh off the bottom ( sort of looks like a 2 month triangle type of a set up , that may break out or hold it down).
LGCY TOO
SPX possible HCL Alex ?
I thought maybe DCL
Early DCL then on day 35 ?
Actually it is within the normal timing. I think the last daily cycle was only 25 days ( I’d have to go back & count, but from memory I think it was short).
It was and last Friday then was Day 32.
Also within normal timing but early also ? If so……two early DCL’s in a row what would this tell us………the third being long?
Often it does work that way. Kind of like the theory of alternation.
( Did I say that correctly? that doesn’t quite sound right, but I’m a bit tired after this weekend 🙂
lol.. who are u and what did u do with chartfreak?
No, Just stretched myself out busy busy busy- burning the candle at both ends. Family Dinners, a little Football, long report, running around, etc etc etc .
u need a gazebo & hot tub… solves all that ails ;o)
although wine can also be added to the equation ….
Not to mention a Sauna !
ooo.. now that WOULD be a nice ‘add’ … but then I’d just be spoiled….
I do luv me some sweat…..
Me too. 😉
https://uploads.disquscdn.com/images/457cee2b5add6b30a166f949593579a0d6246350c763920f61a4706b04c400a4.jpg
🙂
Speaking of Football……May Andy Dalton have a game of his life tonight !
Based on one of my weekly teams. 🙂 (draft kings)
Not terrible, but certainly not a game of his life right now. Should be enough for me to win this week, though (regular league).
did we play a little too hard…?
law of alternation
Is a 57 day DCL within normal timing range or too long ?
I see where you are going with this Mr. !/2 Cycle 🙂
Normal is somewhat in the range of 30 to 45
🙂
Correction …… Day 32
Bullish Engulfing also. Hmmmmm…….
wow.. uwti had a $1 range today…?
LNG broke out today
FWIW…….
Starting to build a position on Nasq. in case we had a DCL last Friday.
RSI and Wm% confirming.
I shorted volatility Friday. Worked out today, at least.
Is GDX in a base formation or a bear flag in your opinion Alex?
it COULD quickly drop to new lows, but …
I would guess, based on cycles, that it is doing a base (Similar to last July- Aug),
Check it out with an 8 EMA. Somewhat similar to the end of last July
Yep gotcha