
Nov 22 Weekend Report
With the release of the Fed Minutes Wednesday, we got a good amount of action in the markets this week. Lets review sector by sector.
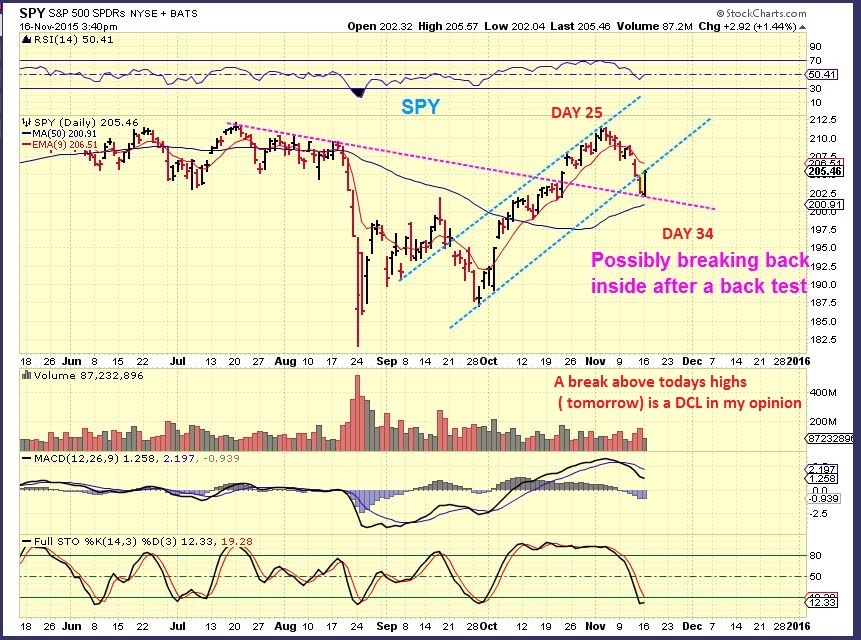
The SPY – On Nov 16, with a day 25 high in place, I expected a bullish break higher and a DCL to be put in place.
SPX Nov 18 – This was a bullish break out back above the 200sma.
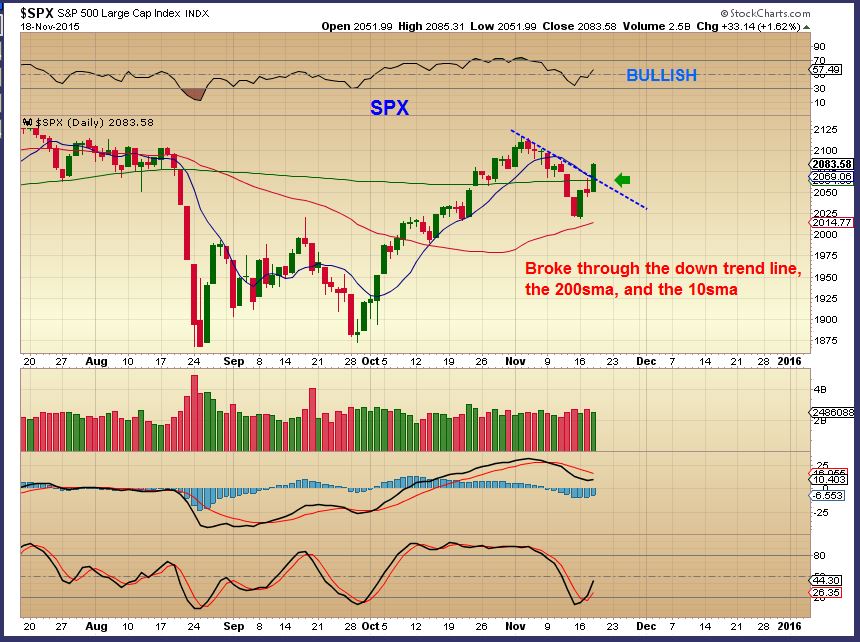
That was follow through after the release of the fed minutes. What can we expect?
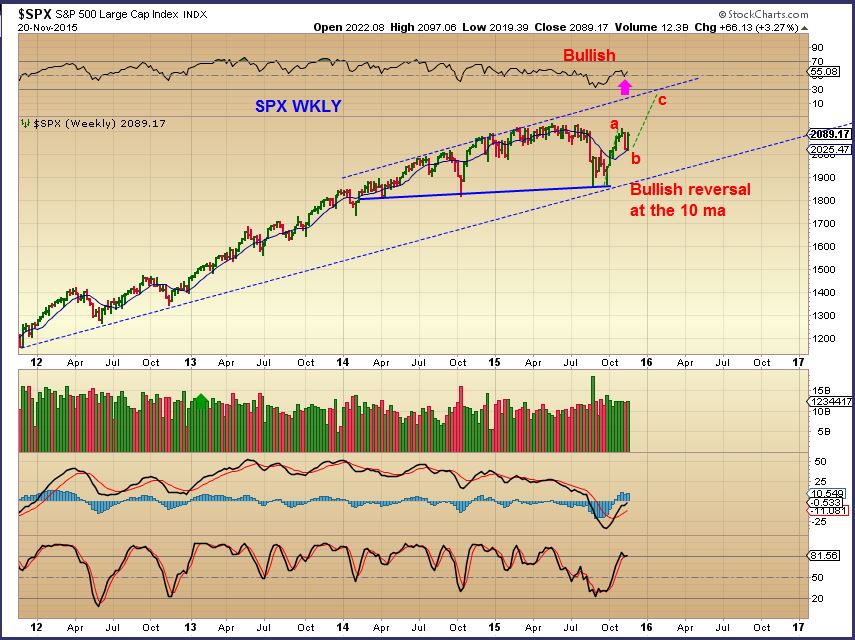
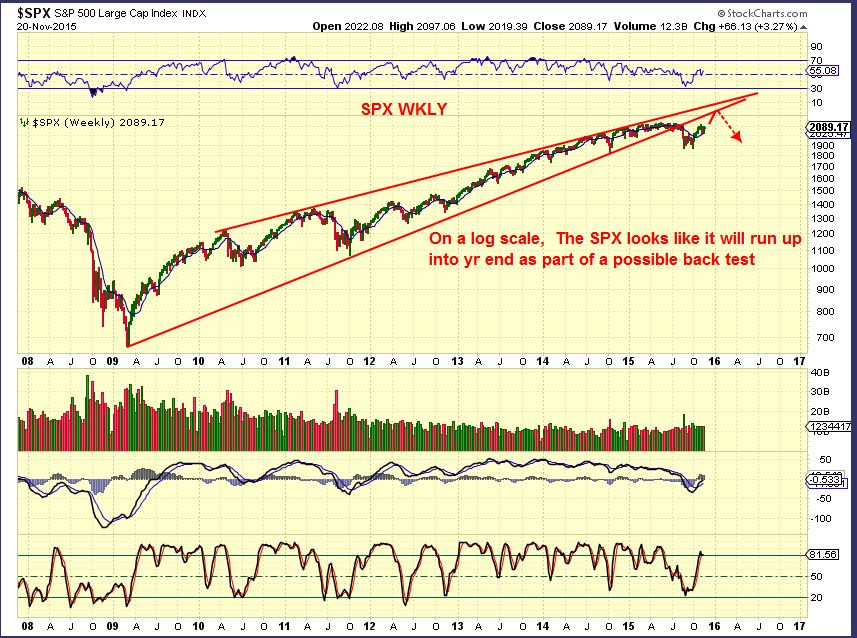
The SPX WKLY – Looks Bullish too, it held the 10ma.
That is a bullish set up and as I pointed out in last weeks report, there are bullish set ups in various stocks too. I want to recommend caution too, because some stocks that missed on earnings got hammered ruthlessly. Check for earnings release if you own individual stocks. ( See retailers JWN, FOSL, JCP, etc). If you dont want individual stocks, you can by the SPY, QQQ, etc. or …
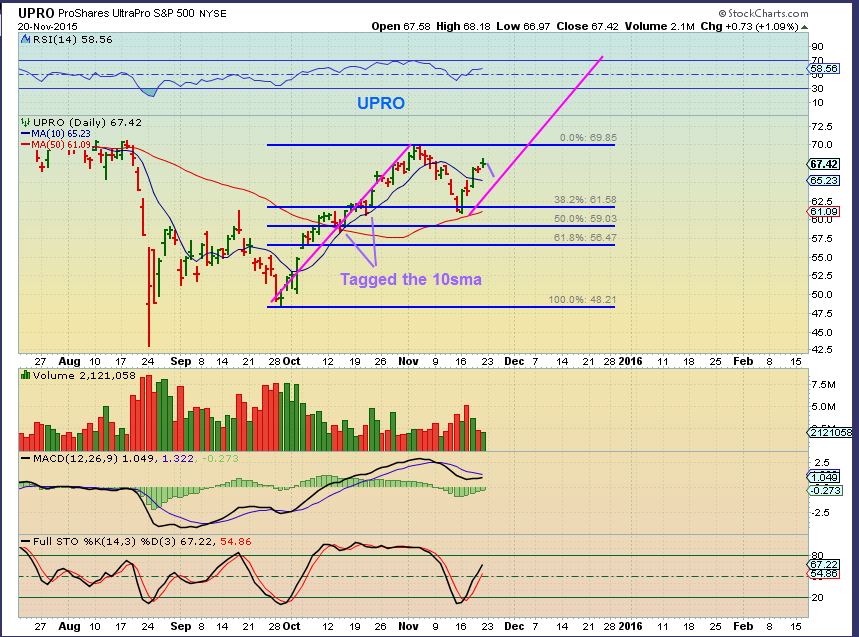
UPRO ( or TQQQ for NAZ) is a slightly leveraged ETF for the SPX . On the last run higher, it tagged the 10sma a few times. I would buy it at a tag of the 10sma or take a position and use the 10sma as an area to put a stop under. As a trader: When I look at this chart ( or TQQQ) I think that the MACD is saying to wait for a pullback to the 10sma.
I want to step back to a longer term view. I’ll be watching for a back test and negative divergence? Or a break higher into possibly a parabolic top in 2016?
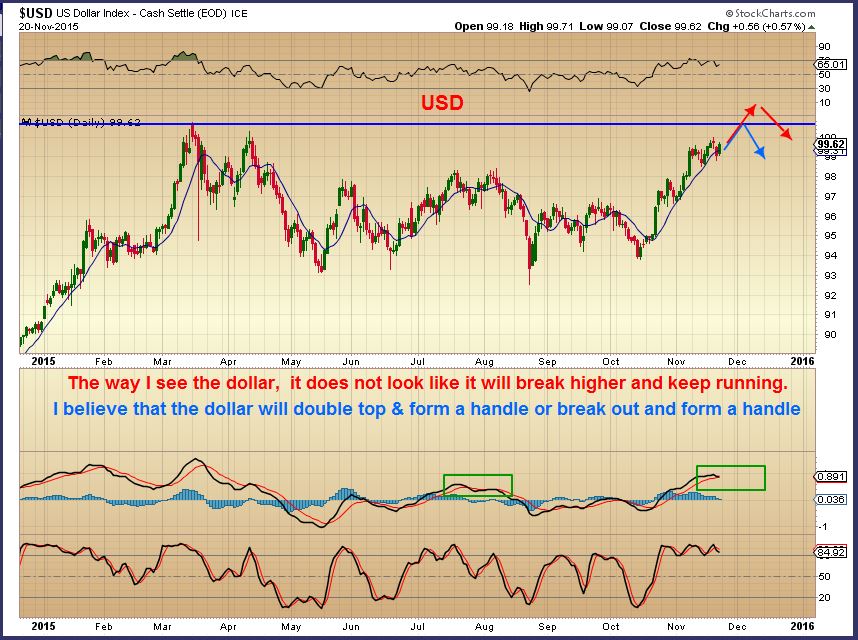
USD – I think that the dollar is going to stall and possibly put in a higher double top or a ‘handle’ after moving higher. The March highs are at $100.71. Cycle wise we could roll over into an ICL with the next daily cycle . Gold could benefit from a pause or drop in the dollar.
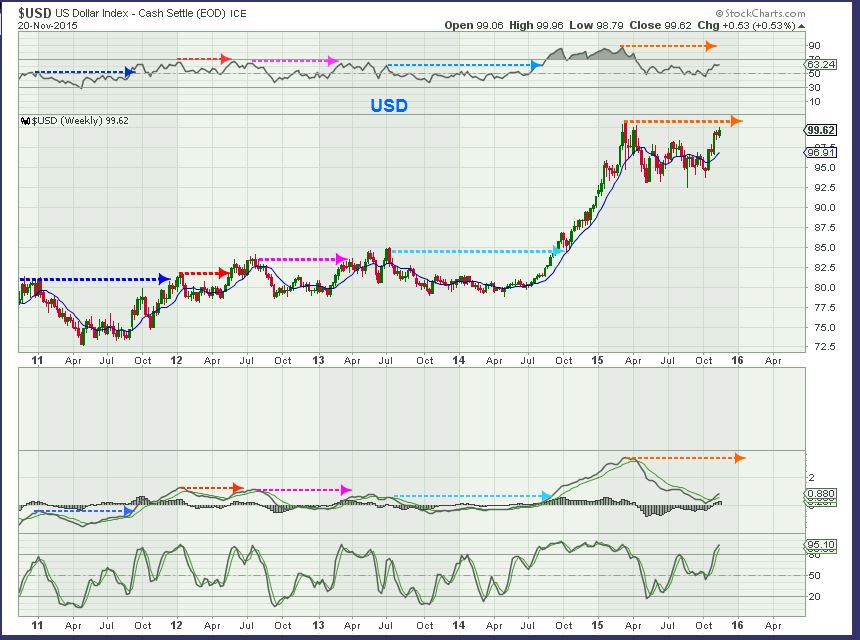
I look at the USD WKLY like this. The MACD has reset and can move a lot higher again, but after consolidations in the past , when prior highs were reached the dollar often paused & dropped. It matches cycle timing.
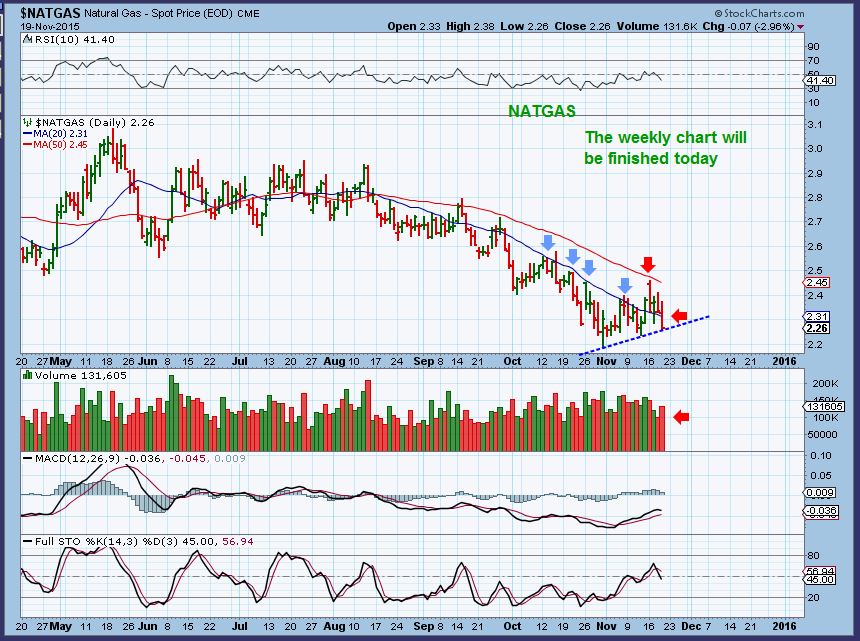
NATGAS – NATGAS fell apart. I had posted a wkly chart Wed and mentioned my concerns going into the weeks end. The WKLY CHART was not quite correct. This chart Thursday also mentioned that it needed to be watched, it was breaking down on heavier volume.
I only have 1 thing that I want to say about NATGAS at this point.
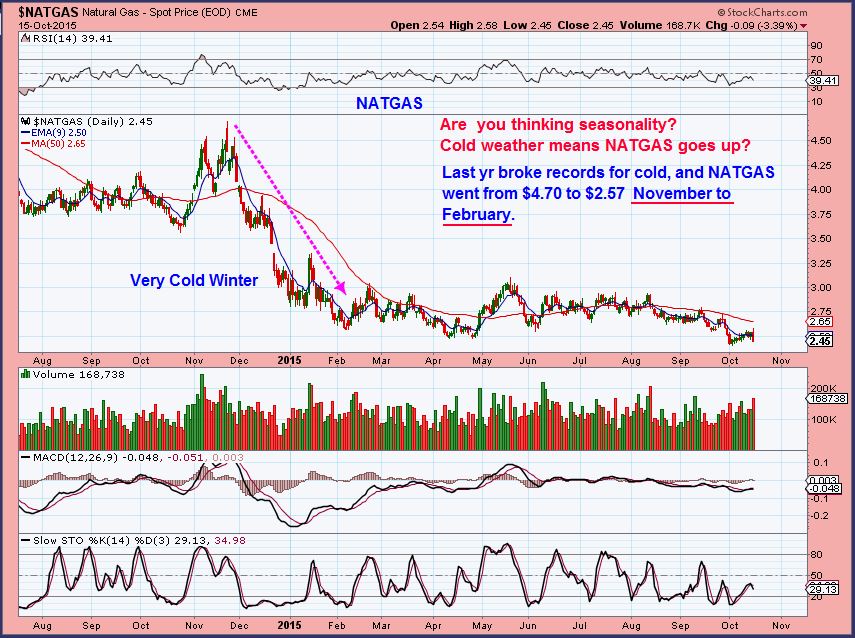
I keep hearing in the trading blogs ” Cold weather is coming, Natgas goes up in the winter. THAT is why I am adding on the dips.” DO NOT go long based on that. I drew this chart in October to point out that that is not always true. I live in New England and Last year we had record breaking snow fall in North America and temperatures in the single digits and sub zero repeatedly. Week after week we had 2 snow storms of 12-24 inches per week . Look at NATGAS last year. Nov to Feb is when NATGAS fell. Peak cold weather in a winter with record cold across the U.S. , and NATGAS dropped.
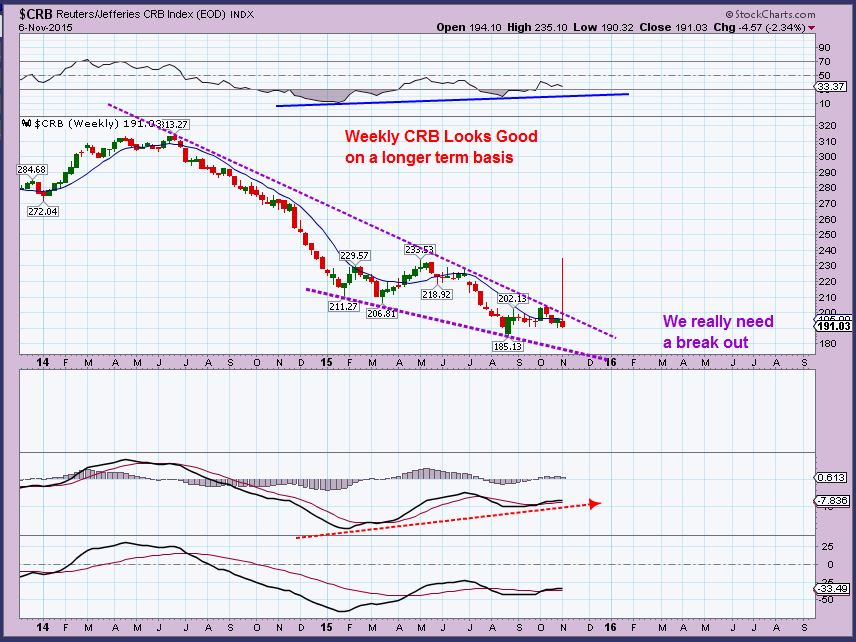
CRB – 2 weeks ago I posted this . We needed a break out as we approached resistance. The CRB is in a downward sloping wedge. Divergence looks good for the Longer term. We needed a break out because we were pushing Resistance.
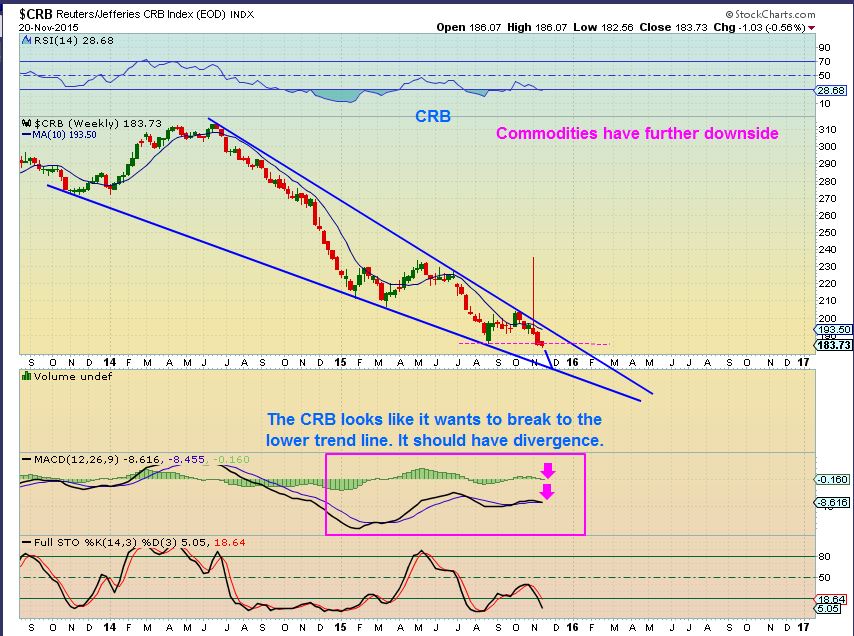
Update – No break out and now a break down. There is good divergence for the longer term outlook, but commodities have yet to find their lows.
Oil is a big part of that. I have been showing that OIL is bearish now. Here is another area where I keep hearing that COLD WEATHER IS COMING, I’m hearing people buying the bounces and saying that Oil has bottomed again. In my analysis? OIL will go lower. Lets review.
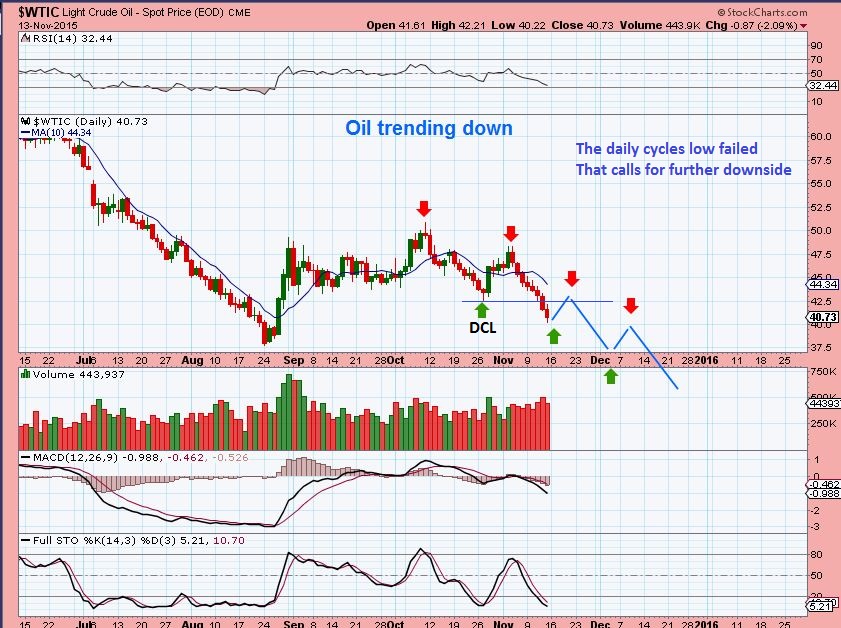
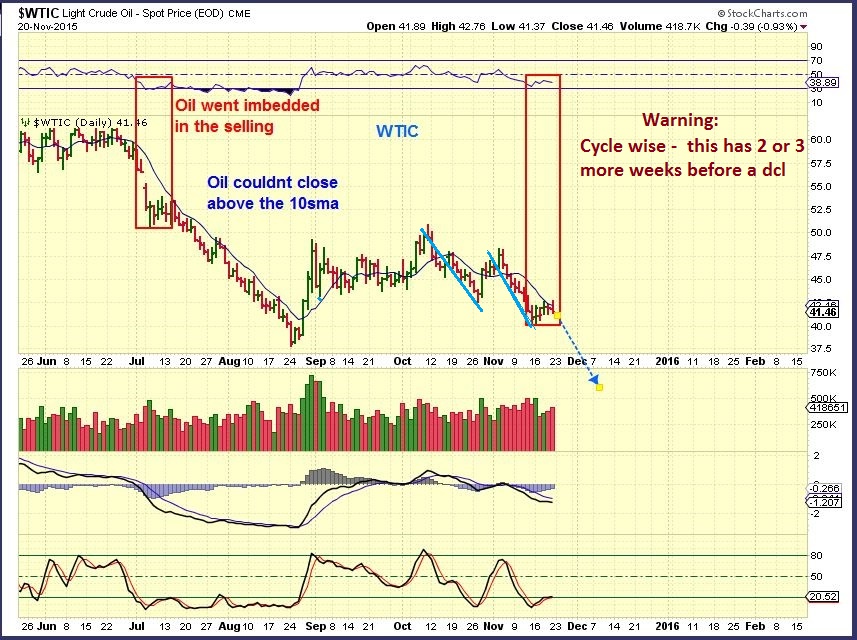
On NOV 12 OIL FAILED at $42.50 early in the daily cycle. It was VERY EARLY, since Oils daily cycles can go on for 40 to 50 days! This chart shows that NOV 13 there was follow through downside. I called for a stairway down going forward.
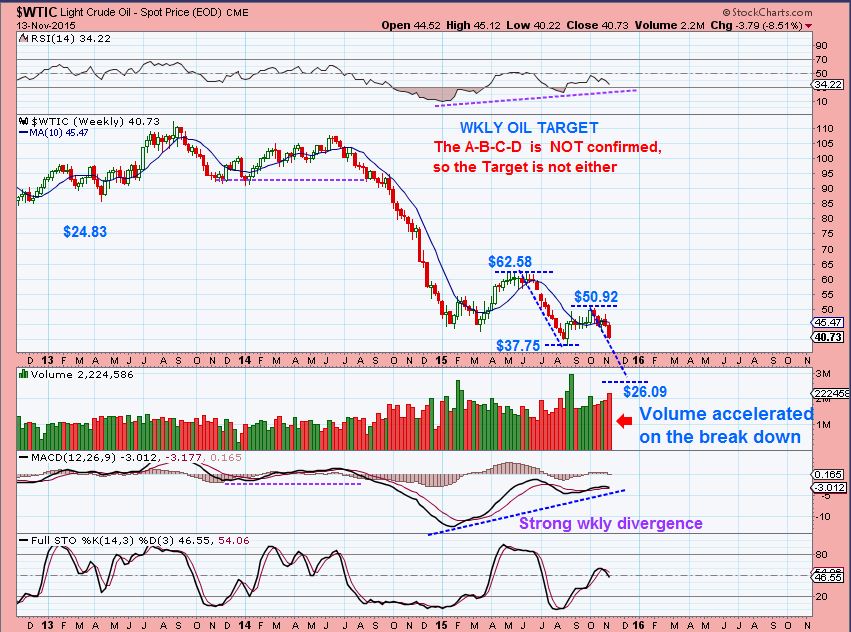
I posted a possible target of $26.09 on a wkly chart IF an A-B-C-D becomes confirmed. Volume selling was getting heavy too.
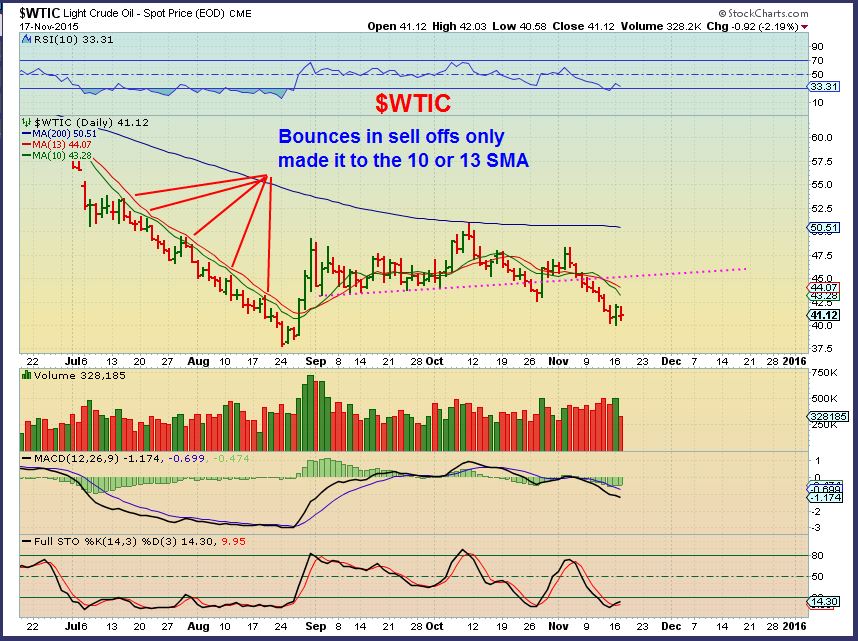
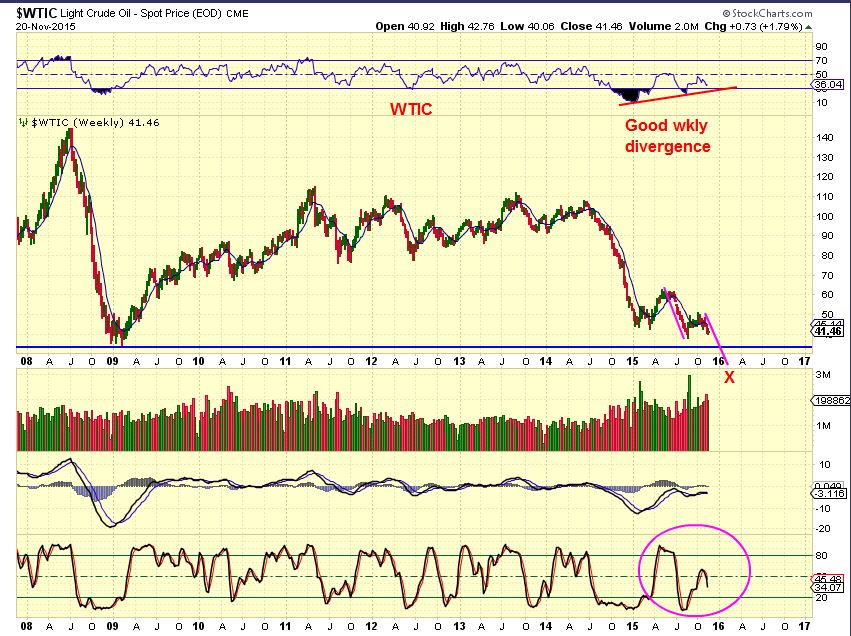
WTIC – Nov 17 – I pointed out that the 10 & 13 sma is resistance ( You could ‘short’ there using SCO , but I wouldn’t go long without strong proof that something changed). I thought that Oil could bounce toward the 10sma and the magenta trend line.
WTIC — Price only went sideways was rejected at the 13 sma Friday. Oil may bounce around sideways, but I expect it to drop lower, not run higher.
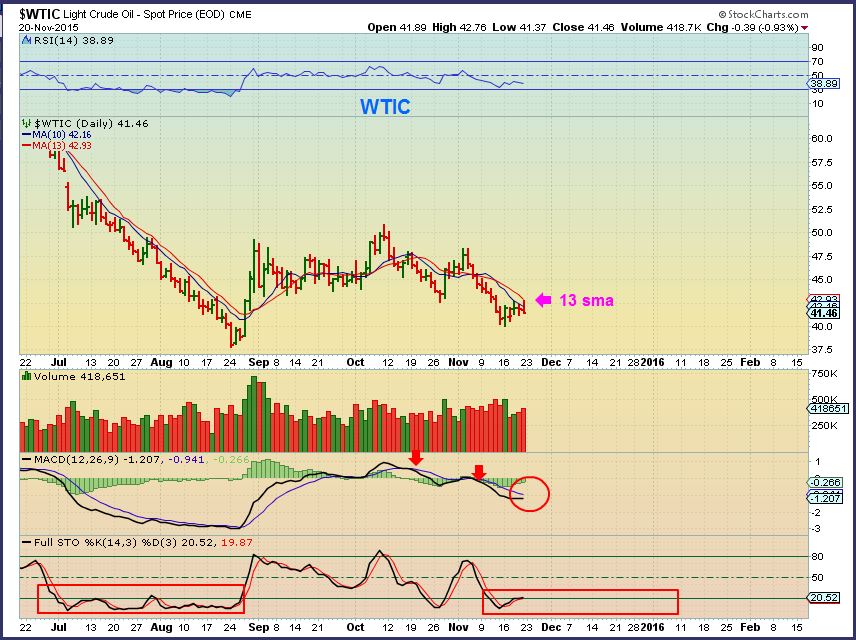
OIL – Weeks of downside possible.
WTIC WKLY – The current view shows a stochastics with plenty of room to drop if this gets going. Divergence indicates that the next low could be THE LOWS. Some energy stocks are being accumulated despite the drop as further evidence of this.
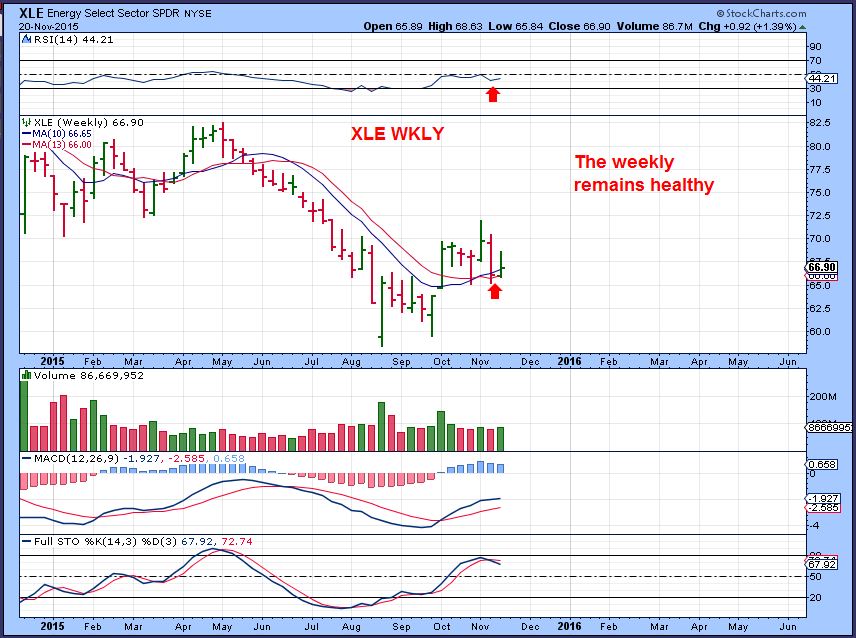
XLE WKLY – Oddly this has held up very well, despite OIL & NATGAS sell offs. It still looks fine, but I am cautious with the daily chart.
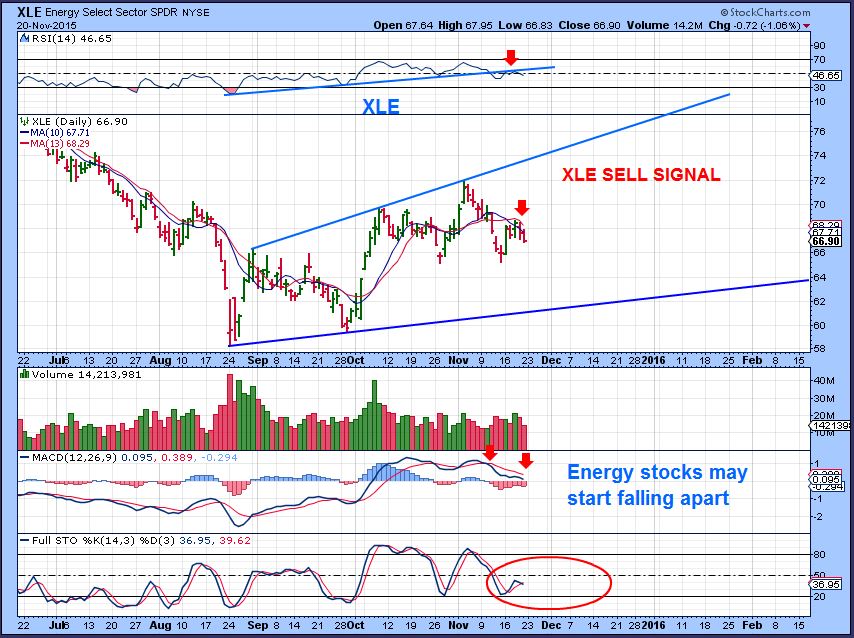
XLE – Energy stocks have held up well, but I now think that weaker ones may start falling apart now. The daily chart is weakening so this is a short term XLE sell to me if it breaks the 50sma (not shown, sorry).
.
GOLD , SILVER, & MINERS
At this point, I think that we saw a DCL in Precious metals and miners. It is a possible ICL as mentioned in past reports. It will take time to know for sure. Lets review.
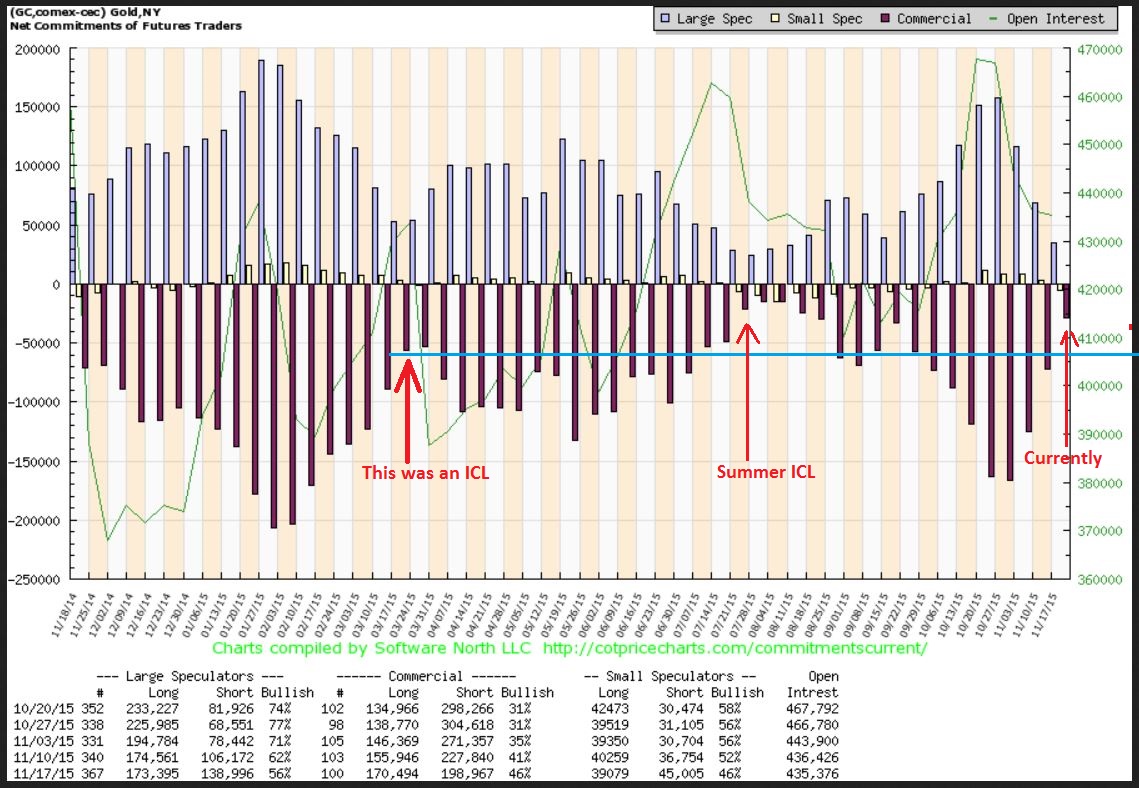
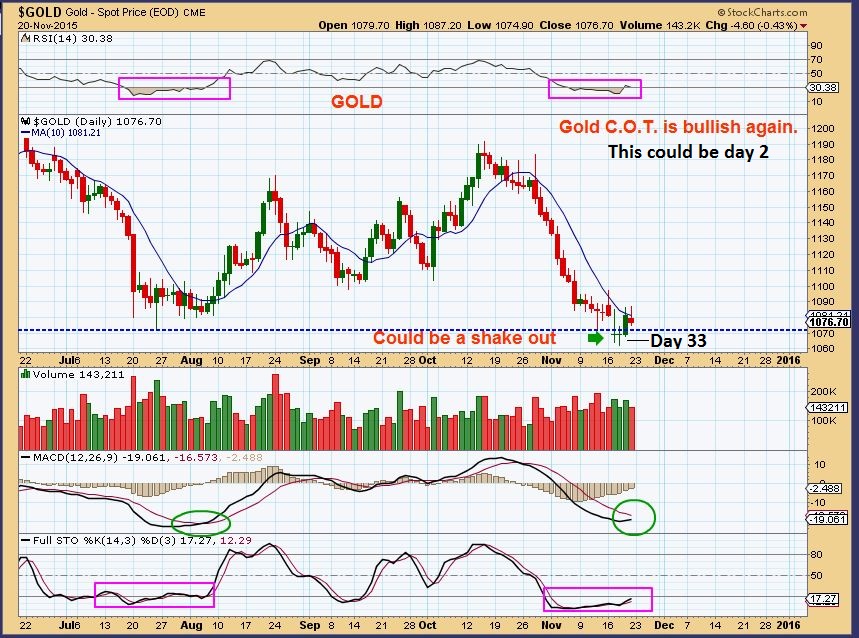
The Silver COT improved, but not quite as much as the Gold COT. The GOLD COT has returned to levels that have supported past ICLs.
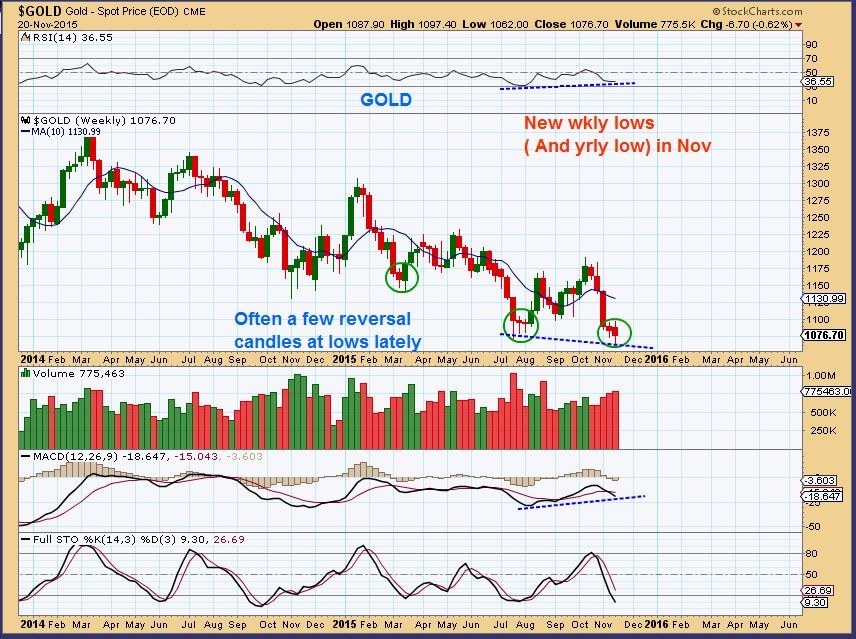
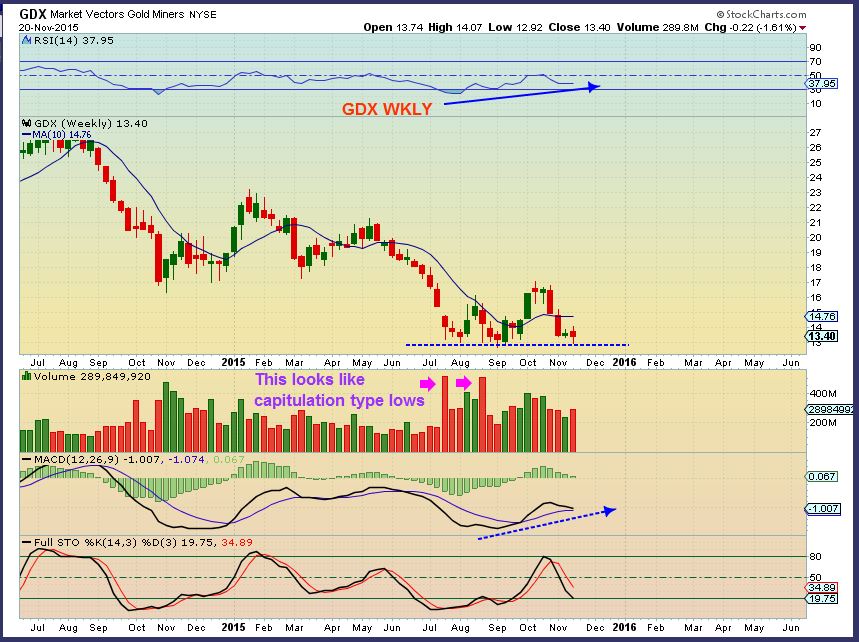
GOLD WKLY – We had 2 reversal type candles at recent lows. Notice that July had 3 weeks of reversal candles, it gets bumpy down here. Last weeks was the lowest low. In November of 2014, we had a yrly low for Gold. We may have the yrly low for Gold in Nov 2015 too.
GOLD DAILY – On day 33 price lows came in at $1062, and now we see a swing low in place. We are on day 2 at this point, but price is rejected at the 10sma. A drop below $1062 extends the daily cycle to day 36+. A close above the 10sma would add confirmation of a DCL or ICL being in place. Look at the lows in July/August. Buying near the lows was not easy and not for everyone. Price can still bounce around here, and that is why in my last couple of reports I separate the traders from the conservative.
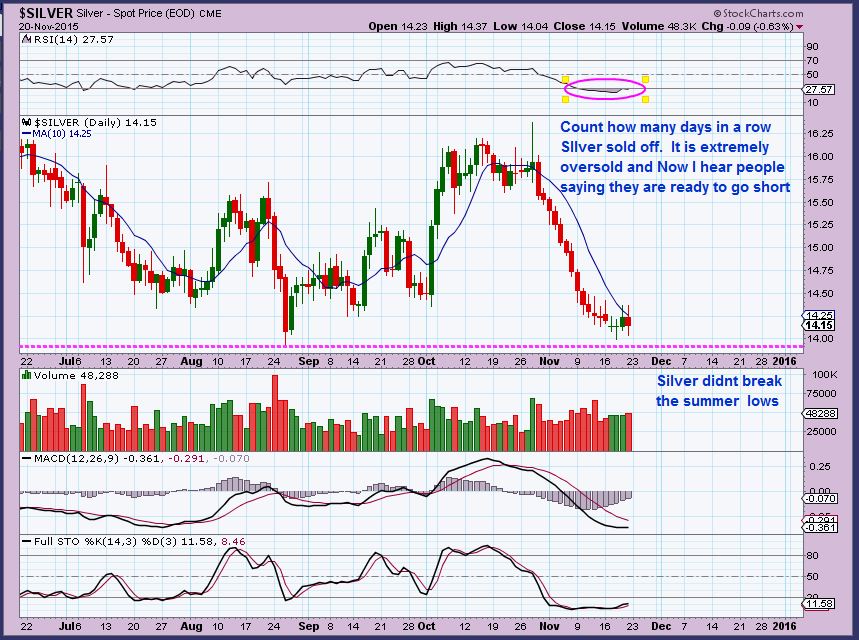
SILVER – Silver has not broken the lows from the summer yet. $1391 was the August lows.
GDX – What do we see here? A low is possibly in place on day 35, a swing on day 36. Miners at the lows have been very tricky lately. We got a quick drop Friday. It is not impossible for GDX to break the Sept lows, since GOLD broke the summer lows. It is unpleasant with such whipsaw action, but we’ve seen it many times before. What if we go lower Monday? See the next chart below this one…
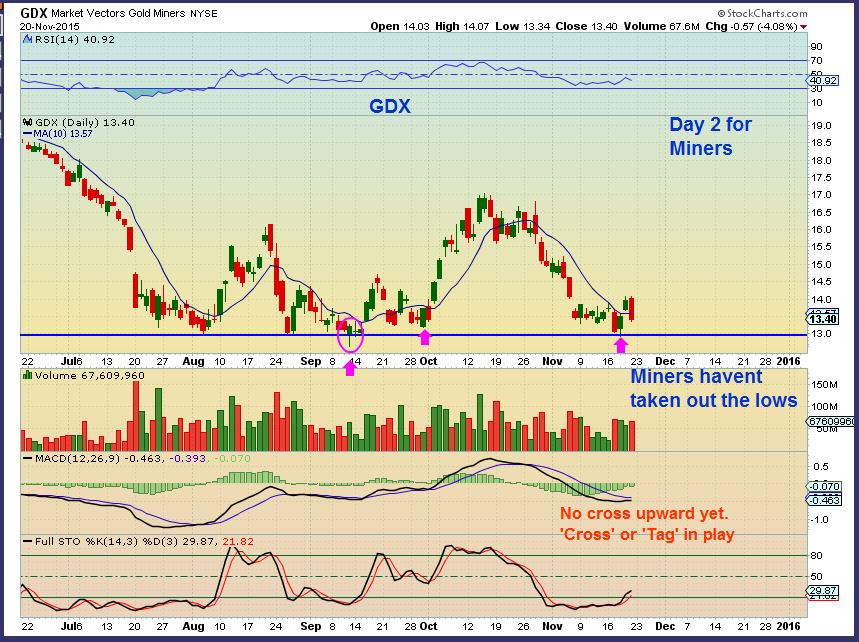
GDX – I drew in a possibility of another small drop Monday , and I point out that past lows were tricky and messy. I meant to note that the SEPT 11 lows spent 3 days down at the lows. It is not uncommon.
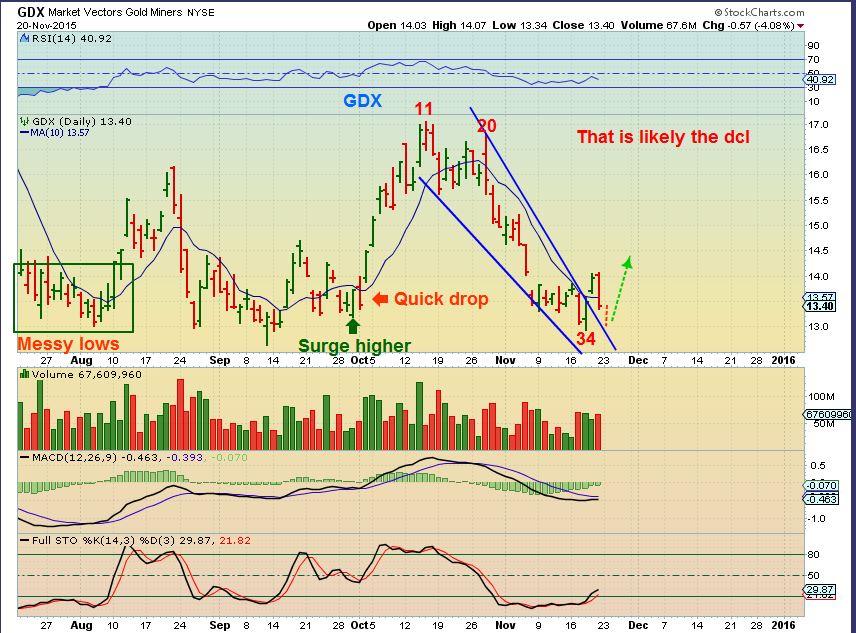
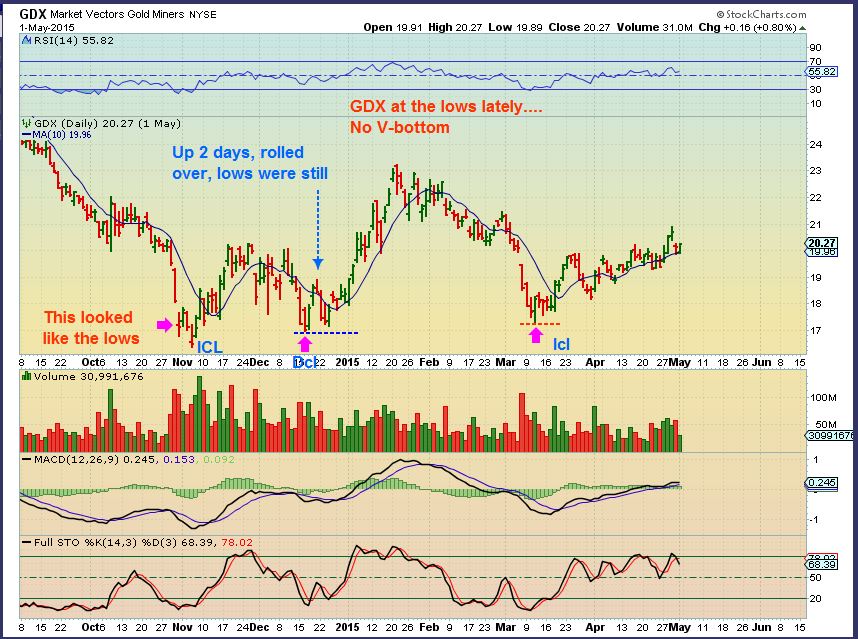
GDX PAST LOWS – People get worried because ” GDX didnt take off upside. I am concerned about Fridays drop!”
Sure, GDX could drop and put in another low, bottoms are never easy. Please use & honer stops. The lows are really for experienced traders, and stops will protect you from large losses. GDX lows have NOT been V-Bottoms lately, so this bumpy action is nothing new. What looked to be the NOV 2014 lows broke to new lows 1 more time. Could we do that here?? Yes. The Dec lows surged higher for 2 days and dropped just like this recent low. The March ICL went sideways for 1 whole week. No V-Bottoms at those lows, so why expect one now?
GDX WKLY – It looks like the September lows were a test ( False break ) of capitulation lows . We haven’t broken below the Sept lows here and if we dont break them and run higher? That would be quite bullish. A break of the Sept lows will stop me out.
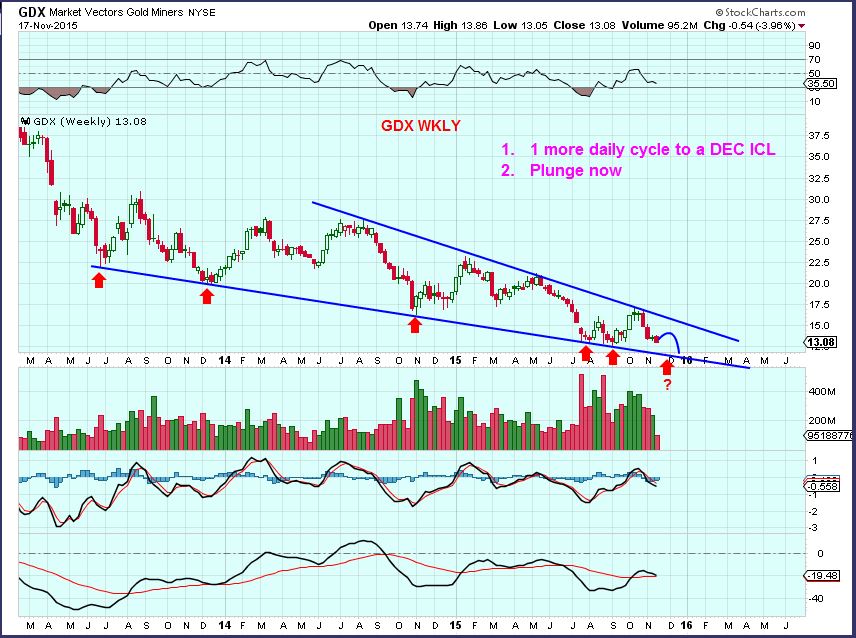
GDX – Its possible that someday GDX could still drop to the lower trend line. If THE lows are in in GDX here, it should run to the top line and eventually break out higher. It will take time to let this play out.
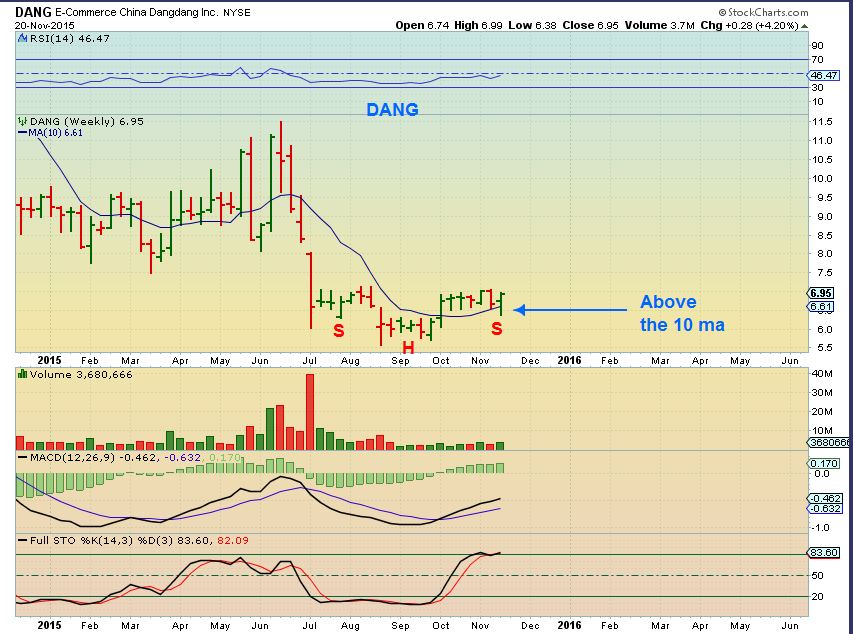
I wanted to end by posting a few of the charts that I mentioned in the last report. I had DANG, CMCM, NK, GDDY, etc and Most went up a bit higher Friday. They still look good, so I wanted to just add them as a reminder here.
DANG WKLY – The daily and weekly chart looks really good.
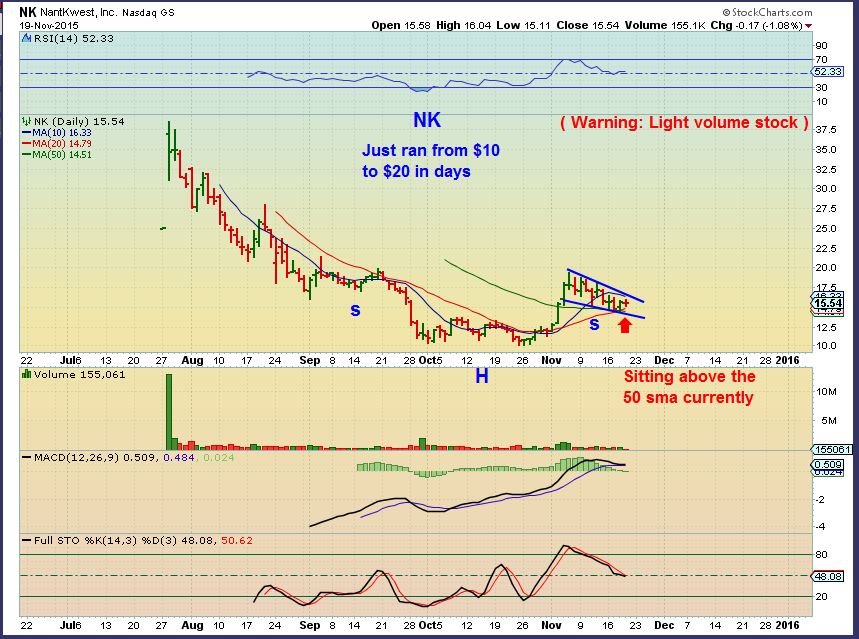
This was NK when I posted it. It jumped to the 10sma and was held down, but that puts it close to a break out.
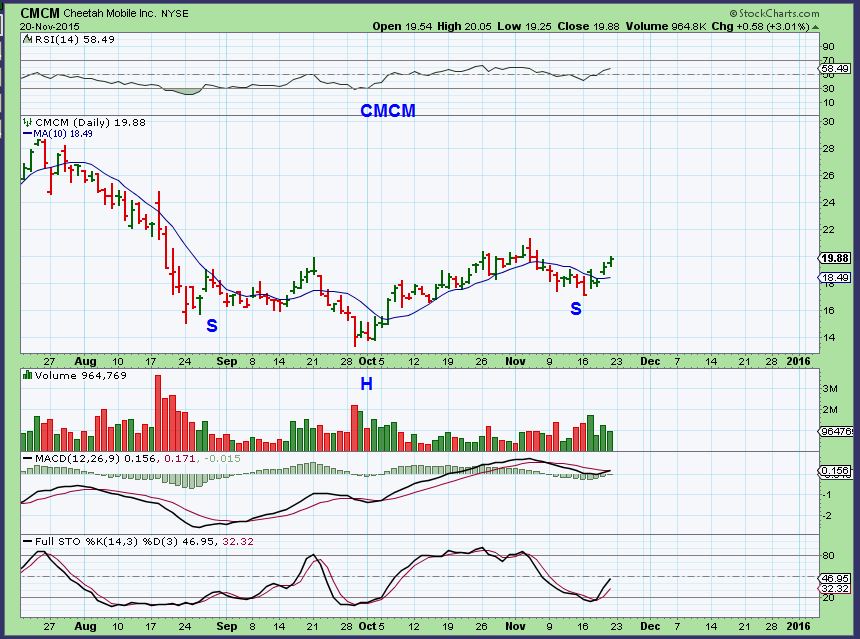
I posted CMCM Friday –
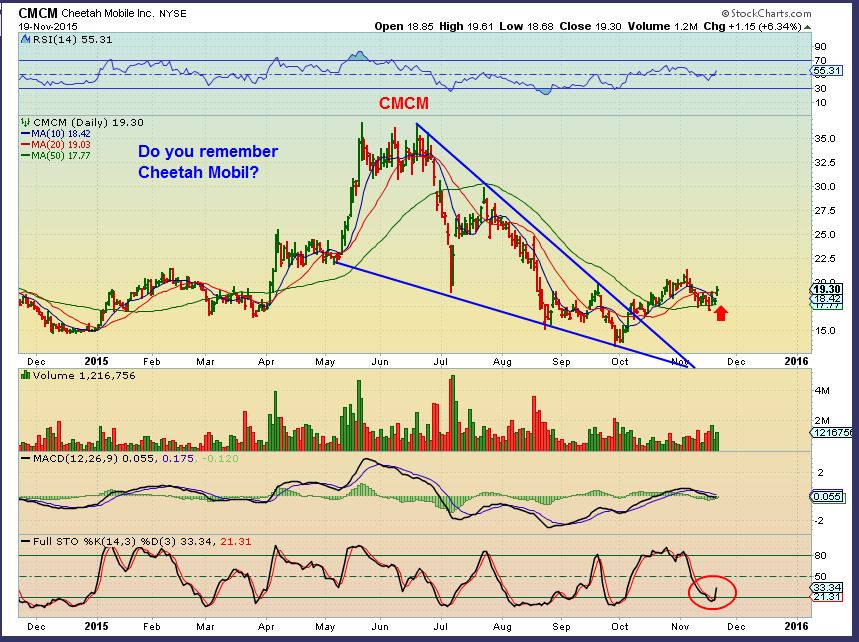
This is an update – The MACD is now crossing upward.
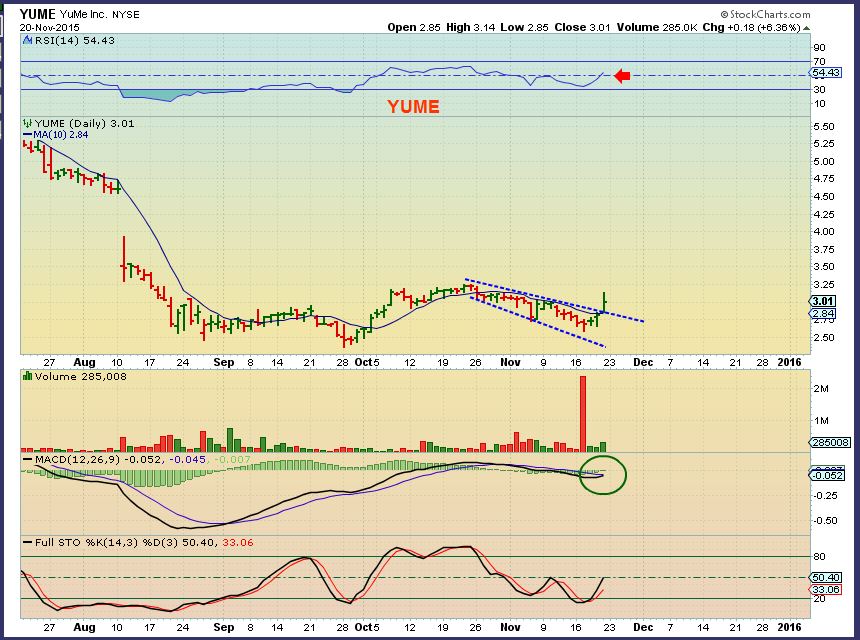
YUME – This one is new
For future pull backs, I’m keeping an eye on HIBB, GPS, SPWH, and a few others too.
CSCO & ROST are interesting too. After getting slammed on earnings, they have put in a nice recovery so far.
So basically I think that the markets ( SPX-QQQ-DJIA) are bullish and will move higher over time. I believe OIL will see weeks of lower trending prices. Oil can be shorted using SCO, which bounced off of the 10sma. NATGAS is ugly. GOLD, SILVER, & MINERS may have just put in a daily cycle low last week. This week will confirm or deny whether those lows hold. The timing is right, but lows are very tricky and can bounce around for a while too. It will be monitored this week.
I hope all had a great weekend, welcome back and happy trading!


This will probably be a relatively warm winter in NA. Lots more moisture out west but warm stretching into NE.
That being said an anomalous cold snap in mid to late dec. along with another in January can draw down NG enough to spark a rise in spot price. Total of 20 days, with wind, and drama can act as a vacume on pipeline storage quickly in heart of winter.
Thanks Alex,
looks like scenario #2 tonite with pog 🙂
Beek! How’ve you been? Good to hear from ya!
If you’re still around, What was Golds scenario #2 ? In a prior report? Thx
day 34,day 37 or…. scenario #3,
Drop in almost daily. took some losses on nominal option and leveraged gains, but have held my “LT” miners way too long :-0
I’ve been imagining maria is your secret admirer; but if not your’s (or bill’s) we need introduce her to either of my boys.
🙂
giggle… oh mariaaaaa
…. how do you solve a problem like maria … ;o)
ps. the answer is ………………………………
D. ALL OF THE ABOVE
Did you mean D- None of the above?
oops .. minus the “sons” thing 😡
Always enjoy the rapport on this site.
Fortuneate crowd.
orrrrr, as my friend Jack sings …. fortunate fools ??… ;o)
https://youtu.be/BLR4g33W6R8?t=27
DANG: I’m having trouble deciphering it. Is it a company (like BABA) or is it an ETF?
Instead of just answering that question, try this… it will help you in the future if you run into the same problem .
Look up the ticker ( go to yahoo finance for example) and click on the “News” for the company or “Company profile”.
If under the news headlines you find that they released earnings, they arent an ETF. Then look up the company profile or earnings report, etc .
Right oh, thank you CF
P.S. –
http://www.marketwatch.com/investing/stock/DANG/profile
Does anyone know of a Chinese E-Commerce ETF? Would love to get a basket of BABA, JD (!!!), Tencent, Dang (…) etc for my pension
After dreadful open for Crude – down 3% – now soaring bcos of Saudis. Appears they’ve capitulated and will reduce production.
Should help Em Mkts generally, if anyone interested in those.
Laugh or cry? I think this is funny!
From Clive Maund:
“PM SECTOR BIG GREEN LIGHT and LOW RISK ENTRY SETUP…”
~at 321gold.
I’m not sure what it is saying, but if it talking about a ‘trends power” . It was a powerfully bearish trend with 13 straight days down 🙂
But Bearish is often bullish to the contrarian. So many down days leads to exhaustion, etc
I find the TrendPower dials to be a funny cartoon because as you noted in your silver chart above, “Now I hear people saying they are ready to go short”.
Other chartists have also mentioned that charts look most bearish at lows and most bullish at highs.
Clive goes on the COT Report ive noticed and usually on a 2 month held trade, it works out…
happy monday all :o)
… may we fill our pockets this (shortened) week…..
Thats true…Thursday the markets are closed and Friday is only a 1/2 day of trading.
Not in this part of the world!! Some of us at least have a five day week as normal! 😉
Well then we will leave you in charge of flying the plane solo , while we all take a nap in the back 🙂
That sounds like a recipe for disaster!! Lol
San Francisco Fed President John Williams echoed that view on Saturday, stating there was a
“strong case” for raising interest rates next month provided that
U.S. economic data does not disappoint. “Assuming that we continue to get
good data on the economy, continue to get signs that we are moving closer to
achieving our goals and gaining confidence getting back to 2% inflation…if
that continues to happen there’s a strong case to be made in December to raise
rates.” Williams is a closely watched policy maker who often signals the
Fed’s consensus position on monetary policy.
Alex-Do we have consensus on what a interest rate hike will do to GOLD?
Sorry Bill, Not exactly sure what you are asking. A consensus for Gold during a rate hike where, with the Fed members?
If the FED decides to raise rates next meeting. Will that be a Negative or a Positive for GOLD?
I’ve seen a chart today which shows that when the last two rounds of raising started, it meant the top in the US$. Of course, that was in a secular slump.
If you want my opinion?
I think it starts with perception. It could be perceived as both Bearish & Bullish. Initially it could cause a negative reaction, but then it could be rumored that they are raising rates to fight “Inflationary” conditions and that would be perceived as Bullish for Gold- that they may see signs of inflation.
In the past, I used to trade Gold when the Fed raised rates ( I believe in 2004 rates were raised 2 or 3 x that year, and Gold went up. The reaction was mixed immediately, but Gold when up each time after the knee jerk reaction.
I’m thinking that raising rates hurts the USD, then that positively effects GOLD.
I have read a few articles that say that it is bullish for the Dollar and that the rate hike will push it to 120 – the next leg higher after consolidation. Its possible, but I also think that some will feel that it signals the Fed trying to control inflation, and that would be Gold bullish.
The chart of the dollar does look like it could go there, that would send Gold right down below $1000, but I have to wonder if it would happen. There are several Miners that seem to be bottoming ahead of gold – and under bad conditions.
Double bottom on Gold? Pretty close…….
Its a gap fill for GLD so far.
The dollar dropped a bit, I would like to have seen more of a pop in Gold : (
That was a pretty intraday reversal candle in OIl on the news that JD mentioned.
AND XLE find support on the 50sma again. That is impressive to me .
nice… whatup with SN
And KEG & REN
hmmmm ….
I SOLD MY CJES
Now it looks even better
ohhh chartfreak… https://uploads.disquscdn.com/images/ddf5b40e7df3b3b13f3f54527e711f3b2fe7f9365413ac7acff73fe12ce9fddc.gif
ooo.. rexx .. fugly
Just listening to this now, so have no comment at this time.
Peter
Krauth: Gold Is Hated And That Is Exactly Why You Should Be
Interested
– 11/22/15 (20 minutes)
https://www.youtube.com/watch?v=RC7MtyBAHKU
Sent you an email 🙂
KBIO…
Buy it for 44 cents last week…sell it for $45 today. Not a bad run.
REFRESH
.
Ya, I’ve been watching.
I was looking through the news, didnt see enough to justify that. You’d think they cured cancer or something.
Short Squeeze!
Another Pharma AEZS has amazing volume today, no new news.
Yes, I’ve been watching some pharma biotech today too. Interesting bursts off of the bottoms.
ABIO SRPT looked interesting too.
Crazy volume in ABIO as well
Alex any thoughts on GDX action do far today ? With Gold down usd 10 its seems to be holding up well ..Will it last??
Hi Sandy
No – sorry – I have no new information to go on that what you mentioned. Gold is down and Miners are holding up rather well, but anything can happen down at the lows.
Its just a ‘so far , so good’ right now, but with GG, ABX, NEM ( GDX) under the 10sma… they need to prove themselves with some buying soon.
NYSE going to discontinue Stop Loss Orders?