
Is A Golden Bounce Coming?
As mentioned in the weekend report, Gold & Silver have been selling off at a very rapid rate, and I think that they should be due for at least a bounce. I want to take a look at that idea in this report, but first a review of the markets.
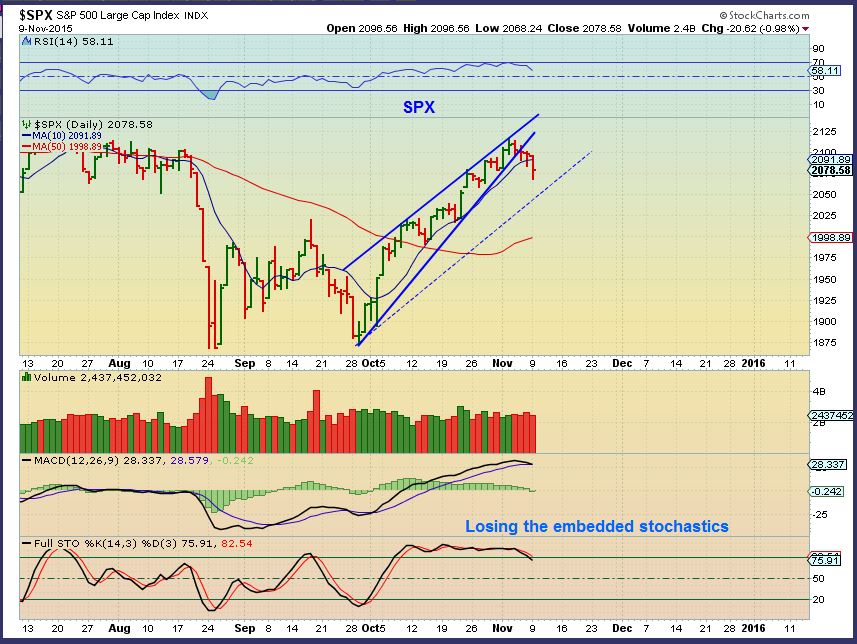
The markets don’t look bearish, but this possible rising wedge formed by Nov 4.
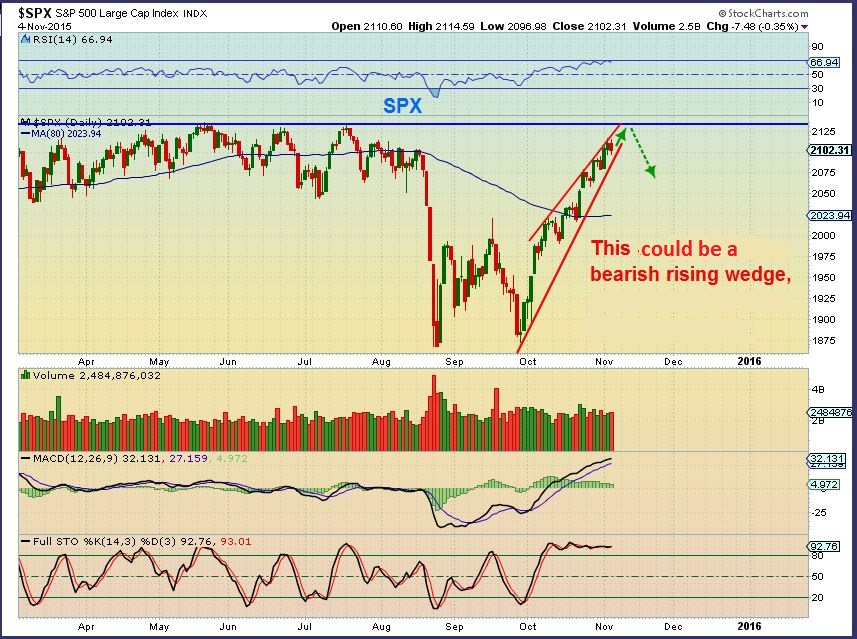
SPX currently- This does not have to drop too far, it could even go sideways.
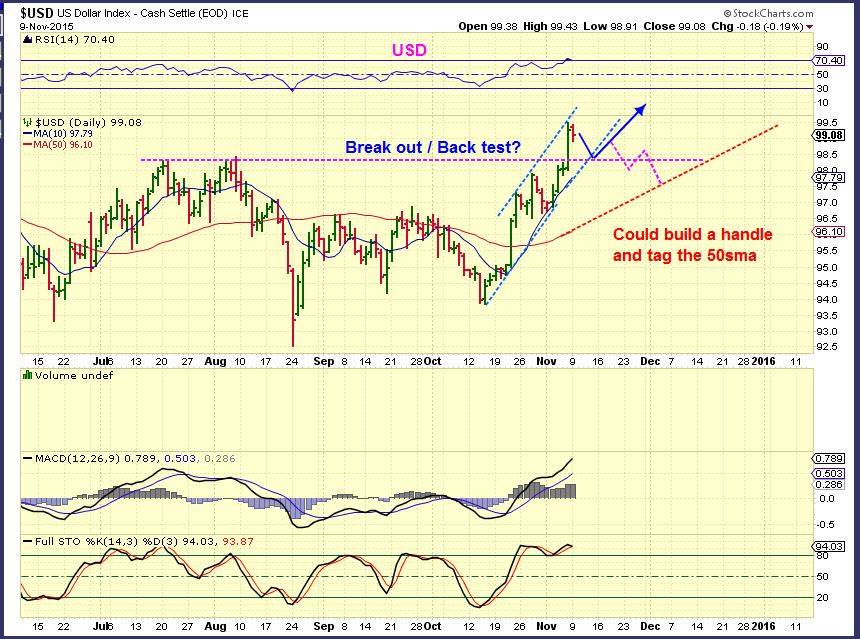
From the weekend report: I expected a drop in the dollar , maybe a back test of the recent break out.
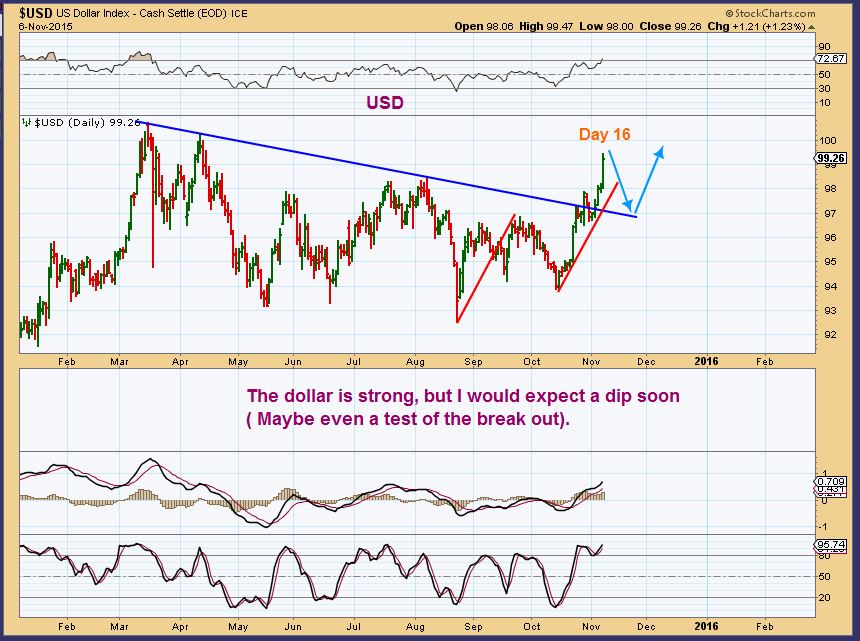
We may just see that back test , but I can also picture the dollar forming a handle and allowing Gold to run for a bit (Cup & Handle).
I have been a bit puzzled by the move down in Oil and the strength in the XLE and some Energy stocks . Thinking about that slight disconnect, I pondering this. A day 45 DCL?
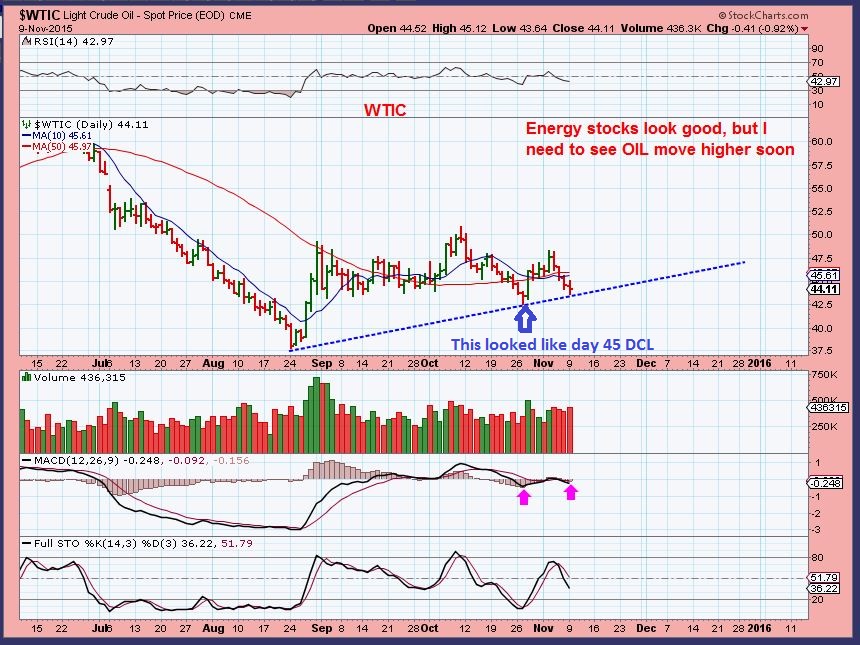
OR
Is the XLE holding up in anticipation of another ‘stop run’ & a future OIL DCL on day 55?

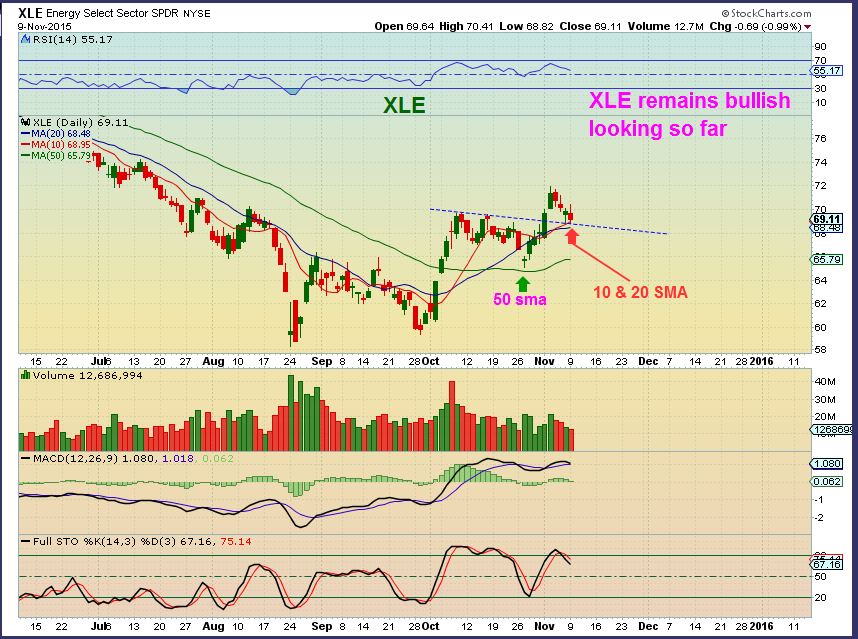
That may be a stretch of my imagination, but the XLE remains healthy. I will remain cautious. I hold energy stocks and the XLE is exhibiting strength with OIL selling off recently.
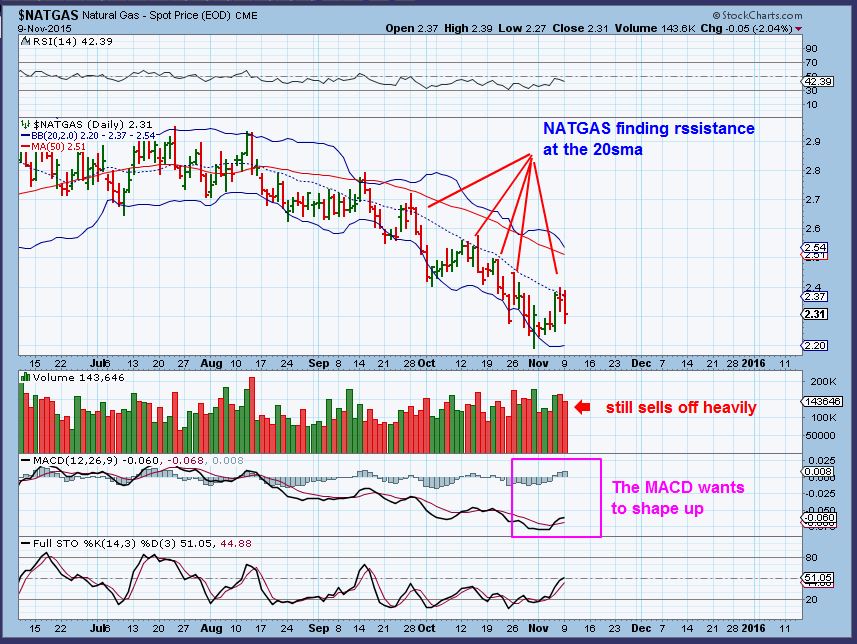
NATGAS – This is in a down trend and struggles at the 20sma, but the MACD may be finding its footing soon.
.
GOLD SILVER & MINERS
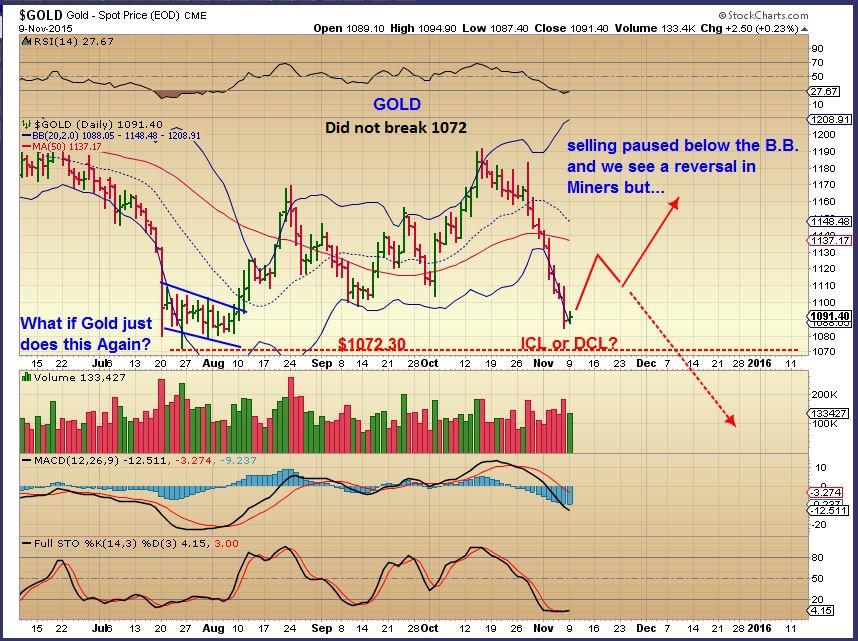
Monday many Miners put in bullish reversals. Cycle-wise the timing is in the area that we would expect a daily cycle low. The selling in Gold & Silver has been strong. Everyone is again calling for the summer lows to be broken and for a drop to $1000. So could this become a higher low and then a higher high type of ICL? I do think it could, but to be safe lets talk as though we are only getting a dcl bounce. Why? As mentioned in the weekend report, some factors for a Bullish Gold longer term have changed (SPX:GOLD break down, USD break out, etc are not usually bullish for Gold). Lets just plan on a bounce soon.
GOLD – A rally or a bounce is due, but it may eventually drop . We saw 8 straight down days and 15 red days of 17 ? It looks similar to JULY, breaking the bollinger band . Just a reminder: In July Gold just went sideways for weeks and killed peoples patience.
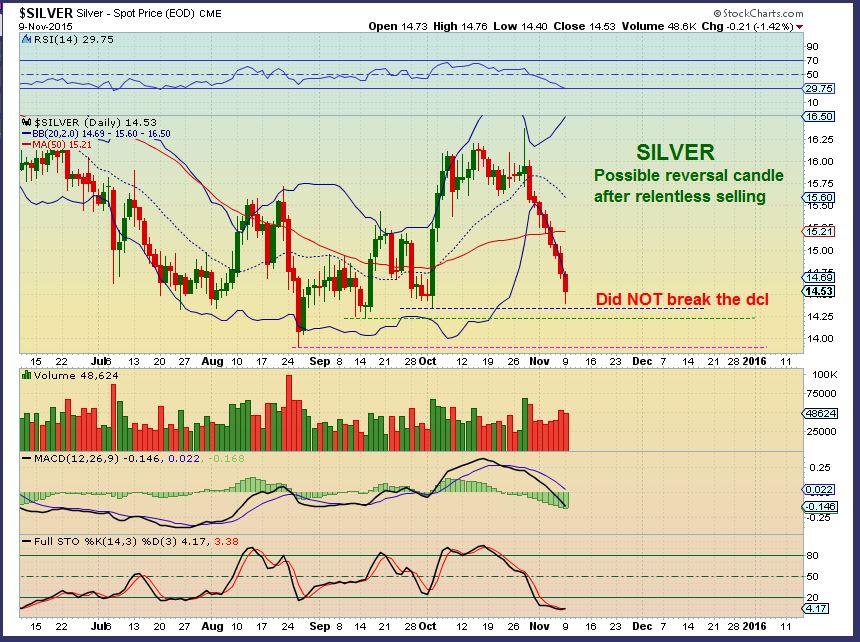
SILVER – Silver also dropped for 8 straight days. That could be a reversal candle Monday. Normally a reversal candle is not enough to get excited about, but the timing is getting late and many silver stocks were green today. Miners often lead the way. NOTICE: recent lows were NOT broken in Silver.
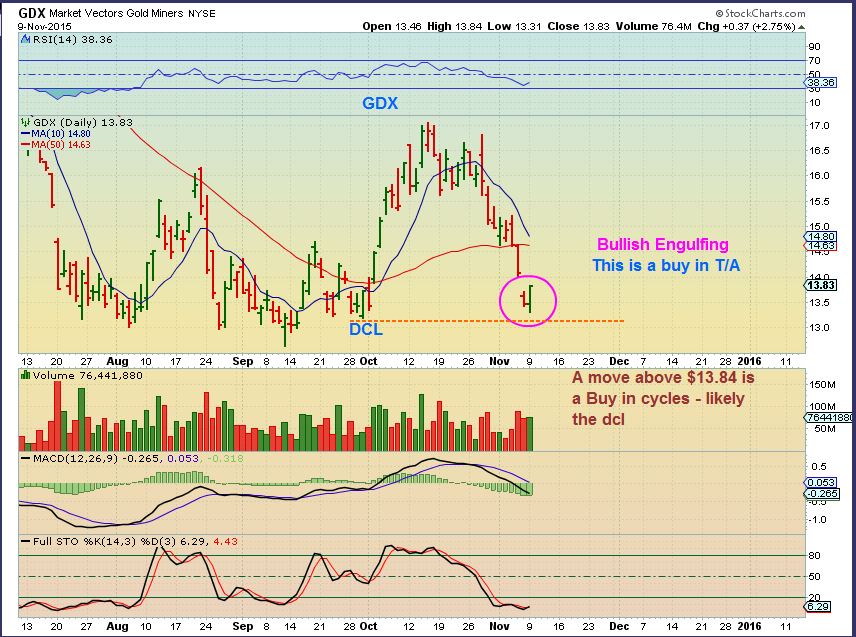
GDX – With gold & Silver selling off, we had a Bullish Engulfing Candle. This is a buy in technical analysis. In cycles you would buy a break above todays highs . GDX did NOT break former DCL’s. If we get more than a bounce here, if we get a rally, this would be a bullish development.
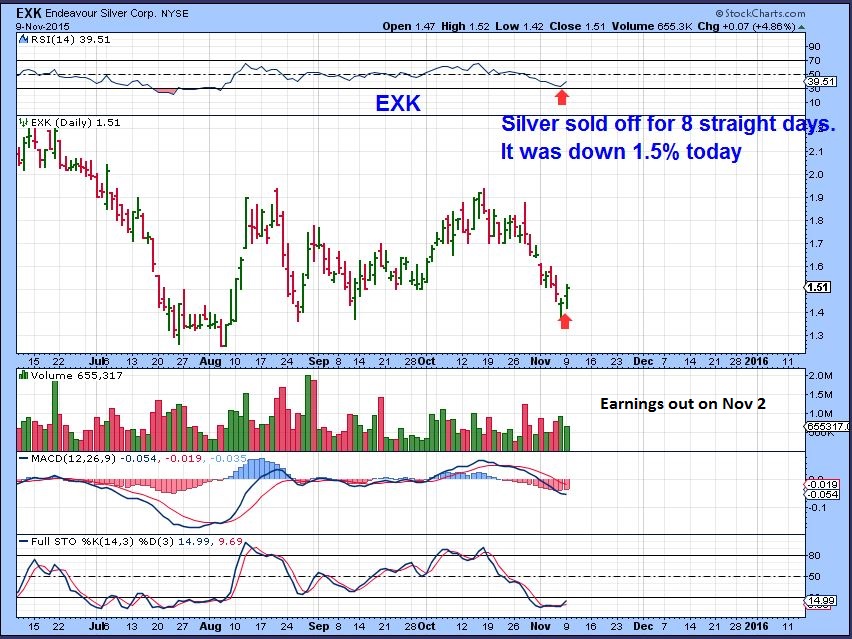
I mentioned that with SILVER selling off for 8 straight days, silver miners looked a bit bullish today. Lets look at a few charts.
EXK
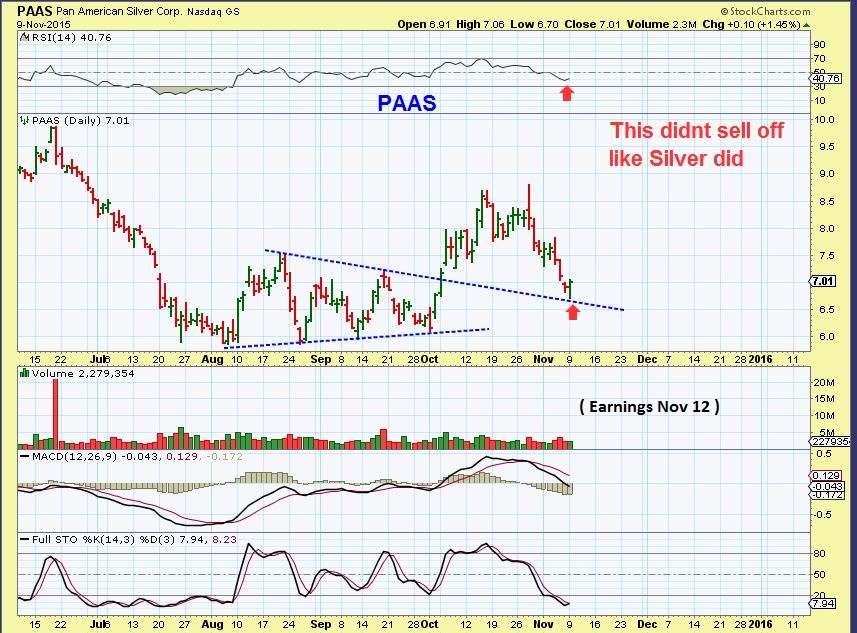
PAAS – Not so bearish looking.
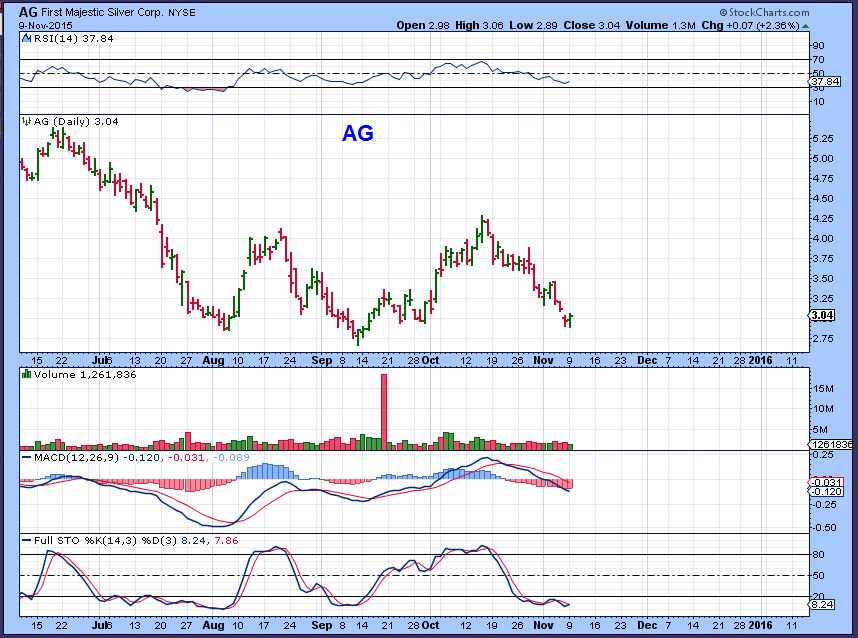
AG – Ran from $2.75 to $4.25 from Sept lows.
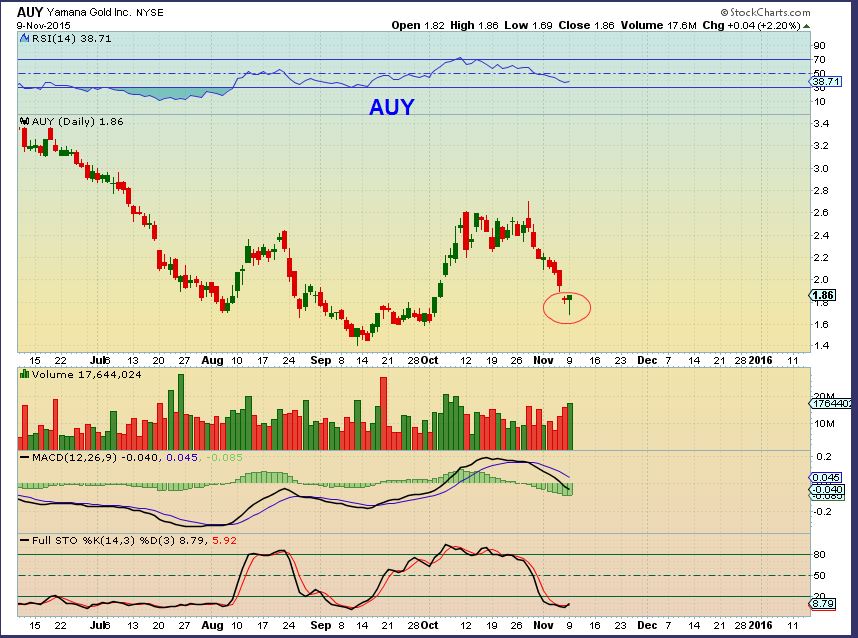
Also Many Gold stocks looked favorable despite the sell off in Gold & Silver today. See SA, SAND, AUY, ABX, etc


Alex,
Based on Harmonics, I see at least a 50% (of CD) drop in SP500
https://www.tradingview.com/chart/SPX/s7VvIEmT/
Hi Bill,
Yes, I usually have several targets using various methods and the Fib Retrace is one. The 38.2% is about where the 50sma will be by the time SPX gets there, so thats another one too. Thanks.
Good report Alex. The weekly chart on gold makes me think that we’re near a short-term low and due for a rally soon. Same hints from the weekly for the $USD. My read of GDX’s weekly suggests a little more to go on the downside. As daily charts are not my comfort zone, I defer to others who are better at reading them than I am. I’m still cautious but looking ahead to a nice buying opportunity in what I hope will be within a week. (don’t hold me to that!) We’ll see. Good luck trading to all.
Thanks CS –
Using a wkly chart, there is a chance that yesterdays lows could be the lows and if we stay in this area for the week. we could break this weeks highs on a weekly chart next week to put a swing in, but I’m getting ahead of myself here 🙂
Thanks for the input.
hello .. black gold bounce…;)
Texas Tea
… well the first thing ya know..jed’s a millionaire …
rexx is tryin 2 come back from that spankin …
I am bored to tears sitting in some of my energy positions that are just up 1 day and down the next. I need a rally in Oil here 🙂
yeah.. same… it gets sooooo OLD watching the ebb&flow .. can suck the life out of you actually…
but ….. since they haven’t ‘invalidated’ any of my counts.. im still in most & working H A R D on my discipline to stay w/ my wave thesis ‘swings’
… my heart and soul yearn to scalp them.. butttt … my brain (yes i have one so don’t evvvven) knows i don’t have the time…. tho i cheat sometimes…lol…
#NaughtyCatWoman
I know…Most of mine have stops below the 50sma and they are holding on so I am holding on.
Yes, I knew you had a brain, I just haven’t figured out quite how it works at times 🙂
BAS lost 50-day today. Oil was up marginally and XLE looked strong, especially compared to SPY, NAZ and tech sector. Not sure why small cap energy had such a bad day. Except Stone, that one still looks really good.
Sorry, slow day
LOL .. the crew!
Maria, Alex, Geurt, and me? Not sure who is who
Alex is DEFINITIVELY GRANDPA…. I call dibs the blonde chick – forget her name (sorry granny) 😡
Ellie May? And I’m not Jethro?
Ellie Mae.
why thank y’all eddyt (in my best southern drawl) ;o)
Yep, that sounded JUST LIKE GRANNY 🙂
oh … shooo fly
i have a sh*tTon of data that need analyzing.. how about I send u that to work on for me… teeHee
What about this ??
The cycles bottom on Nov. 25 !!!
how do you know?
Good question Marinho ???
Marinho – Thanks for yesterdays post. I somehow missed it until later on.
Guert – What made you choose Nov 25? Just a guess or another reason? ( That is a day before a U.S. Holiday too, so US Markets are closed that next day – Thursday and only 1/2 day trading Friday.)
Alex,
cycles have been morphing and getting shorter and shorter in gold. I don’t know what it means, but it looks like gold has slipped down since april 2013 slowly but surely and the bounces have been smaller and smaller. Hopefully we will reverse the trend soon, but at this point November (25?) could be a ICL cycle low and then the first quarter 2016 next best bet. something outside the cycles need to happen for gold to regain strength. Best a rate rise to break the GM’s and or an act of war somewhere.
The smaller pinched cycles can be the effect of a triangle type squeeze. In the past I have thought that it makes cycles as we know them a little less reliable….only because of how they can be mis read.
It can be bullish or bearish, depending on how the break goes. Time is ticking onward.
Marinho, that is what I said last time, how each BMR gets progressively weaker and weaker and time moves forward. One day this will end, but I certainly don’t know when.
It’s very difficult for me to translate information from Dutch in English.
Article in Dutch make no any cense to put it here.
Providential I got an email (link) from Weisresearch this morning and it comes up with the same information.
Here is the link:
https://www.weissresearchissues.com/uploads/2015/11/RWR-FLASH.png
Ok, I see what you were looking at and they were calling for a low and a bounce and THE low Nov 25.
It is possible. They show it as a bounce and a lower low and thats why they would call it the low.
We also may get a bounce and a higher low , which would put the lows in sooner, but both ideas are possible at this point.
Nov 25th is a Wednesday, maybe its an end of month Fed day 🙂
Very interesting link Geurt which ties in very well with some other research I’m reading, which is forecasting a secondary low in gold to gradually form during November but the next advance is more likely to wait until late November to really take hold. That would tie in very neatly with your date of 25 November and Alex’s thoughts that we would see a bottoming proces rather than a ‘V’ reversal. Of course that means more patience yet at least in gold itself!!
I was thinking something similar last night when I wrote the report.
Remember that slow roll downward in Gold during Julys lows ( I pointed it out in the last Gold chart in this report) where the lows seemed to be in, but Gold just meandered along the bottom.
I think back at the ‘thought process’ back then of many writers and most were calling it a bear flag type sign of weakness and afraid to touch it. Maybe we see that again . – I feel like I’m seeing it in Oil right now and its rather annoying 🙂
You must have read my mind Alex! Lol See my chart and post above!! 🙂
Hiiiiiiii Chrissss ;o)
HI Maria. 🙂 At long last I felt like I actually had something to add to the comments!! Just posted a 4 hr chart on gold with a possible EW pattern…just for you!! Lol 😉
yay…thanks .. will have 2 check out later
My pleasure. 😉
what’s with SUNE & MHR ?
Not exactly sure, but SUNE, CSIQ, TSL, JKS, FSLR, SCTY all solar break downs.
MHR has been ugly for a while now.
Add RGSE, JASO , VSLR, TAN
and DQ
Is DQ solar?
Ouch…I thought their earnings were Nov 18 . I wonder whats up
Yes, DQ earnings on the 18th. That’s a real pattern buster there. I hope that isn’t a warning tell for the rest of the energy sector? Fingers crossed. And a perfect example of why you need stops. Mental stop wouldn’t have worked.
What happened? Why all the same action today? Some of them looked good and then crapped today. Look at SCTY. OUCH!!!!
Its slow here today, can we talk about stops for a minute? Lets take NUGT as an example, If I were to buy it right now at $25.71 where would a good stop be? $24.04 below the low from yesterday? or $24.51 right below today’s low. You still could lose 4-6%
For me : I dont have a position in NUGT , but if I did I think that I’d use a mental stop based on the low of GDX yesterday.
I am thinking that yesterdays low in GDX should hold, so if that breaks, I’d sell my NUGT. That could be a large %-Loss, so I’d keep my position smallish until it got going.
Sidenote: I look at the lows in July and I hate that slow roll down that it had, since that can cause someone to lose position.
It sure did!!
Bill, do you ever use options? Do you have any techniques for stops when long calls? I plan to scale in over a period of time when carving out a bottom (like I thought oil was going to do but did NOT recently) – so as it goes down you buy the dips, sell the rips. Sounds easy, but it’s not. I have trouble with when it’s time to stop out (remember they can move FAST so totally money amount invested is small) – do you add b/c now you can get more bang for your buck or do you stop out? By the time I find out my thesis is wrong, it’s usually too late. Guess I need to have a quicker way to know if I am tracking or way off? If your date/price target still hit, you’ll get supercharged returns. If not, you’ll go broke quickly.
Cason, I don’t use options. I know you can still place stops to limit your losses. With options you are using less cash to control more stocks so, your loss is minimized.
I made a few comments below under a chart Geurt posted showing a poss low date in gold for 25 Nov. This also ties in with Alex’s thoughts that this bottom could be a drawn out process rather than a ‘V’ reversal. Further to that I was just updating my 4 hour chart and noticed how the MACD and RSI are starting to show a very similar set up to the lows that formed in late Jul/early Aug. Although MACD had moved to a buy signal on the 4 hour chart and the RSI was starting to rise from deeply oversold levels, the final low in gold was not in place and after one final brief spike low we went into a bottoming process that lasted about two weeks, which would take us very neatly to Geurts 25 Nov turn date! Note also on my 4 hour chart how the 70 EMA (red line) is still falling hard and back in August, gold did not get the ‘wind in it’s sails’ until it had broken back above the 70 ema. So as Alex has already suggested, we may need more patience yet, at least in the gold price itself before a possibly 2nd and higher low becomes evident.
Nice job Chris, MACD crossed,RSI diverging higher, Have to break over the 10sma next.
Just jumped out when I looked at the chart but as Alex has so rightly pointed our previously if we mimic the Jul/Aug low we could easily have two more weeks of forming a bottom yet and worth noting that even after the initial buy signal on the MACD last July the actual price low in gold was still to come! So I’d be mindful of another brief spike lower yet but look for some bullish divergence on MACD and RSI as another piece of evidence a low might be forming.
Chris thanks for preaching caution. I went with GDX options this summer and that slow melt down was absolute death while waiting.
GOLD, we are either on day 40 or day 26? I’m leaning towards day 40. Typical gold cycles last 24-28 days?
Been taking a good look at my 4 hr chart for GDX as well and again a number of points jump out about the last two important lows in late Jul/early Aug and then again in early Sep. There was a bottoming process rather than a ‘V’ reversal which saw bullish divergence form on the MACD and RSI as the final price lows were made. We have nothing like that in place yet. Also note how a new rally did not take hold until the price had broken back above the 50 period ema (green line). This capped a NUMBER of rally attempts BEFORE the final price low was in place. Again we are missing anything remotely similar at this time. There is nothing to say the price low must form in similar fashion this time (assuming a price low is going to form!!) but if it does then more patience is required yet. My personal style leans towards trend following rather than trying to bottom pick and for that reason I would not personally consider a ‘long’ position in GDX until price gets back above the 50 ema on my 4 hour chart and we look to be a long way from that right now. Just my personal view though.
I certainly did not like the failed follow thru in the PM’s and GDX today. GDX on a Very short leash for me.
Agree. No position for me right now. I’ve lost too much on oil to be messing with these guys right now.
News and random thoughts – API out with bearish larger than expected build in crude stocks tonight which caused the after hours sell off in WTI. 🙁 EIA gov’t data is delayed until Thurs due to Fed holiday tomorrow for Veteran’s Day.
I am wary of gold through next Fed mtg. They adjourn 16 Dec with 2 PM Eastern announcement. Personally, I expect them to raise rates. While I personally don’t think that a 1/4 point raise means crap, I won’t be long gold/miners into that announcement.
I still like gas here. I don’t see a lot of downside possible right now. It’s way oversold. No, I don’t think we get a ‘V’ here either. But, accumulating on weakness (no UGAZ!!) slowly might be effective.
S&P near-term downside likely but we end a period of low volatility and high seasonal strength in the next two weeks. Look for 50-day to hold any weakness.