
Examining The Evidence
As I begin writing this report, it looks like OIL may be ready to bounce here. I wanted to take this time to examine the evidence and discuss my recent expectations in the Oil markets.
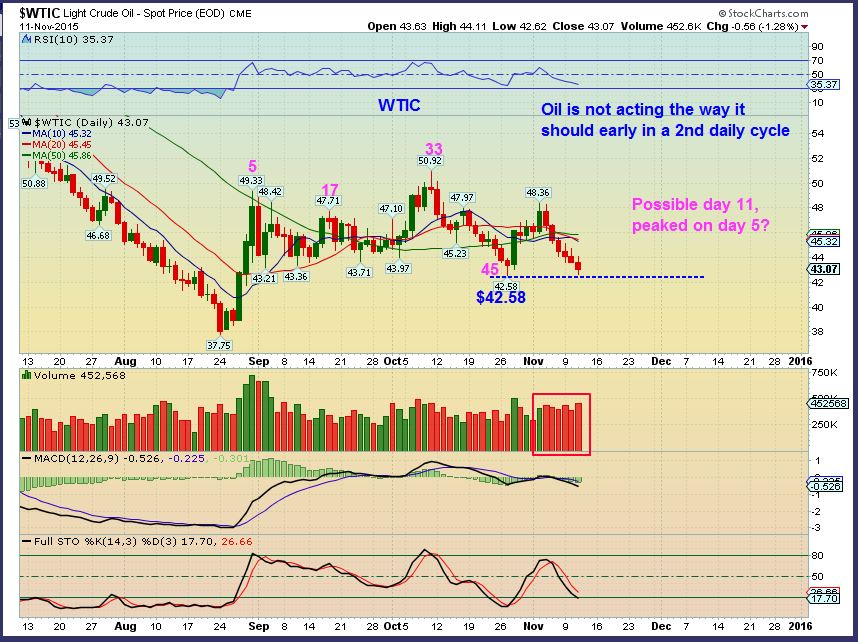
WTIC – Nov 11 this was our picture of OIL. Please note the $42.58 . Oil was not acting the way that it should early in a 2nd daily cycle and the high volume selling was noteworthy.
Now lets take a closer look on Nov 12 and discuss the implications.
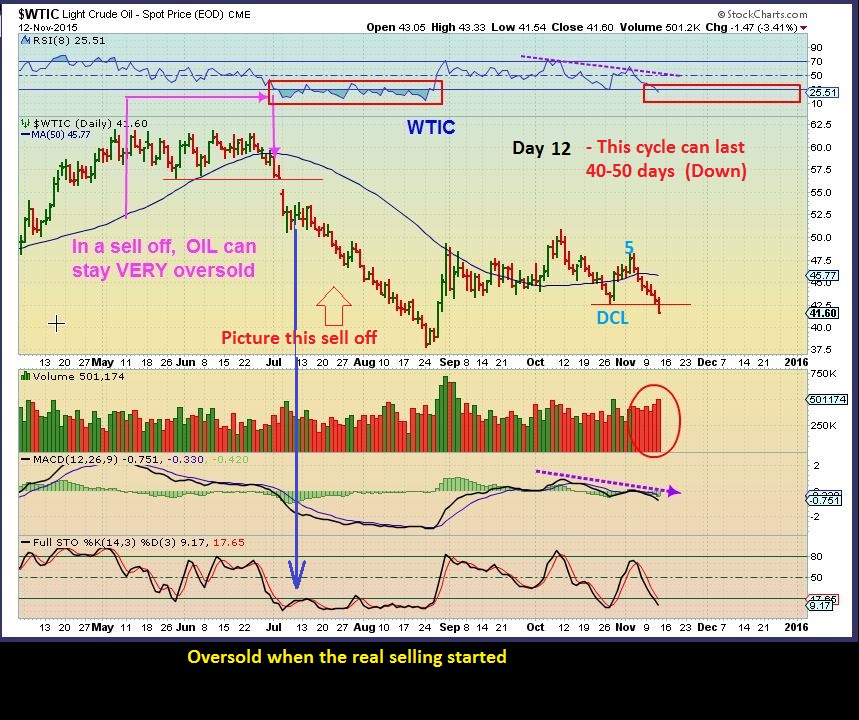
WTIC – With OIL putting in a DCL on OCT 27 , it then peaked on day 5 and began to drop down. That DCL was broken yesterday with high volume. That becomes a “Failed” Daily cycle. There should be no new highs from here, it should now drop down into the next daily cycle low . Oil cycles last 40-50 days on average and we are on day 13 today. This means that we could see oil Bounce and drop lower & lower for the next 40 days!!
.
Look at the sell off in June – Aug. The real selling started when Oil was oversold and the RSI was under 30 (Same as now). Picture OIL in the upper $20’s or lower $30’s if we drop in similar fashion. ( We dont have to, we can meander downward).
OIL looks set to bounce today ( It is green as I write). The above implications indicate that OIL is now a “Shorting opportunity”, not a long . I have been discussing that many energy stocks remained above the 50sma and the XLE looked strong, so that seemed to point to the idea that OIL may not break down. Lets look at the XLE with yesterdays break down in Oil.
.
XLE – At a quick glance, this chart looks Bullish. The XLE is holding above the 50sma, I would normally buy a test of the 50sma. We may get a bounce today and even Monday, but the Relative Strength (RSI) is telling me that the higher low here is deceiving. High Volume selling to the 50sma occurred. The Momentum (MACD) is telling me that we just saw a weak double top in the XLE. If we get an energy bounce today – I will be selling my Energy stocks for safety sake.
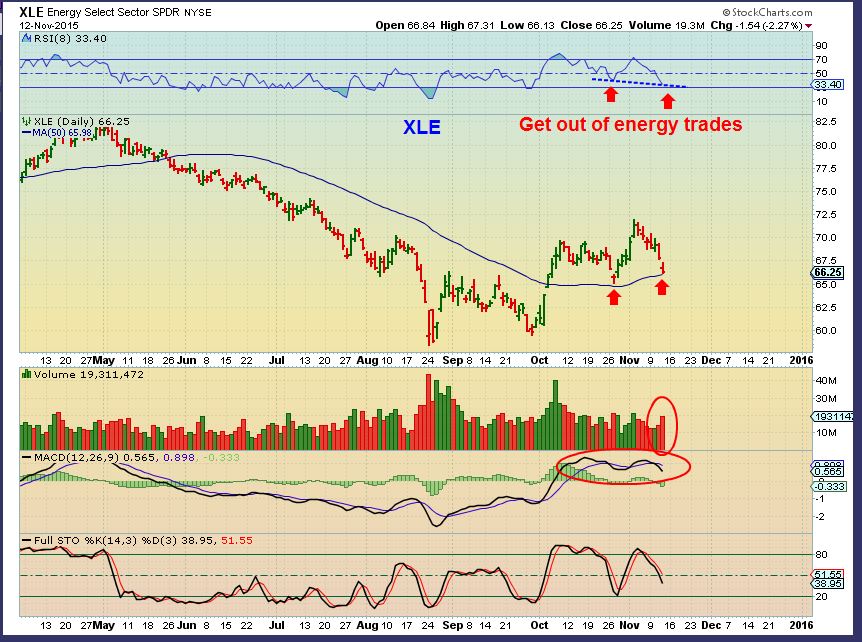
Look again at that XLE chart above. The set up was perfect right into November, with strong volume surges higher. A gap over the 50sma was bullish. A test of the 50sma and a break out higher just last week was bullish. Suddenly Oil began to break down and we need to recognize that the XLE is starting to show signs of weakness. It may bounce off of the 50sma here, but it did that in May too. That lasted for 2 days.
For those that like to go short, you can watch the bounce and short it when you are confident that we will get follow through to the downside ( I will obviously cover OIL here in the daily reports).
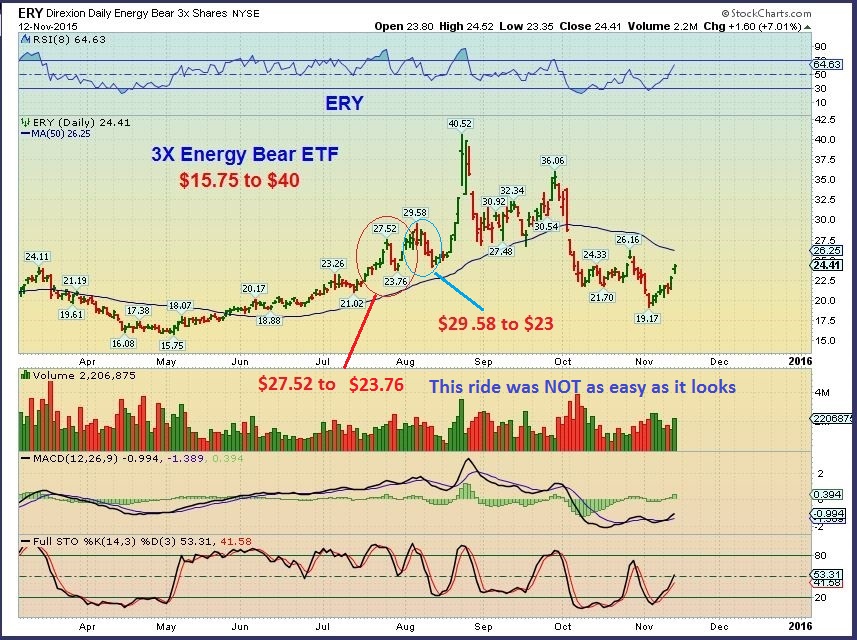
We have SCO, DTO, DWTI ( DWTI , ERY,& DRIP a 3x leveraged short for oil/ Energy … Dangerous, beware!)
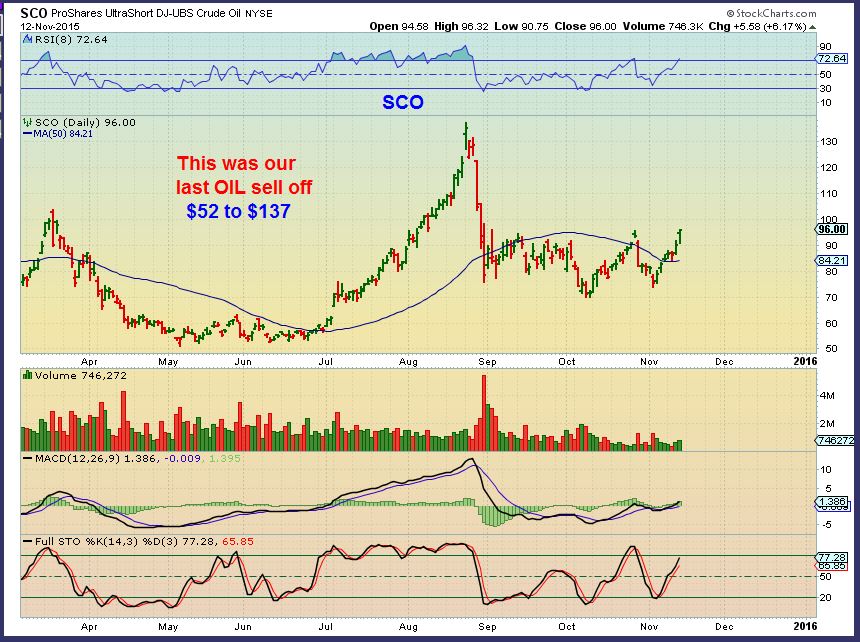
SCO & ERY are shown below. SCO went from $52 to $137 during the last Oil sell off. Even if you only caught the middle of that move , it was rewarding.
ERY – 3x ETF $15.75 to $40 .
I know this looks like an easy ride, but 3x ETFs are trading vehicles, NOT BUY & HOLD. Please notice that if you got in at $27.50 , it did fall to $23, and a buy at $29 and it fell to $23, you may bail out & lose serious cash. Buying this right here at $24? – you may watch it fall to $20 on an energy bounce. THAT is why I do not recommend buying & holding 3X ETFs here. Trade them at your own risk and skill level.
SO today I just wanted to point this important change in OIL out. AT one point I held out this as a possibility, mostly because the XLE was holding up very well. This was the “What if Oil is stretching to a 50+ dcl / shake out” , but recent volume and the RSI / MACD and other factors are pointing towards the DCL in Oil being on that day 45 and failing.

SO Energy may bounce here, but we should view OIL as having failed. That doesn’t mean you must buy puts today or start shorting it right now. You may want to wait until you see further evidence that it is going to drop. Seriously, if we have a 40+ day cycle ahead of us and OIL just failed, we have time to take positions. At this point, I still see some Energy companies that look bullish and are holding up above their 50sma, but I want to exit any energy trades knowing that things can fall apart rather quickly when the winds of change blow our way.
Have a good Friday Trading and a great weekend!


One idea would be to hold shorts in energy until it looks like the stock market has completed it’s DCL, assuming that the stock market will drag energy down with it. They both topped together on Nov. 3.
I forgot to mention DUG
Some serious losses when the earnings fail. And RETAIL has been in the cross hairs for a while.
After the markets open check out these charts –
ROST, JWN, FOSL, LOCO, VIPS, FIT, XONE, DDD, TYC, CSCO, etc ( Pre-Mkt losers)
Well you just ruined my first cup of Brazillian coffee . 😉
Are you saying that there is No way that Oil is on day 58 for an extended cycle ?
Hey Ken,
There are implications that day 45 was the dcl. Along with that, if day 58 was the DCL, I think we would see nice divergence on the lower low, but we are seeing the RSI also having a lower low, it kind of indicates that the weakness should be recognized as real too.
Also look at WTIC with the 50sma. When it is strong and it breaks below the 50sma, it usually gets right back above it rather quickly. It broke down and continued down. (REFRESH)
I’ll never say never in the markets, but the way that I see it now is that OIL is really weak and I feel that the XLE will follow soon. You could just keep an eye on the XLE & 50sma . I think we’ll see a break down, just like oil did.
Thanks Alex.
ALEX…… Thank-you for doing it even on a Friday.
Excellent advice and you care for us with an really heart.
Hope to see you one day, and we will drink a good coffee together.
Have a marvelous weekend, you and your family.
Thank You Geurt – You seem like a kind man with a good heart. Have a great weekend too.
..yeah .. what he said … (looking down pushing dirt around with my foot) ;o)
giggle …afterall, it IS the season to give thanks and, wellll … im thankful for u CF (still pushing dirt) for being the steady guiding compass day in.. day out ..red/green & in between …
LOL – Thanks Maria. And this chat/comment section wouldn’t be the same with out colorful Maria ( and all the others, but you do add a little ‘something’ with all ur GIFS ) 🙂
Alex, do you believe there is a correlation between OIL and GOLD? In other words, your negative bias on OIL does it also include GOLD on day 30?
That is a good question, Bill. My answer is no , not really.
The reason is that GOLD put in the last ICL’s ( Off the top of my head from memory)
in NOV 5th, March 15 and July 27.
OIL drpped VERY SHARPLY from Nov 5th into Feb – Gold rallied.
Oil just dropped sharply from July 27 to Aug 24 . Gold put its ICL in in July.
So – Oil dropped After the lows were in. o if GOLD is putting in an ICL here – Oil can drop and it doesnt have to affect Gold.
A ray of hope! I did read on other sites, that some expect $37.75 to be critical support for OIL. Not hard to figure as its the previous low. Commodities have been down since the FOMC, Gold to the day. OIL went up for a few days and then rolled over. With many expecting a rate hike in December do you think all this selling is due to the market building the expected hike into the commodities?
Inflation etc stats today were disinflationary and pointed to no hike in rates (I’ve said b4 Rates will rise SUSTAINABLY when hell freezes over). Yet $ rose and, currently, Euro down heavily.
Yellen said it was a possibility!
http://www.wsj.com/articles/feds-yellen-december-is-live-possibility-for-first-rate-increase-1446654282
Yes as she and Ben have been saying for 3 years
I agree JD…..and when the USD figures that out ……again……it should fall which then will improve commodities. IMHO.
Alex,
I am looking forward to oil in the 30’s, since it is one of the primary components of the miners cost, we will see their fundamentals improve tremendously as they already have from 2014 to 2015. Incremental increase that will go to the bottom line in the miners.
I agree, It should have an affect on their bottom line when it comes to cost reduction.
The strong dollar will possibly affect some in a good way and likely others in a bad way.
That’s what I thought, too. But it hasn’t seem to work. I have attached a quick chart of GDX to WTI crude. Sorry, didn’t take time to write all over it. There is a huge initial spike last fall but that was the oil drop from $80 to $40, not really a GDX reaction. Then another spike during the big miner rally late summer. But you’ll notice not a sustained move – remember oil is down 60+%. I was hoping it would help GDX more. It has actually lowered the ‘all-in’ mining costs of many miners – check it out on individuals. It used to be near $1200 now closer to $890. While that sounds good for bottomline, it allows physical gold to go down even further before you get supply/demand contraction.
One of the many bull thesis items is that gold could go below mining sustainment costs. As mining production slows, supply/demand take over. Paper trumps physical 30:1 so it would likely dive well below for a minute. But once the COMEX warehouse really starts to empty on delivery, it would move up. FAST. But this is just a theory. Sorry to get long, clearly reading too much.
Sorry – forgot the chart at first!
Oil down 2%. Energy flat. Yep, makes sense.
Royal Bummer Tiger5
I’ve been out all afternoon and didn’t see WG until you mentioned it. I cant find any news on it either. I sold CRK , so you can be certain that it’s the next to rocket : (
How about Guert’s UGAZ today. 🙁
Wow! Anyone see any news for WG? I just got out of it yesterday, of course! I can’t find anything.
Gold down miners higher. I wouldn’t be surprised if this is day 1 for miners.
I was just looking at that , and time is in the DCL zone. ( No swing in place yet tho).
USD up to the top of the channel, and still miners are green! Impressive…..
For next week, long miners, short oil
Is it too late to jump in? I should have hedged weeks ago. No idea what the hell was wrong with me. As the charts changed, I failed to adapt.
I still can’t believe I missed the gold short at 1180. Good grief.
TGD up almost 20% after earnings last night. Very large MACD divergence , but volume is light.
Again, Many silver charts looking pretty good ( AG especially nice)
Fickle market!!
I had a list of possible set ups ( Long) and they are just failing.
An example is BZUN. That would be a strong bullish engulfing buy right at the 50sma. Look at it today 🙁
I can’t tell you how frustrated I am. I want to play slightly longer setups, but trades are down 2-3 days, sometimes only hours. We’re near highs on SPY/DOW, a mean only a couple of %, but this has been TOUGH. (especially if you keep messing with commodities).
This is crazy.. OIL hit lows recent today
Look up ECA, WG, BBG, GST, ERF, ARP, SWN
Are you kidding me? Could we be on a DCL at day 58 and these are sniffing out the lows?
Pretty impressive gains considering OIL is still dropping? I’m thinking oil double bottom around 38.75. Could happen Monday.
So many Energy stocks are completely ignoring oils drop. All the ones I mentioned above look great ( BBG AND ECA I owned and sold : (
That’s what I am looking for as well. If the second oil cycle count is true, we should break that low as well. It will be a big pivot point either way.
I can’t see this dropping for 40 more days. That would be ridic. I mean oil would be like $15, gas $0.99 – seriously? If that happens I’ll start buying barrels and keeping the crap in my backyard.
We are pretty close to an AB=CD retracement on OIL?
It is close
We could test the 37.75 in the period of a couple of days.
It’s possible IMHO. We shall see……
My junior oil’s basket up over 2% today and Oil down 2%…..didn’t see that coming. 🙂
But who knows …….
Have a great week end all………..
I was done, but considering the recent move and the ferocity of the oil move, it was was pretty muted. Clearly seemed to find some support.
:O)
Until oil shapes up, I’m think I’m stuck with a CRAPPY one. 🙁
Where did you get a photo of my wife?
… giggle…
go JD .. lol
NOG, SDRL…yep, many ignored oils drop – turned around today.
Just to put oil’s drop this week in perspective – down 8.25%; that would be the same if gold dropped to $994 from the closing price of $1083.90 today. I read an estimate that a full one million barrels PER DAY are pumped over global use. IEA officially stated this week (in writing, source: CNBC) that is 3 BILLION barrels of crude in storage, unused worldwide. Holy crap. And what happened today? They ADDED two rigs according to Baker-Hughes. Which idiot organization STARTED drilling $40 when we are close to topping all storage? Don’t know. The fundamentals are nasty bearish. BUT oil is 1/3 of the recent price, is that low enough to overshoot? Open SHORT interest added 30,000 contracts just on Wednesday, which was a holiday. Short oil and long dollar is THE trade right now. When everyone is on one side of the boat….
Natty gas. Down 6 rigs and found some footing today. End on the absolute highs, to the cent. Look, I’ve gotten a LOT of calls WRONG, but I am going with a near-term bottom in natty. I ain’t saying it isn’t going down, but I don’t think we’ll go below the 1.95 level from the expiring Nov contract. I’d slowly accumulate on down days. I don’t see UGAZ as a good bet here b/c I don’t think we’ll ‘V’ yet, I’d wait for a BREAK above the channel and 20-day on Alex’s chart. I’d use non-leveraged for now.
Temp forecast traders are watching is focused on East; west is cold now. Max bearish case is currently priced in. If it goes even slightly more bullish, shorts will cover and hot money will come in. And as I have stated, nat gas is probably the most insulated from a rate increase. Since Henry Hub spot is focused on US only prices, we don’t have the international currency effect to the same degree as oil and gold (other countries price different unlike gold and WTI {of course there is Brent crude}).
Euro had decent rise into the close. Broke below 1.08 last Friday. Stuck just under all week.
Technicals still suggest rally.
IF – big if – the breakdown fails then the reversal could be powerful. Failed breaks normally are.