A Clearer Picture
The picture started getting clearer in many sectors of the market after the Fed Minutes were released Wednesday afternoon. Lets take a look.
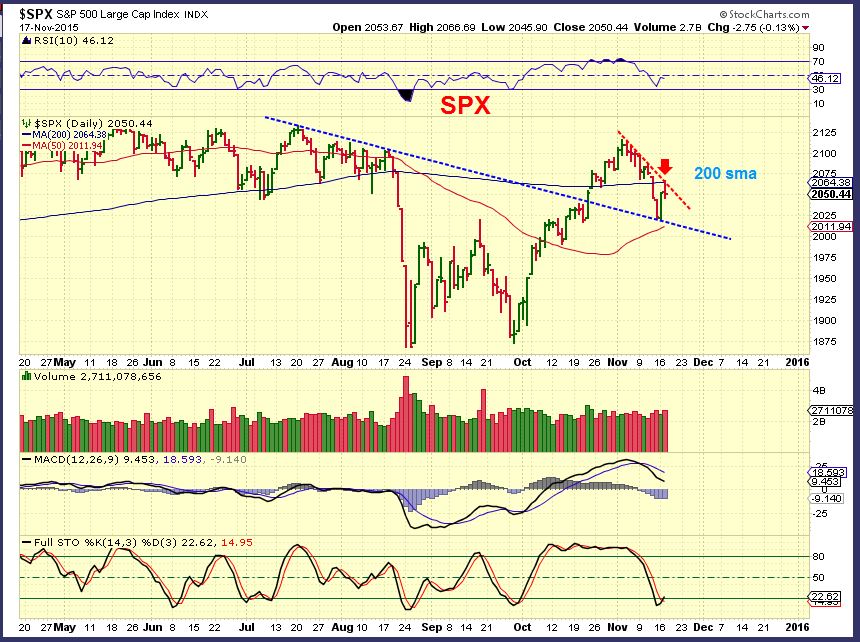
SPX / SPY – Looking for an overhead follow through and within the timing for a DCL. The 200sma acted as resistance.
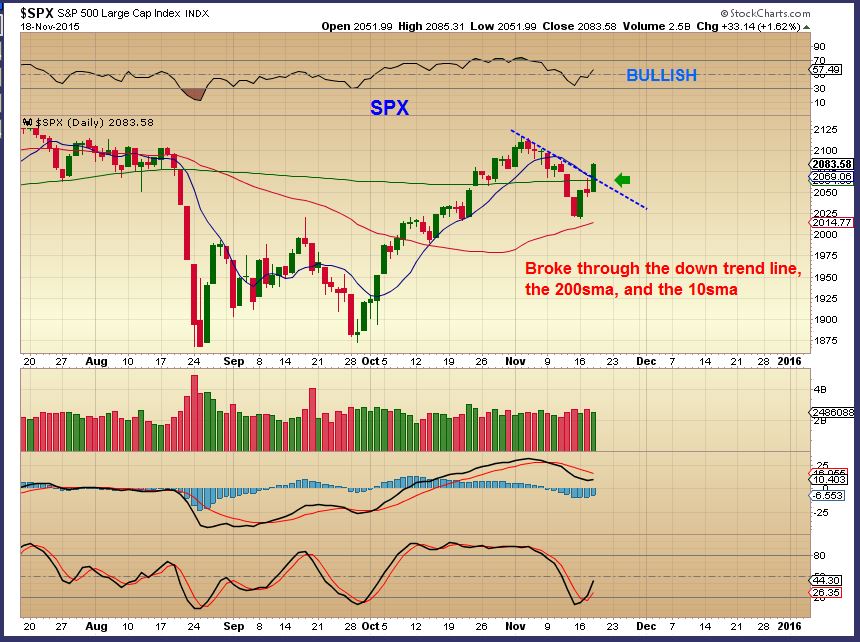
Bullish Break through, I expect higher prices and will watch how the follow through plays out.
The USD looks to be topping ( temporary ) and is late timing wise for finding its dcl. ( No chart)It could drop for a few days into a dcl.
.
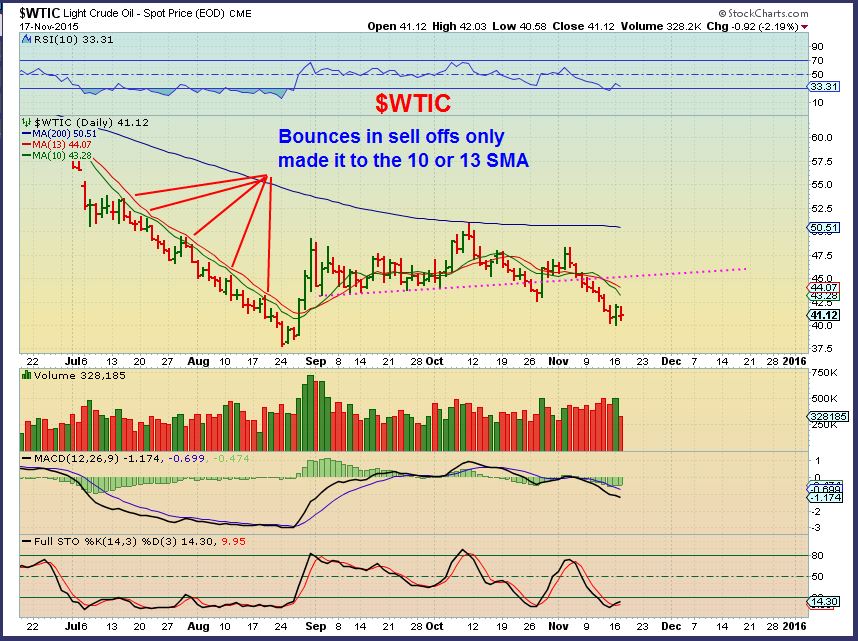
WTIC – Tuesday I pointed out that if you are trading OIL , you should note that in a downtrend, it struggles at the 10sma. I believe we are trending lower at this point.
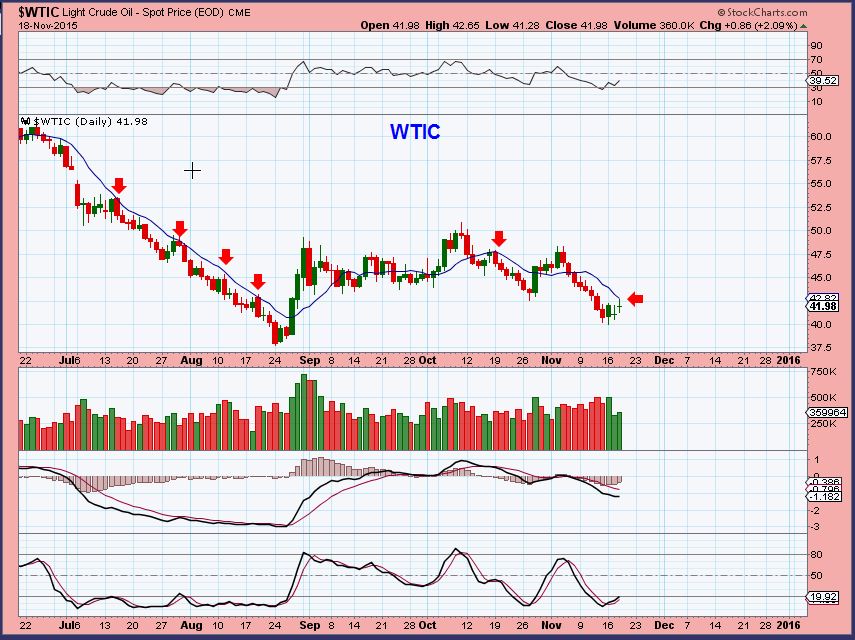
WTIC – So far Oil couldn’t break above that 10sma again.
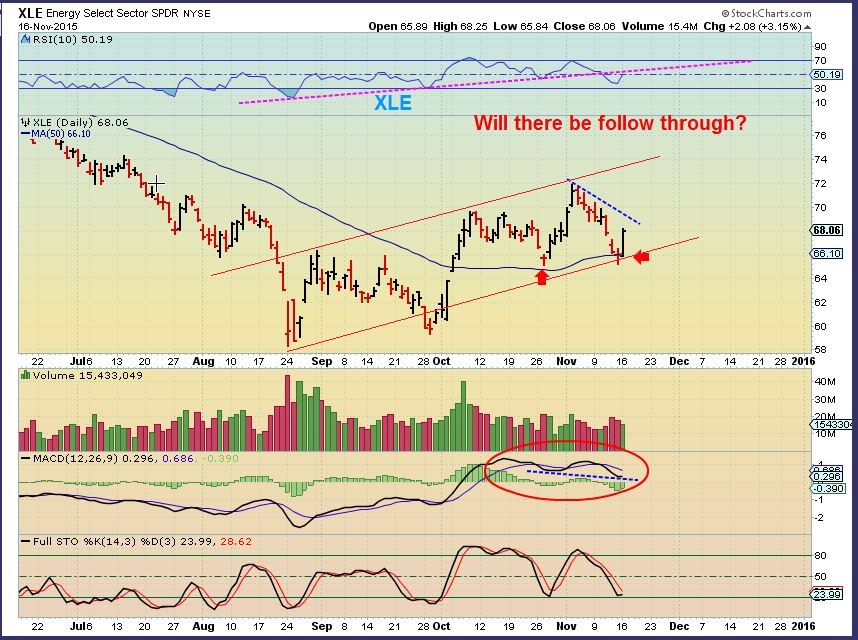
Despite OILS ‘lower lows & lower highs’, Energy stocks have higher lows and higher highs. Odd. They are looking bullish and some are breaking higher after earnings. The XLE & quite a few Energy stocks remain bullish. XLE flipped higher at the 50sma, but again, I thought we needed follow through here too with this Monday chart.
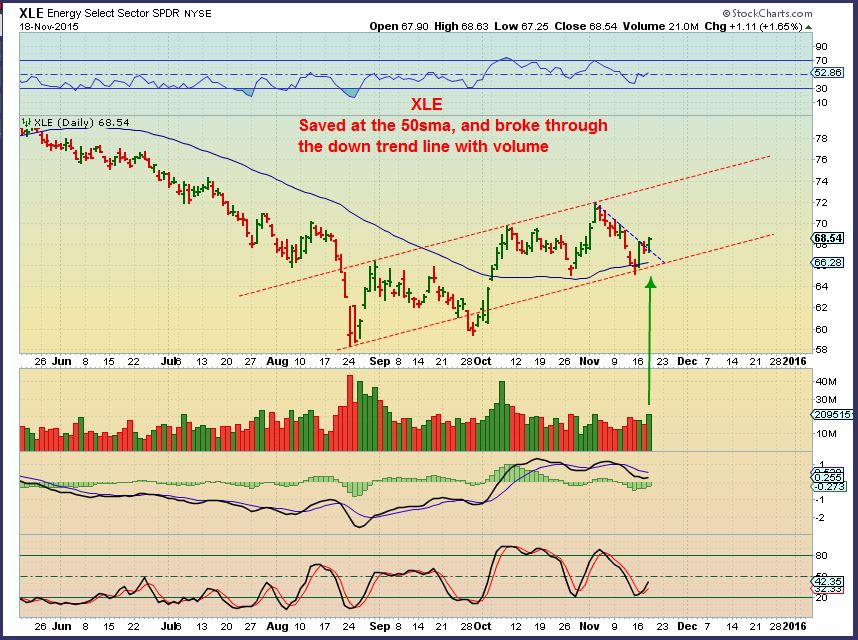
We have follow through. I have mentioned CJES, SGY, OAS, WTI, BAS, etc. These are all consolidating and were all higher after the Fed Minutes. Are Energy stocks bottoming ahead of OIL? They seem to be experiencing accumulation at this point.
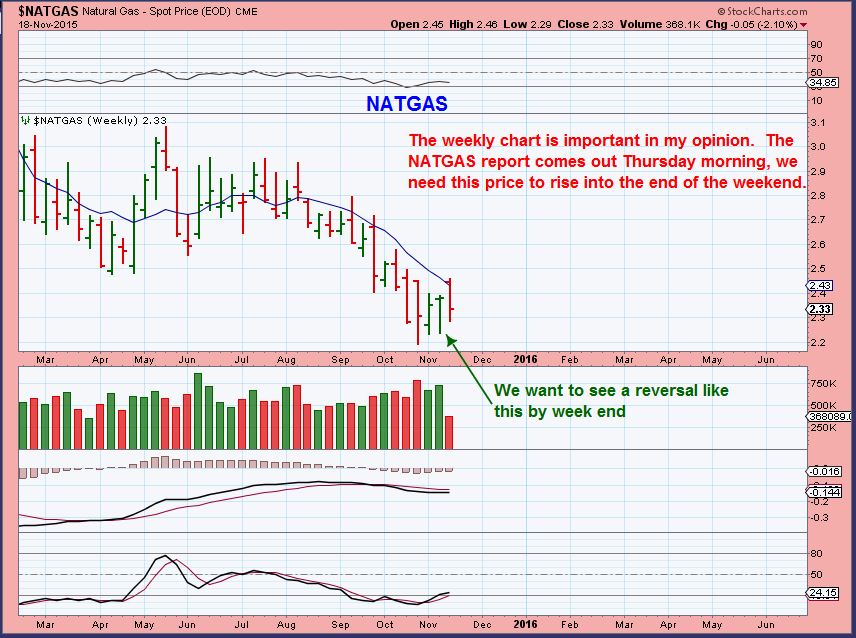
I pointed out NATGAS as improving and bullish looking at the lows recently. I know some are trading it ‘long’, so I just wanted to point this WEEKLY chart out in case I dont post a Friday report. To remain bullish, I would like to see higher prices Thursday or Friday so that this weekly chart improves. Inventory reports are released on Thursday and usually affect the price immediately.
GOLD, SILVER, MINERS
For the sake of avoiding redundancy, please read yesterdays report to know exactly what I was looking for heading into the Fed Minute release. We now have a bullish set up , HOWEVER we do not know if this is an ICL ( Very bullish) or a short term trade that could roll over as a 4th daily cycle. A 4th Daily cycle could roll over in 5-8 days and then break the lows and ‘fail’. THAT would make for a good short (Dust) position. A move out of an ICL may run and then dip lower too, but it shouldn’t fail at the lows. It would put in a higher low and continue higher. NOTE: Lately MINERS have been tricky to trade coming out of the lows , because they bounce around a lot. Lets just look at the charts.
.
GOLD –
We made a lower low early yesterday morning so we couldn’t get a swing low until today. The lower low was on light volume, as though selling was drying up.
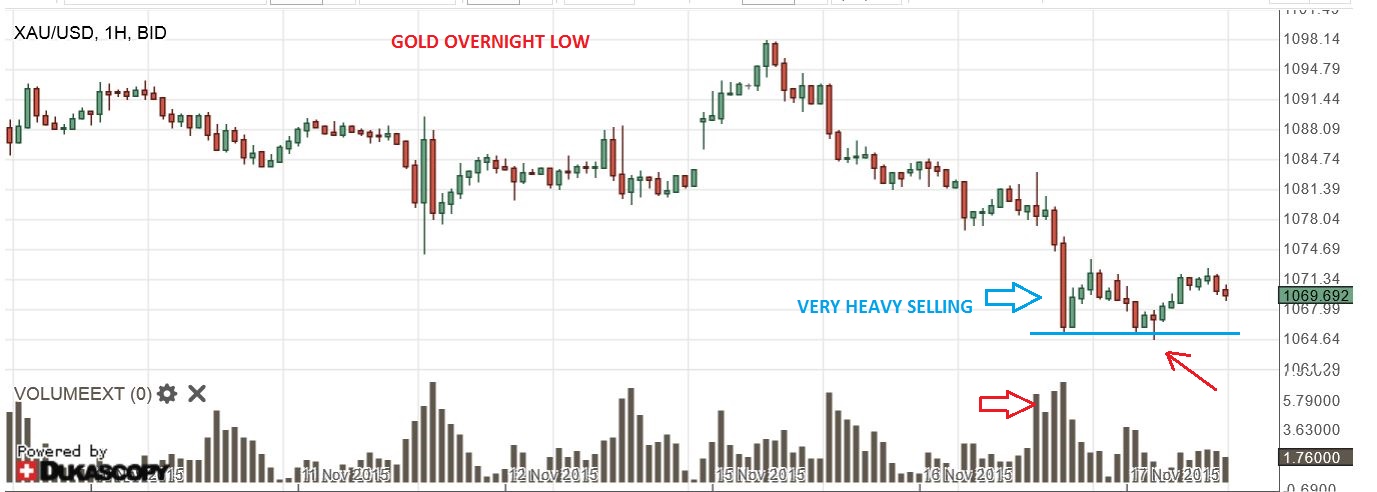
At day 33 , we should expect a daily cycle low (DCL) . THE JULY lows have been broken and many in the precious metals blog-o-sphere went short Miners or GOLD/GOLD ETFs. A Gold price of $1074.60 puts in a swing low that will likely hold. We have that now, I expect a move higher here.
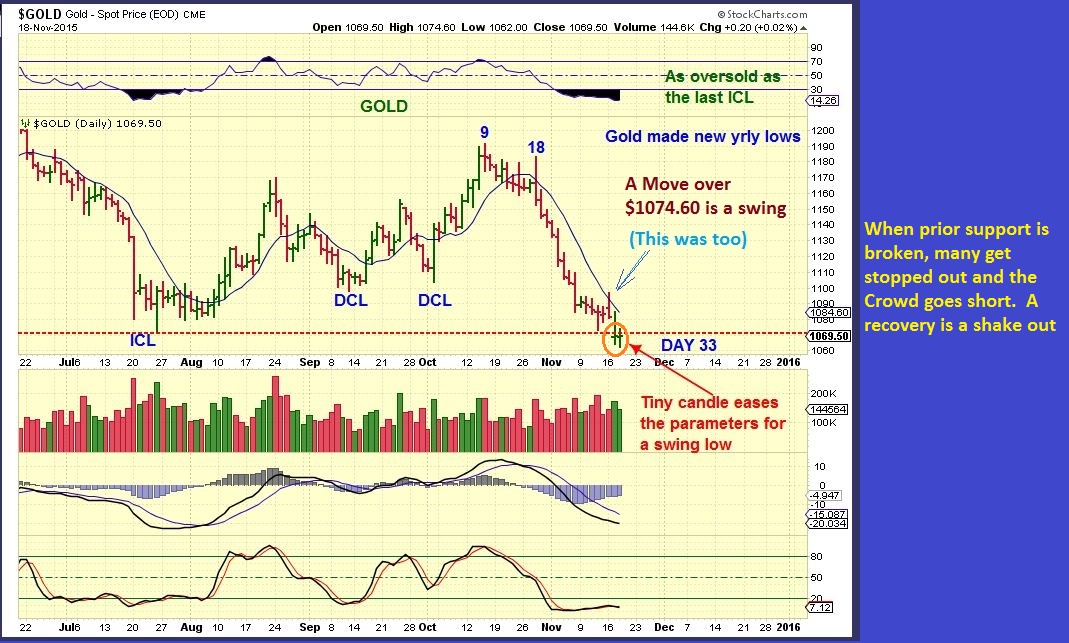
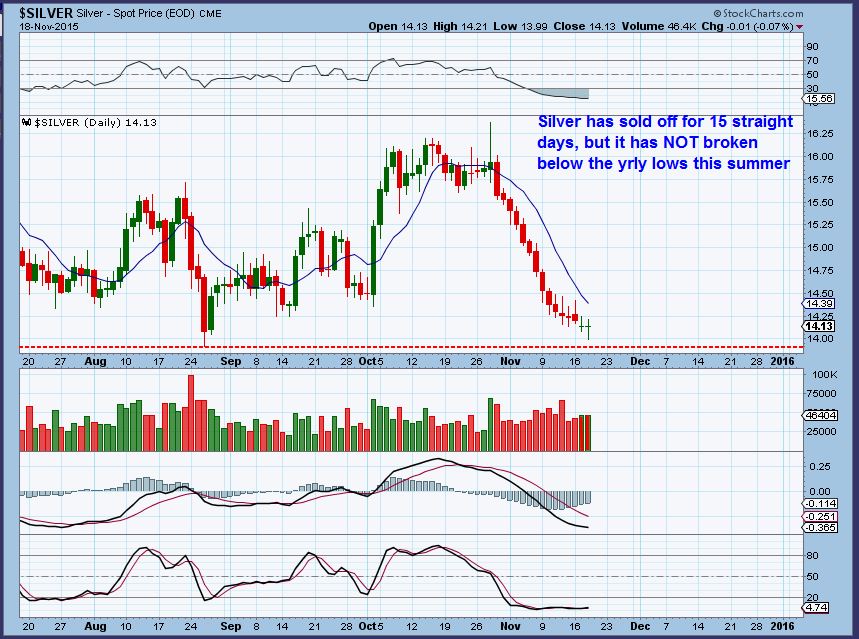
GOLD broke the summer lows, but as mentioned in prior reports, SILVER & MINERS did not. That despite the fact that Silver has been selling intensely.
SILVER – 15 straight days of selling.
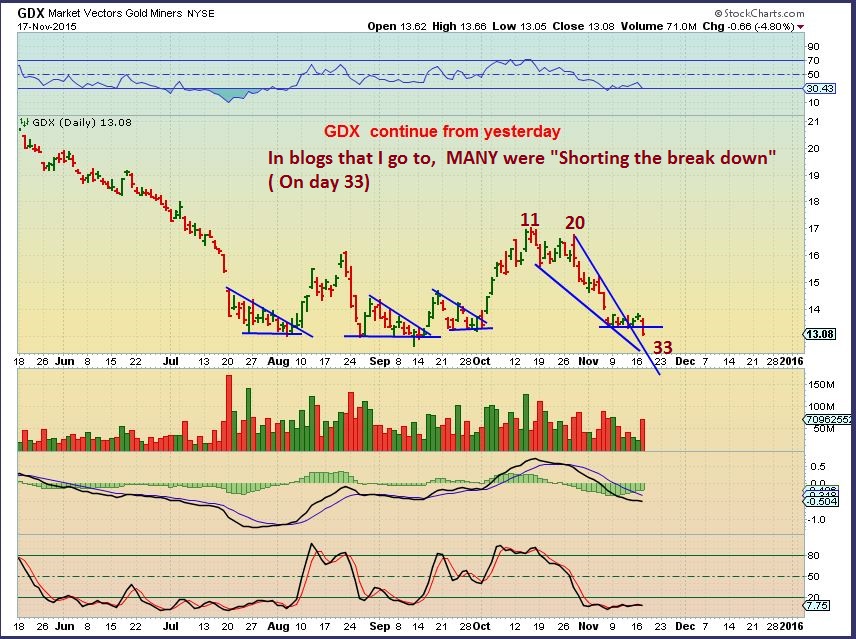
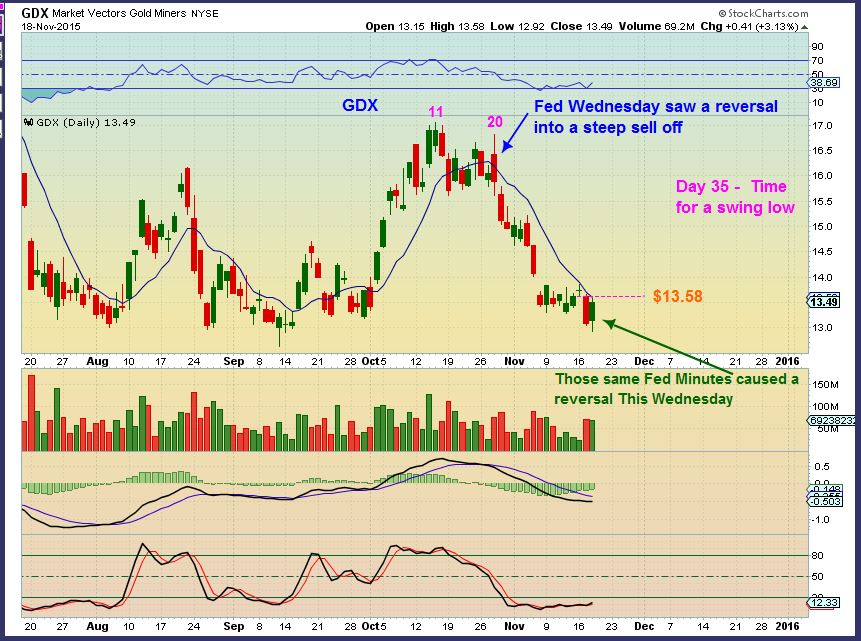
GDX – I pointed out bullish wedge break outs at lows, and the cycle count was late for a low to be put in. We needed a reversal with the Fed Minutes.
GDX – We have a reversal with a new low, so the soonest that a swing low can be put in place is today with a move above $13.58. That is also a move above the 10sma. Please notice that moves out of the lows can be difficult to buy & hold, since they dont always move straight up. SEPT 11 was the last reversal type low, and the next 2 days were sideways and “looked weak”.
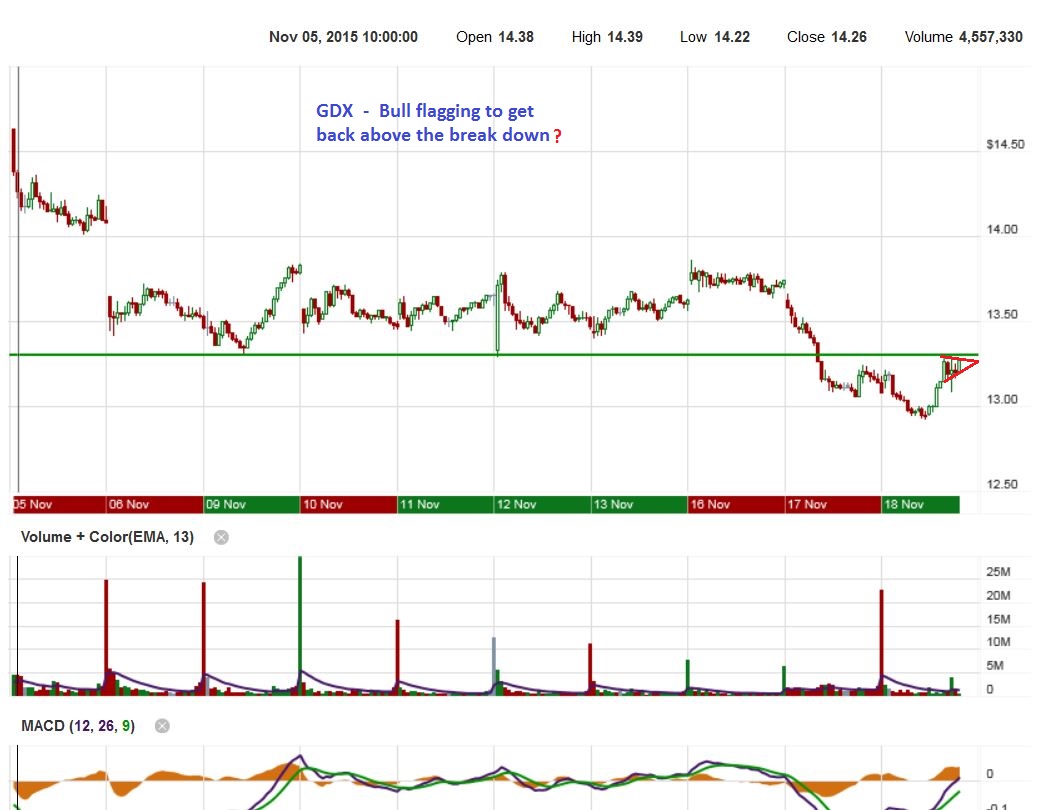
Intraday yesterday, I watched the GDX Bull Flag and posted this in the comments/chat section. It was trying to break back inside of its break down. Shortly after capturing this shot, GDX ran up to $15.58 – It succeeded after the Fed minute release.
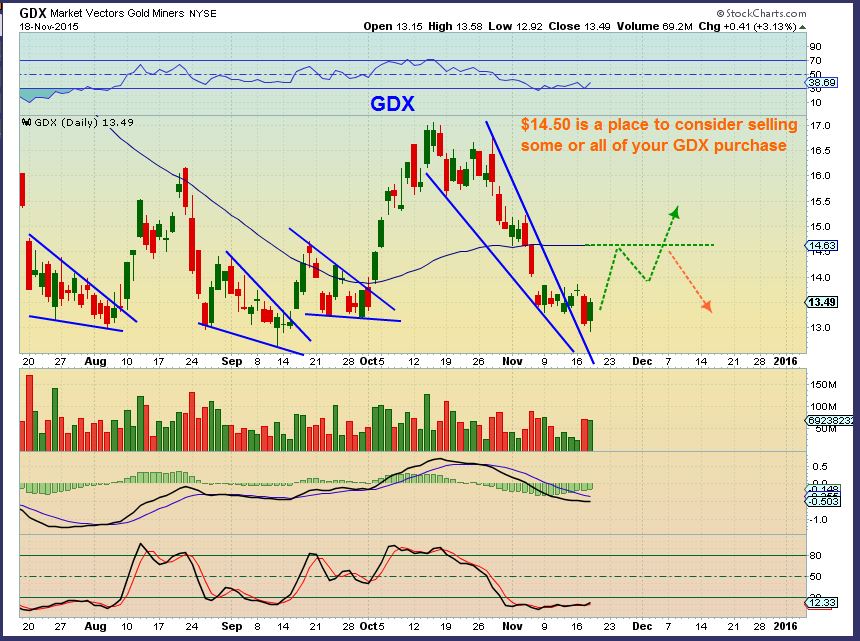
GDX – For those buying or trading this set up, This is what I expect “Roughly”. I am thinking that yesterdays reversal was the short term lows. A bounce or run possibly to around $14.50 is possible to start. The 50sma is there and it is also a 38.2% bounce. Then GDX may drop down and fail if it is just a 4th daily cycle. If it was an ICL, we may see that next dip as the 1-2 move of a 1-2-3-4-5 type move higher.
What do I recommend? I recommend that you re-read yesterdays section covering how tricky this could be. Is it an ICL or a DCL? It may not be something that everyone should accept as a trade. A 4th daily cycle could roll over in a week. You need to know you’re own risk tolerance and trading ability. Even if this is an ICL and you decide to sit this out, you can catch the 2nd daily cycle higher and that is often the best %-Gainer. So …
1. You can buy today if we get a swing low or move above the 10sma on GDX. With a tight stop, you could then sell when GDX gets to the 50sma and watch for further clues.
2. You could buy some Miners , use stops, and monitor them. The Bullish side is that with all of the bearish sentiment and steeeeeep selling in Gold and Silver, many miners are not even close to their ICL ( lows). I am wondering if Miners are bottoming before the metals.
3. You may choose to just sit tight for now. Knowing what we are looking for, you can choose to either go long later for the 2nd daily cycle if this was an ICL or short if we get a 4th daily cycle that rolls over. Again, It is noteworthy that Silver & Miners didnt sell off to new lows this time around with Gold hitting new lows. We may be seeing signs of strength.
.
I found several Miners that looked like nice set ups with yesterdays reversal and others will likely improve too.
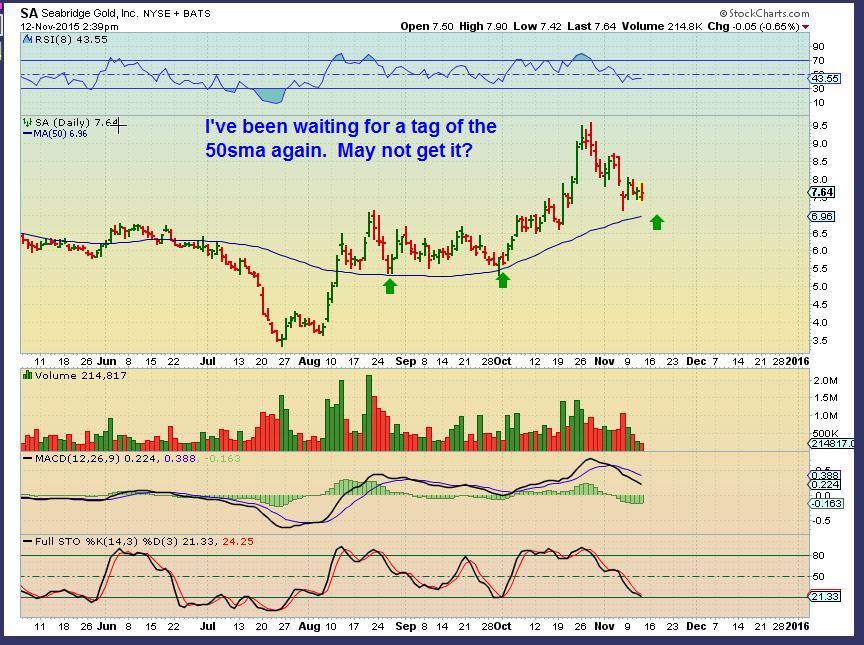
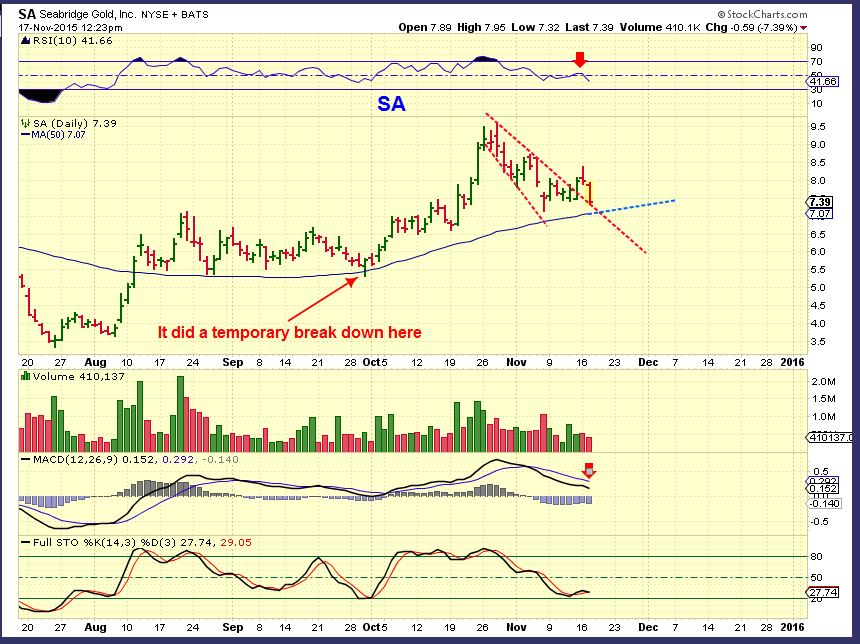
For example SA pulled back, but never became bearish. It held the 50 sma through out all of that selling. See 2 charts below.
This break/ re-test out is bullish. SA could run from $7+ to $10+ ( Why not buy strength like this? ).
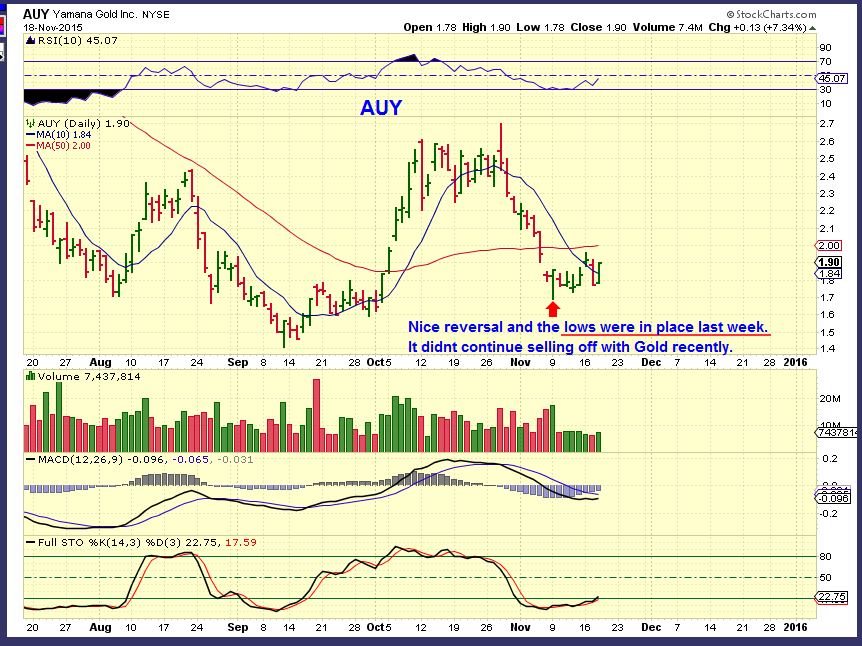
AUY – Notice that it didnt continue to sell off this week with Gold selling off. Sept 11 lows $1.40, higher lows last week.
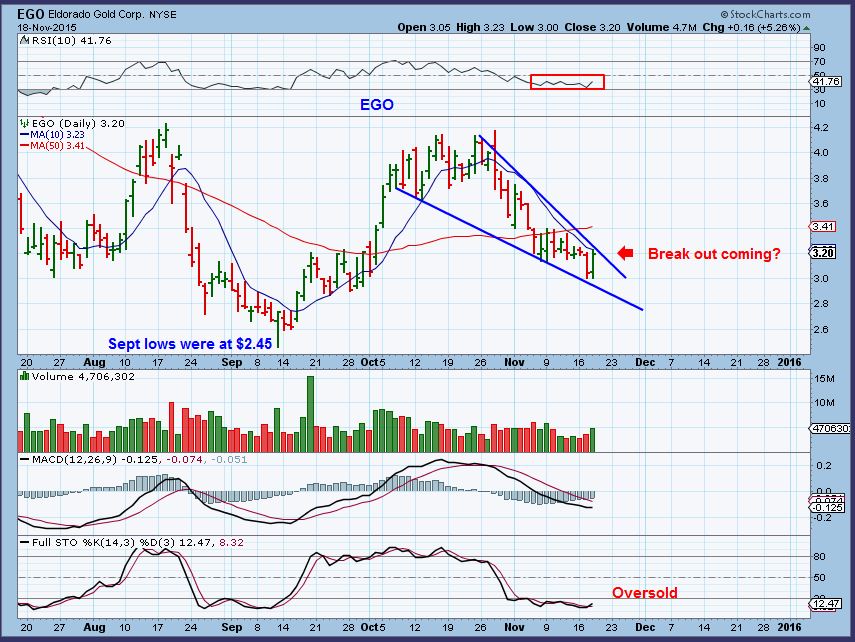
EGO – Higher lows than last summer.
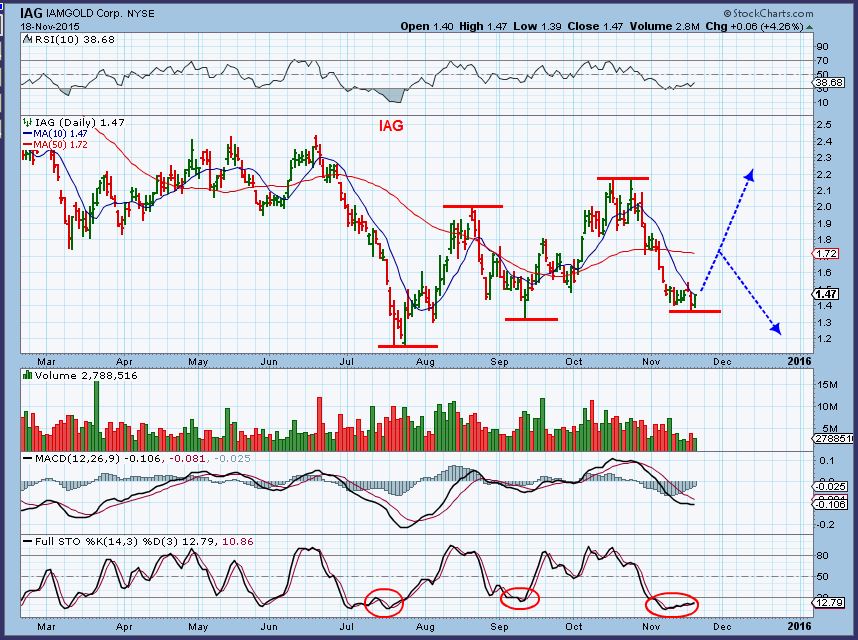
IAG – Oversold & higher lows here too.
There are more like these. That means that many Miners are showing strength , despite the steep continuous selling in Gold and Silver.
.
Also keep in mind that even though we have a bullish set up in the markets, not everything has been bullish. The markets ran back up to former highs, but what about individual companies? It has been very mixed. Some chart set ups and earnings reports are bullish, while others are not. Many past performers aren’t passing the earnings test right now and retail stocks got slaughtered, so its a case of choosing wisely. Look at ( XRT – retail etf) and many retail stocks like JWN, FOSL, DKS, WMT, GME, DDS, URBN, etc. THEY ARE NOT PRETTY. Also looking at some former high flyers, we see that they haven’t recovered even though markets are at highs again. See GPRO, MU, TASR, etc. Bullish charts like VUZI, ANGI, XRX, VDSI, KNDI show improvement after the sell off, so again it has been a bit mixed.
I will discuss more in the weekend report. Todays report discusses what I expect for the last 2 trading days of the week. Miners look bullish here , especially if GDX breaks above the 10sma and puts in a swing low. Then we can review the weekly charts and see what the implications are there. As a trader watching the markets intraday yesterday, I took a position in Miners. I bought a bullish intraday pattern and held on. I expect a run higher, but as pointed out yesterday, I want to stay negatively biased by expecting a possible 4th daily cycle (unless the precious metals sector proves itself in the future). Short term Bullish, but cautious. Again, if this is an ICL, a 2nd daily cycle out of an ICL will be a good trade. I do think some of the Miners charts are encouraging, but we know how fast they can change, so lets at least stay cautious. If you take a position, honor your stops.


Assuming that gold does complete at least a DCL here then one might want to watch the dollar for a tag of the triangle trend line as a possible DCL and sell metal positions at that point.
I dont know…do you really think the dollar will drop all the way down there in this daily cycle? It is already late in the daily cycle and the dollar has been pretty strong,. You are looking at a 50% drop of the entire run up?.
I would say that it can drop there in the ICycle decline, but 50% of the entire run up in this DCL seems unlikely, unless it is topping .
Hard to say, but a 50% Fibonacci retracement isn’t unusual for a DCL.
Actually, Your chart just looked a bit stretched vs the one I am using. The 50sma is right in the 97 area , and I would expect a possible tag of that so I dont disagree. For some reason the chart I use is a bit more compressed , maybe with the addition of moving averages and other indicators.
Based on my read of the daily DXY chart and trying to pull together a few strands of thought I would be watching 98.0/98.25 as a very likely support area if just a DC decline as you suggest Alex. (Prior breakout area and 30 ema which tends to support pullbacks once DXY is trending).
I had a first target of the 97.50 area myself. a 38% retrace and close to that recent break out.
I was then thinking that another daily cycle could double top with a slight break higher and roll over into an Icycle low – but that’s just a guess bases on the way that Gold may be currently lined up.
Sounds interesting and well worth watching for. That idea of some form of double top a bit further down the road had also entered my own mind…as well as many others I would imagine!!
hi Alex,
could it be possible that AUY EGO SLW FVI are forming a reverse h & s formation ?
your thoughts on this ? is the voume right for that ?
It is something to anticipate, but you’d have to look at volumes as it approaches the neck line to see if volume is setting up correctly.
I have liked the look of a reverse head and shoulders for EGO for the past week or so and have bought it because of it. It still has not broken out of the right shoulder yet but if it does should go to 4$ short term. SA looking good today!
Sure is ( refresh)
An excellent summary of situations Alex IMHO. Love the way you have weighed the pros and cons depending on trading style time frames etc. Really helps in keeping proper perspective on current events. Thanks as always.
Thanks Chris,
I know that there are many different styles of traders here ( You have said that you look for trends for example) so I dont want to give conservative traders the idea that they have to be in it to win it today. If an ICL is in place, the 2nd daily cycle can be quite rewarding without the stresses that can come at lows with volatility.
Thinking of us slightly longer term traders/investors…and more conservative ones!… is much appreciated Alex. Lol And as both of those your suggestion to even potentially wait to see if there is a 4th DC or not and if not, look to enter at the next DCL is spot on. Or maybe enter a half position now and add if the set up looks right a few weeks down the road. As you say we have to decide on our own risk tolerances etc but your comments help a lot. Thanks again.
KBIO…………..
..rockin trade on NUGT CF … rockin…
Thx Maria…now the harder part, where to lock in some gains 🙂
GDX 15.27 or 61.8% retracement of the run down. My bet!
… is that what your harmonica says? i was actually just thinking about it this morning…
Oh My! You’re thinking about my Harmonica! 😉
giggle… why yes actually …
… i have so much to say, but alas, duty calls. Will have to check in after work.
Oh my … it’s thirsty thursday, isnt it … yay
61.8% was the last run up out of a similar pattern in GDX, then it sold off for a while before resuming a leg 3
Makes sense. I put my money on Bill’s harmonica today.
;o)
… he hasn’t had it on display much – of late; actually can’t even remember what it looks like.
remember the good old days when he used to swing it around.. going short then long….
GFI strong
Wow, nice %-Gainer there
So which way does this break? https://www.tradingview.com/x/o4VHfdp7/
I’m asking because I don’t have a clue. Looking for more experienced TA people for help 🙂
I was looking at the same thing T-5. I think I had one in ERF too.
I cant tell yet which way, but the weekly chart improved too, with the MACD steady and price regained the 10 MA. I feel that OIL is weak and energy stocks should drop, but they aren’t. Very tricky, but the set up looks bullish. (Wait for a break out, but if you’re in it….keep a stop).
WG, XCO and others look similar. If we didn’t know oil was weak what would we do here? I ask myself this question.
I know –
I have already been trading them knowing oil was weak.
I know what I’d do if OIL was strong 🙂
Thanks! I’m not in at the moment. I got out of oil stocks last week and am currently short oil based on your report backing up my research a few days ago. I have it on a tight leash but I figure we at least visit the August 23rd low ($37.75 I believe). Your target of $26.09 looks reasonable as well. I posted a seasonality chart for oil a while back as well. Doesn’t get favorable until the last weeks of December. Everything (including cycles) looks lined up for further decline but I always like hearing other view points such as Bill’s. Have to think about all the possibilities. That is where I really appreciate your reports and everyone in the chat. It helps to give a more rounded picture.
Oil is indeed weak while Euro is having a good day
Picking up nicely as I hoped it woud with a stronger Euro. Guys, if Euro is a failed breakdown this could be very big for oil and PMs. 1.08/09 would be what we would want to see
ALEX…. you said: “HOWEVER we do not know if this is an ICL ( Very bullish) or a short term trade that could roll over as a 4th daily cycle. A 4th Daily cycle could roll over in 5-8 days and then break the lows and ‘fail’.”
Question I now have is: Is this a ICL or a 4th DC.?
Thank-you.!!!!
Hi Geurt. Not to try and pre-empt Alex’s reply but I’m 99.9% certain he will say we don’t know yet. If the current low (that appears to be developing now) is the start of a 4th DC then we will likely only rally for 5-8 days and then gold will top again and break the current lows. If however, it is an ICL then the next rally should move higher for longer and the next low will be a higher low. I think that is the point where Alex suggested would be a good entry point for more conservative/ longer term traders. I don’t know if you recall posting a chart here on 10 Nov, which had a Neural Net Cycle Forecast for Gold? Well I still have that here on my desk for which I thank you and we are now very close to the target date of 25 Nov when they expected another low to form. Furthermore, based on the forecast in that chart you posted they had the next peak as 15 Dec and the next low on 1 Jan BUT as a higher low. Therefore, if that forecast proved correct then as that low formed at the start of January and at a higher level as that forecast suggested, then at that point I believe you would have confirmation that this low was indeed an ICL. A conseravtive trader/investor could wait until then whereas someone willing to take more risk for hopefully more reward could look to buy this low now (with appropriate stop losses) and aim to ride this next cycle up. But if that forecast you posted proved to be wrong and there was a 4th DC to come you would have to be prepared for a possible top just a week or two away and then sell again accordingly as the ICL would still be to come. I hope that helps?
We dont know yet 🙂
Now I’m 100% certain! Lol
Thank-you Chris for your effort and…. you explained it very well.
For sure you do a better job then this simple man.
I like always your response to whom you even write.
Chris… THANKS >>>
My pleasure Geurt especially if you found it helped at all. I’m sorry I can’t reply in Dutch but thankfully your English is excellent. The chart I mentioned was from weiss research and unless they have changed their views is making the current situation especially interesting. As a more conservative and longer term trader/investor I am still watching and waiting although I may take a smaller trading position when I get a buy signal on my 4 hour chart. I’ll post that when I do in case you find that usefull at the time.
Yes Chris… it was helpful. Weiss-research said yesterday Nov 18
the following messages to me:
I just received great news:
My cycles charts are now confirming that early next week is likely to be the ideal time to take our first long positions in precious metals!
Thank you Geurt. Funnily enough I am on their site at the moment reading some of their free articles. I see they are sticking with the forecast you posted a couple of weeks ago and based on their forecast they definitely see this as a MAJOR low in which case it would be an ICL as well. But we will only know that for sure once we make a higher low in the weeks ahead. I am thinking more and more that I will take some long postions at this low and just make sure I have stop loss levels worked out when I do. I have also added a little more physical silver today to some holdings I have been building up since August. This is very much with the long term in mind and am building holdings of physical gold and silver as an alternative to cash in the bank, which I really struggle to trust!!
Very good Chris…. instead paper money, have real money at your hand. And Chris….. don’t store it at your bank.
Blessings Chris.
Totally agree Geurt. This is held in professional vaults but NOT bank vaults, so hopefully it will be safe. But who knows!!?
50 years since silver went down 15 days in a row, heard that on financial media earlier today, finally broke the streak. Holy Crap!
So, here is what I did, grab a tester position in GDX with a no later than exit of 4 Dec (2 weeks), looking to trail stops. Won’t matter if this is DCL or ICL, if we hit my target or drop to stop or get to 4 Dec, I’m out. Then with the additional info can assess if we rolled over or started next ICL and trade that accordingly.Basically, I don’t need to know. Not yet. Just that we got confirmation of at least short term low today.
UNG.. blimey! (Cason.. hope you got out!)
(a double bottom to buy though?)
I was looking at the NATGAS wkly chart last night ( In the report) and I knew they had inventory report today and I seriously thought…
“The Bigger picture is this weekly chart and its not out of the woods by any means. Its actually bearish right now.”
I figured Thursday and Friday would finish that chart . NATGAS down almost 4% today. I think today may have finished it . Ouch.
The importance of stops.
yes indeedy… i was all sad face last week when i got stopped out & it shot back up.
as of now.. not so sad face
Yikes! Yeah, what happened? It looked good at first and then it just fell off a cliff this afternoon. The inventory came in below expectations (bullish) and weather is turning much colder, then it sank. I quite heartily disagree with the price action today, but that doesn’t matter at all does it?
I had just a small tester position in BOIL. Thought we could slow accumulate here but alas, back to the drawing board. Glad I didn’t add yet as I had originally planned.
Trolling Stocktwits I saw that Goldman Sachs re-iterated their natgas call. But that was already known so wonder if that caused the sell off? It was ok then pretty stark. I’ll be mad if that was all stupid (non) news related. B/c it really killed the technicals. We closed 5 cents below the 20-day. Stochs turned down pretty good. So, I can’t advocate bottom fishing here.
BAS, is OBV building? While the stock treads water over the past week maybe accumulating. What has oil done in that timeframe? BARF!!!!
Hi Cason
What’s obv pls?
http://stockcharts.com/school/doku.php?id=chart_school:technical_indicators:on_balance_volume_obv
Many thx Ray. Concept known but not the acronym, till now.
I believe he is pointing out the ‘On Balance Volume’
Yep, they got it. On Balance Volume. Up volume stronger than down while basically treading water. Accumulation? With oil down? Looks good considering.
But then check out GDP? New all time, lifetime, forever lows!!
Anyone want to guess take-aways from this chart? Probably not. I don’t post until too late and this thing dies out at 4PM. I miss all the fun! 🙁
HMM, Would you consider that a bear flag?
Potentially! But that would be BAD! Main take away I got was that as SPY went back to highs, volatility didn’t melt off with same velocity. Second, lack of contango showing a flattening VIX futures curve.
Oil hanging in there. Doing something simlar to PMs and Euro. Broke below support and slowly slowly breaking back up. On verra.
I had bought in to the potential that this was an extended daily and a stop run, but no more. It just took too long. If it was stop run would have taken off by now, so I’m pretty bearish on oil. Doesn’t look like it wants to crash straight down but certainly wouldn’t think of a long here.