
Was That Smoke & Mirrors?
Did you see the Dollar rocket higher 1.38 and not send Gold, Silver, and the Miners to their knees? Silver and Miners actually closed higher, so that was like a crazy illusion. And then AMZN reported a profit and shot up $70 in after hrs, MCD, GOOG, and MSFT are up big in after hrs after the markets already broke out higher today. Lets check out the action…
.
SPX – The SPX , DJIA, and NASDAQ broke out today, but the BIIB, IWM & IWC lagged seriously.
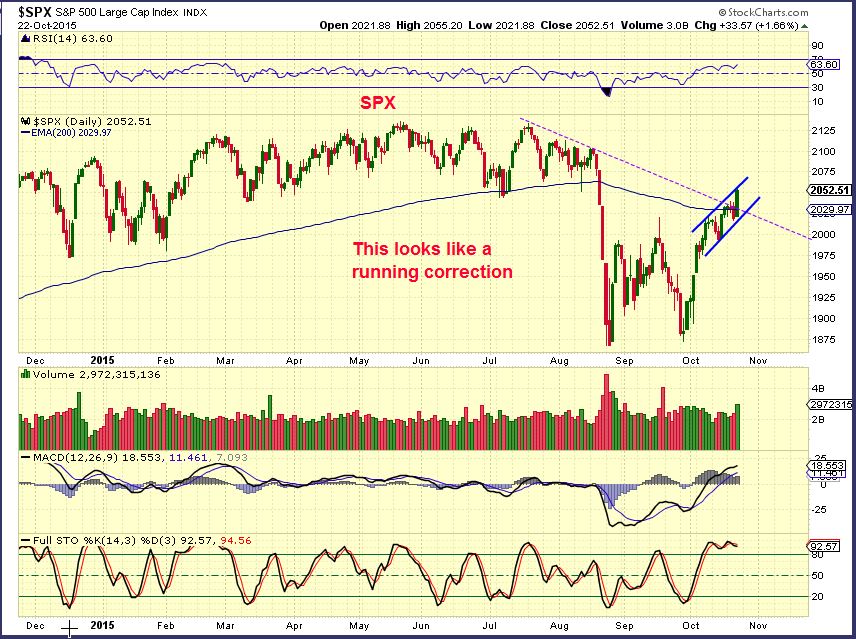
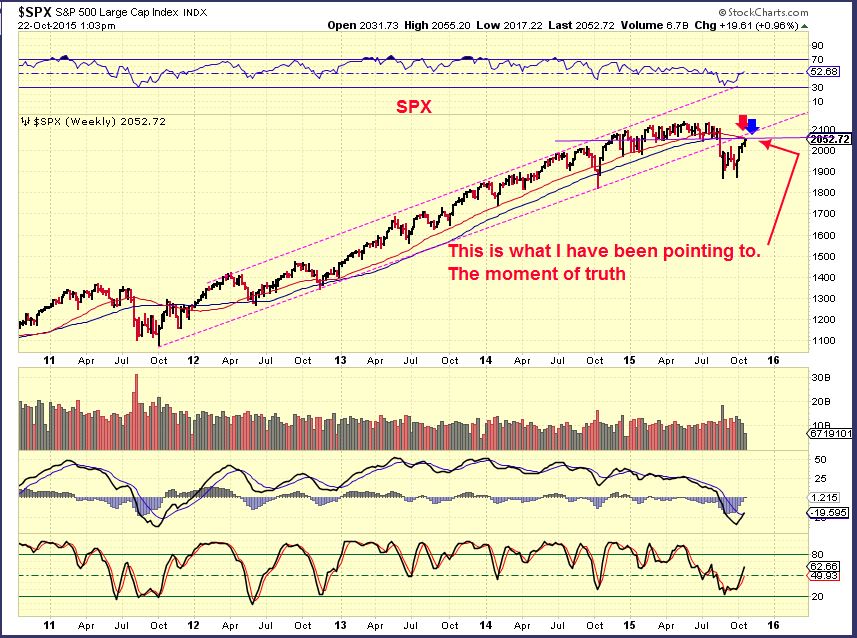
While that first hurdle of resistance was taken out , I’m still looking at this longer term chart. On a weekly basis, can we break back above and recover (That would be very bullish), or is this just a back test of the break down?
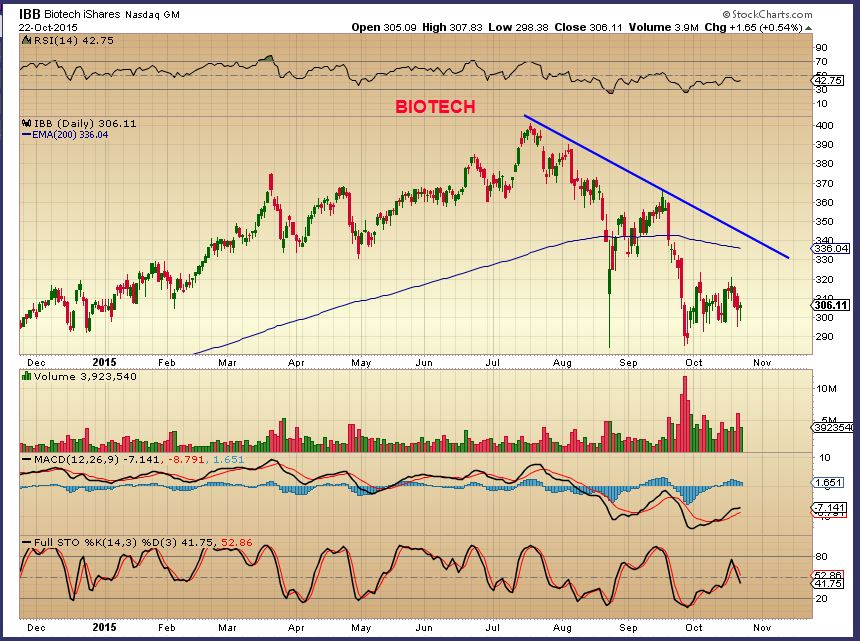
BIOTECH is also not recovering at this time. Maybe we are going to see sector rotation where former flyers take a rest and other areas get some attention. Possibly Commodities will start being accumulated?
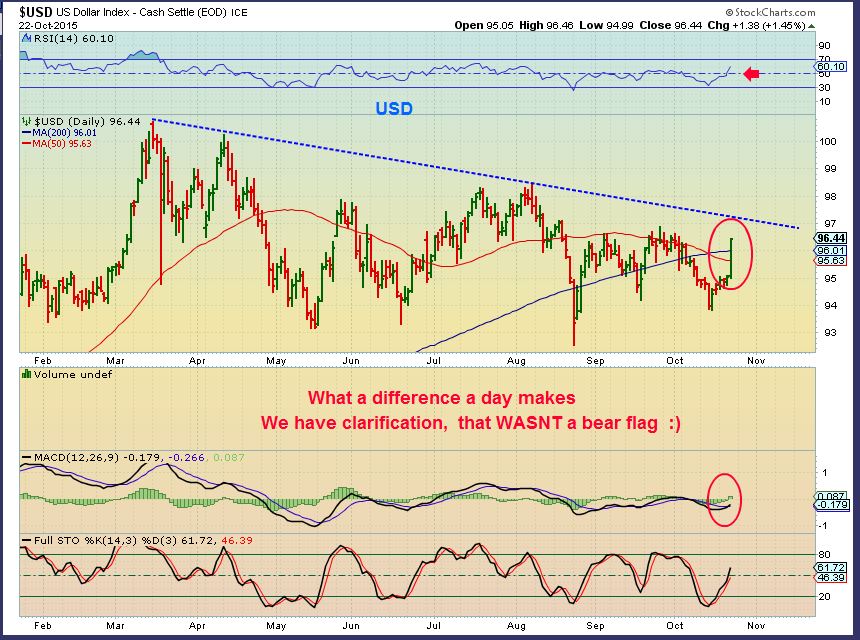
$USD – This was looking like a bear flag….BAMM! This is a bullish looking set up presently, lets see how things follow through.
WTIC – I circled this candle as a possible Inverted Hammer. I will explain later why, but for now it has rested on the 50sma and it is due for a daily cycle low.
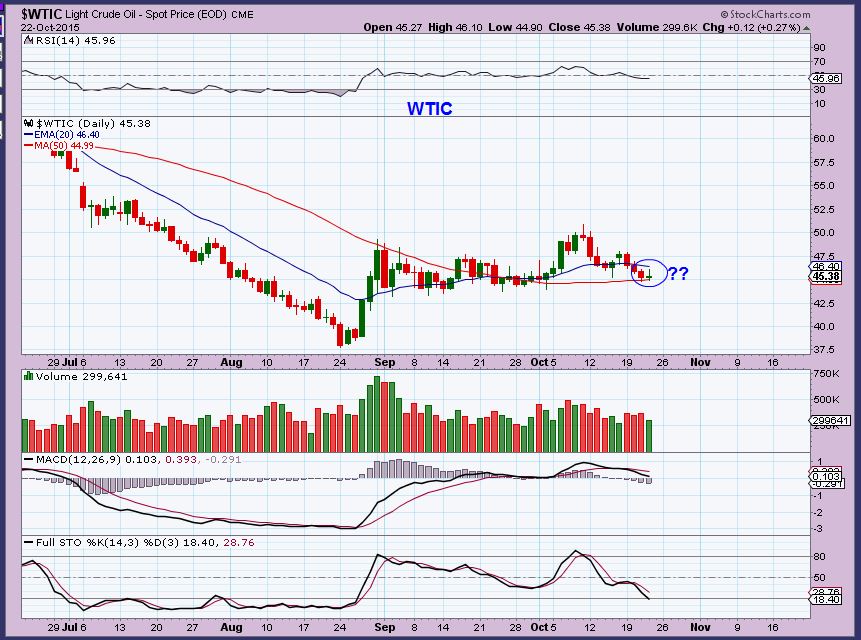
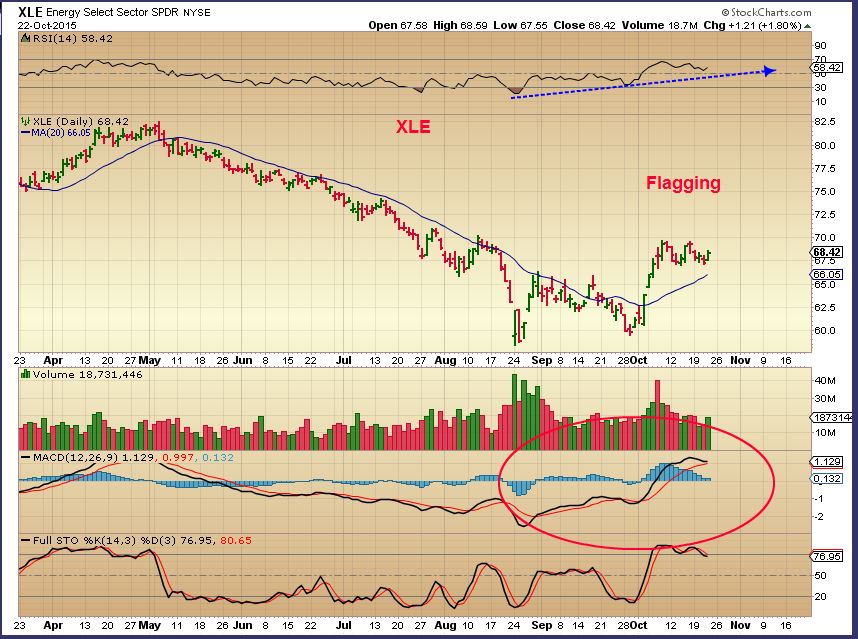
With OIL possibly putting in an inverted hammer (bullish), many Energy stocks still look like ‘ready set ups’ to me.
XLE – It is not pulling back
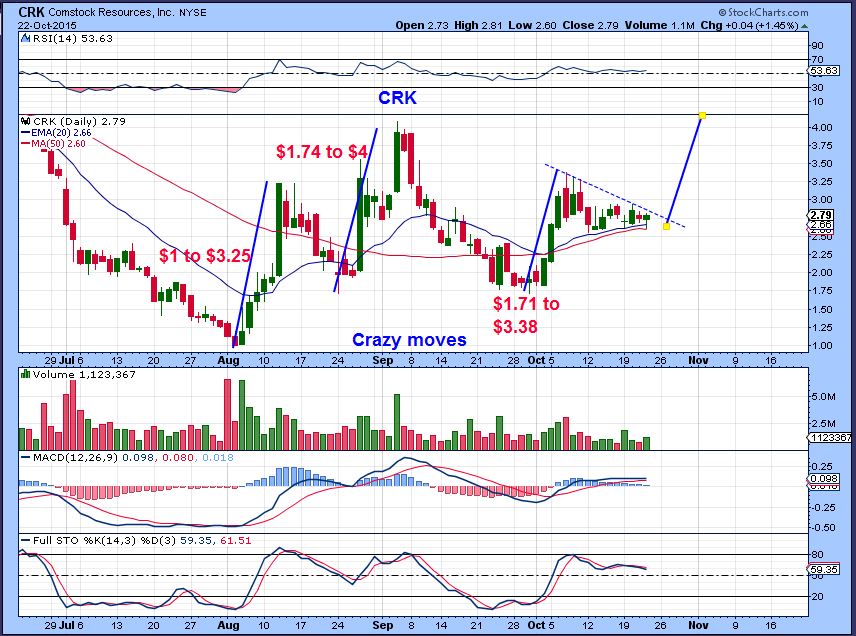
VLO , HAL, CRK, CJES, EXXI, many others look like they will take off higher when Oil bottoms. I pointed out HAL yesterday and it continued higher today . I bought CRK for a quick trade today , but held on to it since it closed up near the days highs.
CRK – Makes HUGE moves when it goes, let me review that here. It tripled and doubled on each run. My stop can be a bit below todays lows.
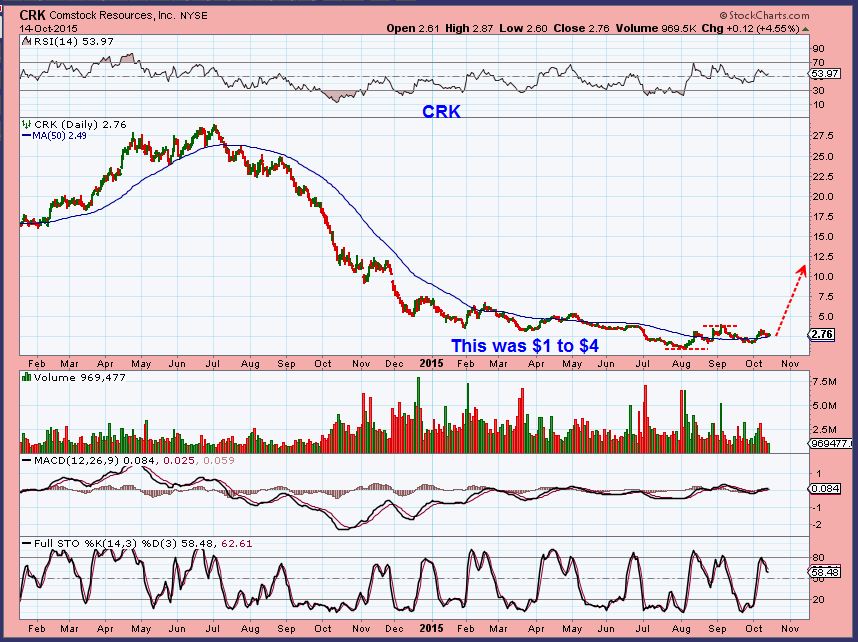
CRK – This was the longer term chart that I pointed out earlier this month. A whole different perspective if Energy stocks recover.
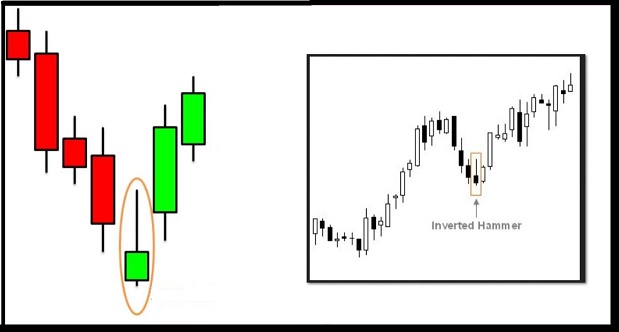
Lets consider this a mini-lesson
Let me show you an inverted hammer candle that can happen at a bottom. The stock is selling off and suddenly runs up during the day and then sells off back to the lows. This disappoints many, who think that it is a sign of weakness. If it moves higher the next day, it could be at a low.
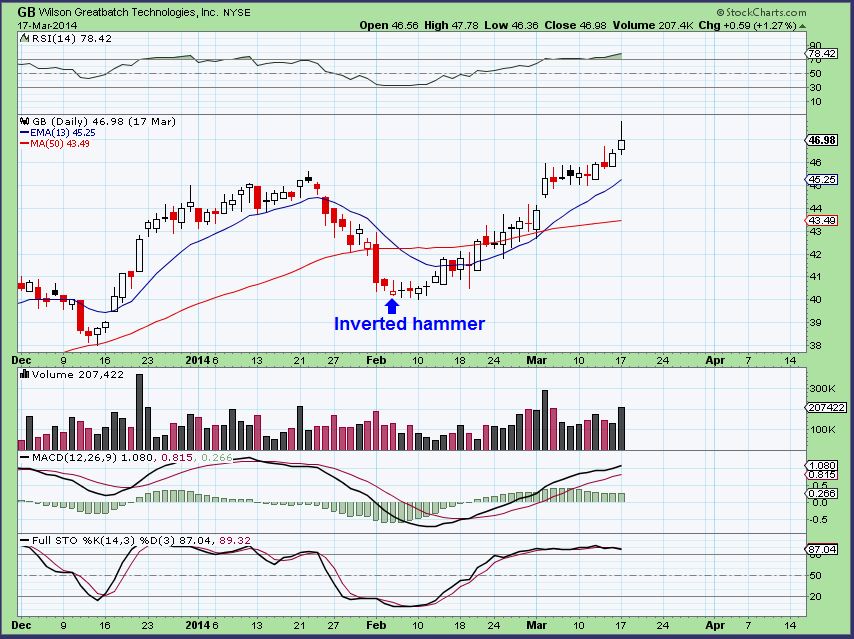
Here is an example of a company that had one after a run higher and a pullback . On Feb 5 we see that inverted hammer and if that was a sign of weakness, it would have continued lower the next few days, right?
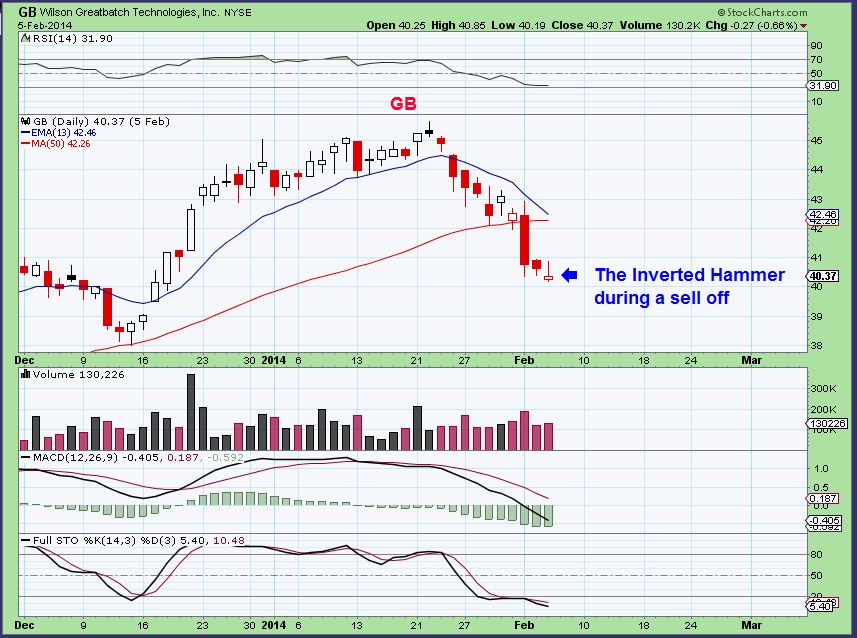
GB – Notice Feb 5 onward. Note: It can go straight up the following day, but in this example it went sideways and then higher. The lows were in.
My point?…
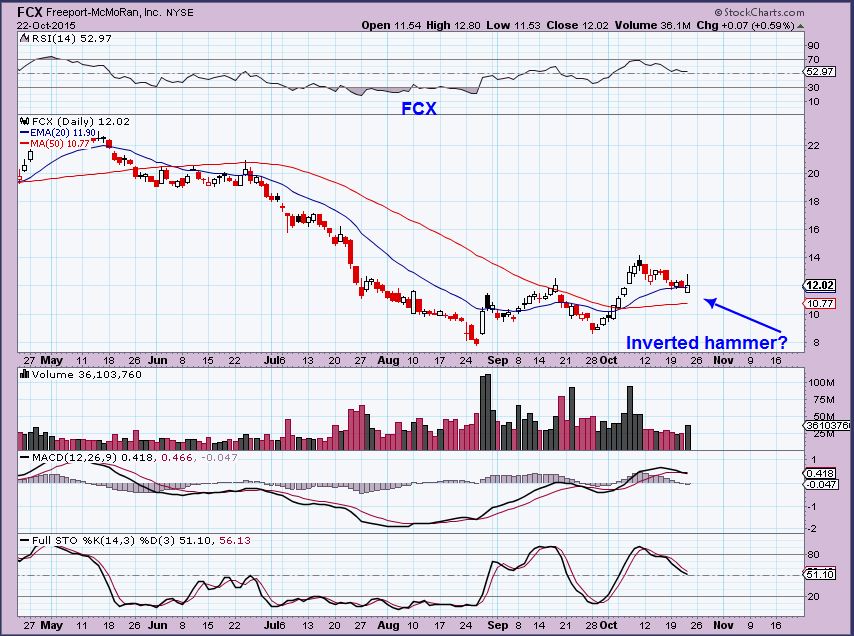
Maybe OIL has an inverted Hammer today, and I saw plenty of other stocks flying upward and then sell off into the end of the day.
Notice FCX –
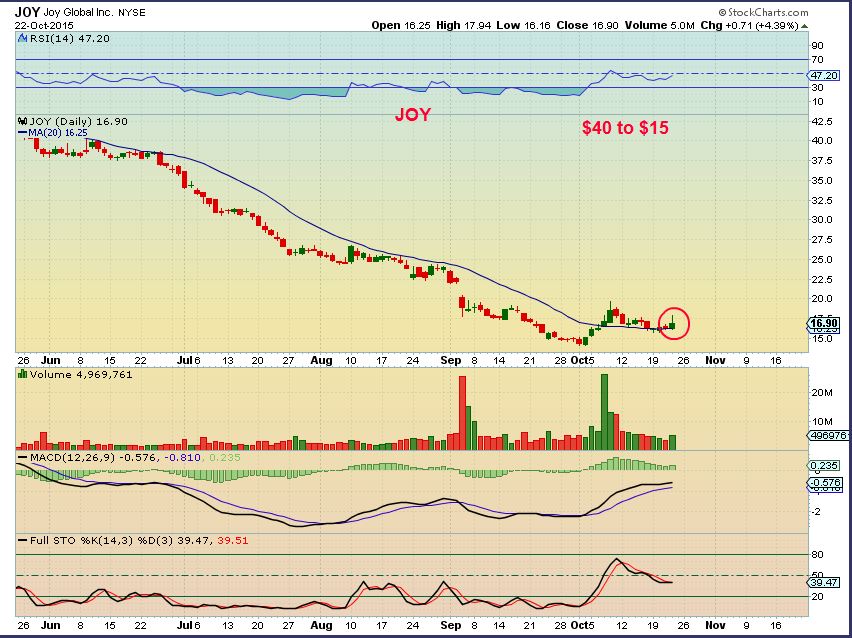
JOY
See also AA, NOR, BOOM, (maybe VALE). Maria mentioned a few industrialsin out comments / chat section and URI and GLPW were pretty impressive today.
GOLD, SILVER, & MINERS
I dont know what to say. With the Dollar acting like an absolute Rocket, Gold Silver and Miners usually get slaughtered. Gold was down 70 cents and SILVER & MINERS were green. WOW.
.
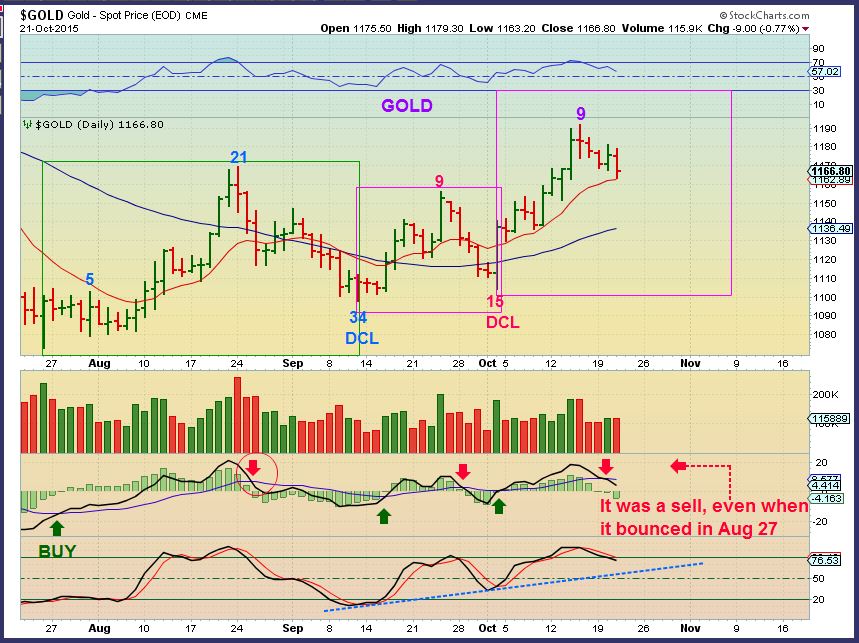
GOLD – This is a view that shows a possible short 2nd daily cycle that was still Right Translated, and a 3rd one that started on OCT 2. I have entertained this idea for a while ( GOLD & SILVER looked like new DCL’s on OCT 2), but I dont know if it is correct. Cycle-wise Gold is a bit confusing. This would explain a bullish view of Gold, with the Dollar not affecting it. It matches my idea of GDX in Thursday mornings report.
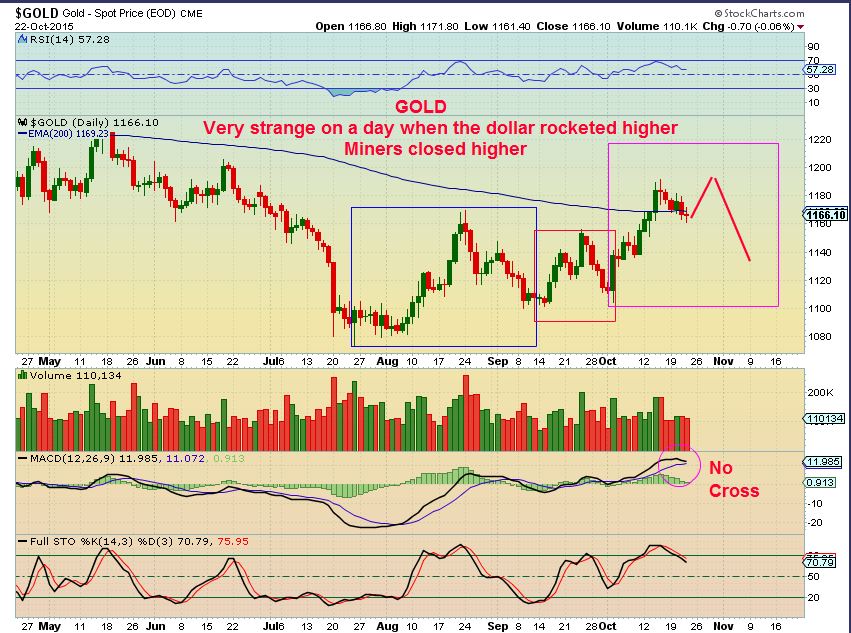
GOLD – I drew this version of it Wednesday night an did not put it in the report. I used the GDX version instead. Even though Gold looks bullish in this chart, I stated in prior reports … “This isnt a low risk buy, but it is a chance to sell Miners higher and try to get in lower with the next DCL”. Gold could simply bump higher than day 9 and then roll quickly over into a dcl.
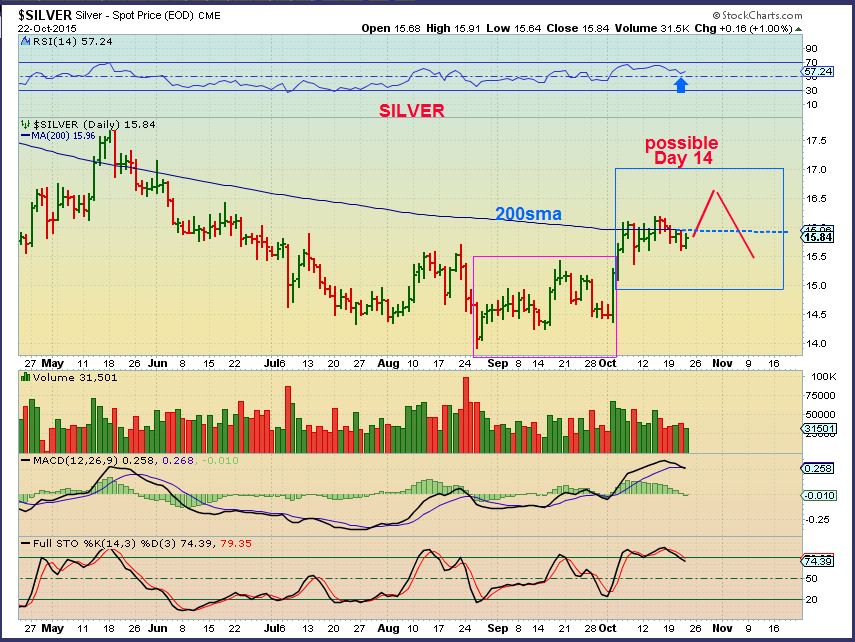
SILVER– Silver closed GREEN with the USD rocketing higher. How can I explain that? I have to assume that there is strength building at these 3 yr lows and maybe we really are seeing a change of character. I would picture a break above the 200sma and then many Gold Bulls would jump in – it could then roll over. A sucker type move possibly? ( This is all guess work from here friends, I truly was amazed at the USD rocket so much in 1 day and see the Precious Metals standing strong).
GDX – This is what I have been saying for a long time. Remember this chart?
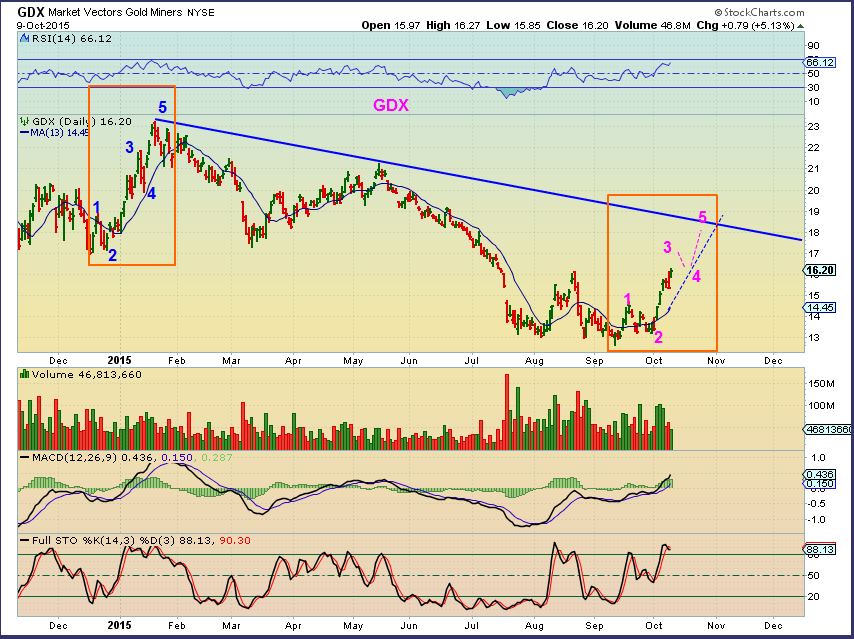
GDX Currently – Will we get that one more Pop? It was up almost 2% with the dollar rocket. This looks like it is on a 2nd daily cycle, but can it really be so different from Gold?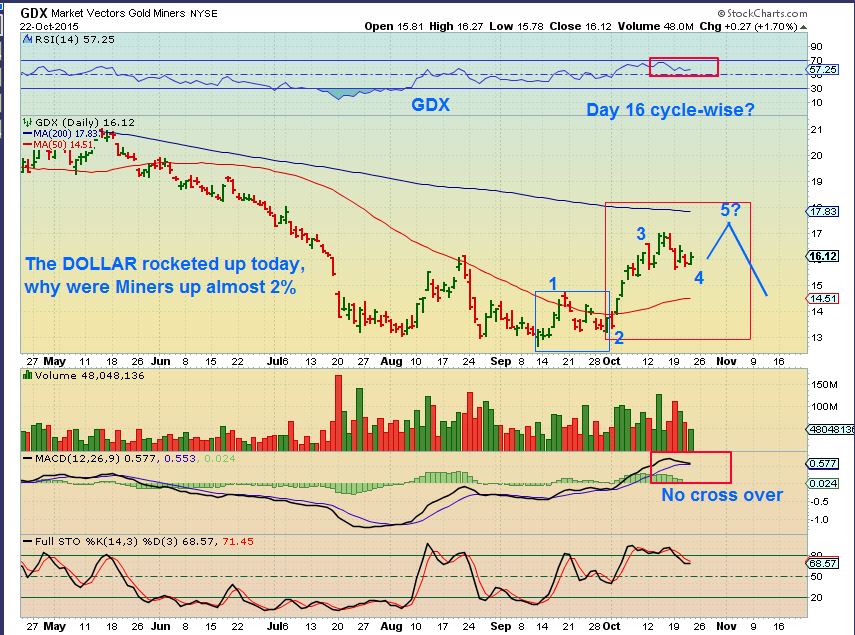
GDX & GDXJ looked bullish today with a strong dollar. Looking at a few individual miners, it is apparent that they are holding strong. This could have very bullish implications long term, right?
Do these look weak, crushed, and broken, with such a strong move in the dollar today?
We may be seeing an interesting change in character here. Major bottoms are difficult to buy & hold due to volatility , but if we are seeing true bottoming action in Commodities and Precious Metals, the gains over time could be VERY good. We are currently seeing 100% moves in some areas and they are still at there bottoming area.
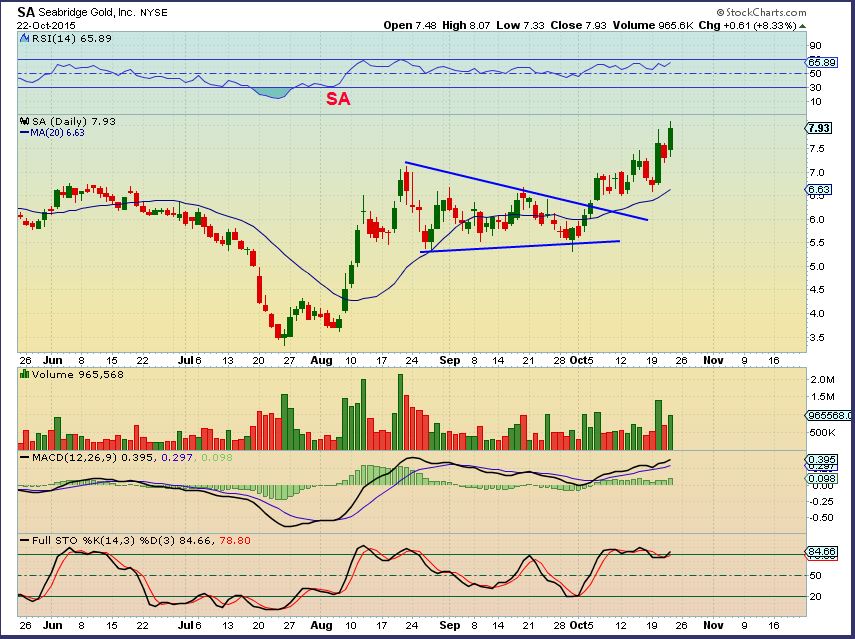
Lets Go back to the chart of SA for example. Thats over 130% from the July lows to today. It will NOT be the only one, and those gains were in just 3 months. We just need to let time tell us if the bottom is really in yet.
Have a great Friday and a great weekend!
~ALEX
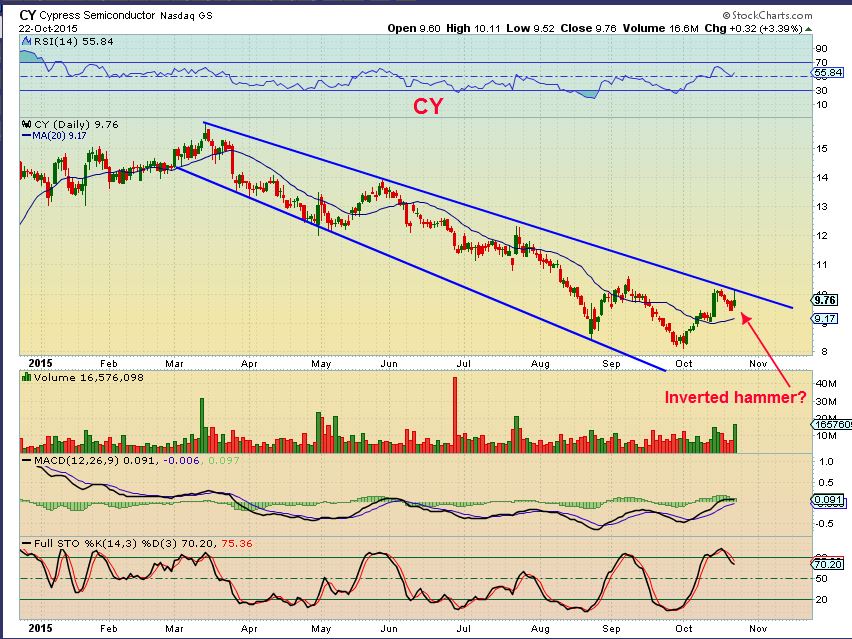
P.S. update: I pointed out CY the other day when I mentioned the SOX looked bullish. Cy had Popped 10% and closed above the 50sma. It might pullback and test the 50sma.
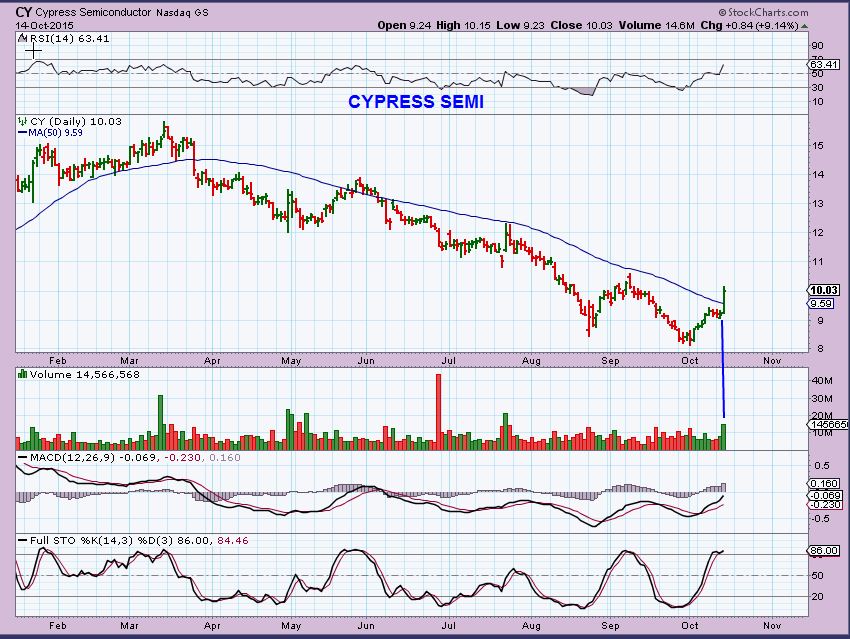
It has pulled back exactly to the 50sma (not shown) and today formed a high volume inverted hammer. This may break out soon if these markets continue popping.


thanks Alex. Have a great weekend. I like CY
CY rockected in AH
It did? : ( I was going to buy the break out
Giggle…
My two cents on the markets – I definitely see sector rotation in play with materials and industrials potentially getting hot and hopefully energy! But these are common at the end of a bull market. I’ve said it before, but still think we go to new highs, at least by a little bit. Strong move recently and we have very positive seasonality kicking off in just a few more weeks. I just wouldn’t go short here. I think we eventually get a real bear move, but clearly isn’t going to start this morning. I’d watch sector rotation and then weakening breadth and internals as it pushes higher at the end of the year, early 2016.
Surprised that gold not only stood up to the $$ rocket, but is pushing higher this morning??? Only thing I thought of is the EUR crashed based on Draghi’s dovish remarks and potential additional easing. Maybe the easing comments are bullish enough to overcome the $1.33 pop in the USD – would be very telling to pull up a chart of GLD in EUR (may try to do that later and post, but no time now).
Gold and Euro were running together since the summer lows . Gold lows were July 27 and Sept 11 & Oct 2 before each run higher
The Euro was pretty close to that too.
The EURO didnt make new highs in OCT like Gold & they really disconnected yesterday, but the DOllar / Gold correlation disconnected too.
It just kinda came to me this morning. I knew I was on to something (ok, I had hints, thanks CF).
Not to throw water on the party, but I wanted to highlight just HOW BAD it really easy out there for small cap energy plays. I know some are down 70-90%. Well, there is a reason. I guess the question really is, how bad is bad enough before they can recover. Here is the link to the 3rd Q results for BAS. They are absolutely abysmal. Just so folks understand the fundamental side of what we saw in the chart YTD. I guess hope is a method. http://finance.yahoo.com/news/basic-energy-services-reports-third-230000841.html
PDS –
Earnings release was 6 a.m. yesterday
Revenue this quarter was $364 million or 38% lower than the third
quarter of 2014,
**** Net loss this quarter was $87 million, or $0.30 per diluted share,
compared to net earnings of $53 million, or $0.18 per diluted share,
in the third quarter of 2014.
**** Net loss for the first nine months of 2015 was $92 million, or $0.32
per diluted share, compared to net earnings of $147 million, or $0.50
per diluted share in 2014, while revenue was $1,211 million, or 30%
less than 2014.
The stock ran higher yesterday low of $4.48 to $4.79 , then put in an inverted hammer. Go figure, They LOST 92 Million vs Gaining $147 Million. Stock went up.
The funny part? While reading this I was like ‘hey that is pretty good’!! Losing $92M. Way better than BAS did. Anyway, so I don’t lead anyone astray I am long energy here, just providing perspective on how battered the fundamentals are for some. If Saudi doesn’t back off soon, many of these will end up bankrupt.
Hence only buy low debt juniors.
Check the last couple earnings before you buy. Its good to buy ones that actually make money.
Concur Bill.
True, but look at the one I posted above PDS. They went from killing it to killing the bottom line in OILS drop.
If I read that correctly, they went from a 18cent / share gain to a 30 cent / share loss. Yikes
I own PDS…….very good net margins. Without a dought if OIL does Not increase in value some ot the juniors will bust especially those with High debt to support i.e.:GDP.
So if holding Longer term I would stay away from those. IMHO 🙂
But if you think OIL is a good longer term value at current prices then those juniors that survive will be a Fantastic investment.
Ken, I use trading view. On the charts it shows previous earnings. It easily shows if the stock has been green or red. No digging required.
Very Nice.
Very strange…I have NUGT only up 4% in pre-market, but it shows DUST down 10% ?? GDX up 55 cents or 3.3% , so NUGT should be up more than 4%.
Do you have a site or sites that you recommend to find pre-market/after-market? Thanks! Happy TGIF!
Hi T-5
There are quite a few , but if you go to YAHOO FINANCE & put in a quote, they put the pre-market right below it.
http://finance.yahoo.com/q?s=gdx&ql=1
Thanks! I haven’t used Yahoo in quite a few years. I will check it out. Thanks for the extra Friday report!
Ur welcome & nice to hear from you again – Hope all is well! ( You’re a quarterly comment guy , huh?) : )
I come out from the shadows every now and then 😉 Kinda like my picture
… i was just gonna say.. hmm.. what is that? ha ha
Not as good as all the timely GIF’s you have 🙂 Very creative and usually make me laugh. Thanks for that. Always good to have a few laughs during the day!
Don’t encourage her
ooops, sorry. Thanks for that website you mentioned earlier! Just from initially playing around, it looks to have many tools.
haha.. ohhh Bill .. u just hushup now….
:o)
Tradingview.com lists premarket prices
Thanks Bill, I appreciate it!
Gold / Silver just got whacked.
CRAZY markets
wow… #dontBlink …
I blinked and OIL dropped like that too … #Notanivertedhammer 🙂
lol….
it’s sooo close – any minute…
so funny.. any horsemen? or women here…?
trading.. reminds me SOOO much of my mustang & arab horses that i had…they were built for speed & just wanted to run ..flat out.. (naturally why they were mine ;o) we had 35 to choose from) TeeHee
anyhoo … when i showed/jumped with the Arab- especially on the approach-boy did i have to ‘hold the reins’ ..hold him back..u could just FEEL the power building & then of course when i ‘gave him the reins’ ..he unleashed…..
sweetness
TheEnd
Did you ever notice how the gold charts at Kitco, seem to have similar trade patterns on a few days in a row? Check out below, notice the similarity between Today and the 21st?
Never really looked at those 24hr charts
I have noticed that often at 8:30 GOLD changes direction or speed quicker ( Not today, but in the past).
Check it out, it happens a lot. Might help you anticipate in/out
Yep, nasty reversal. I still think we’re in the DC decline here, and this reversal bolsters that position. But the picture is still a bit muddy as you’ve pointed out. That Oct 2 low is a tricky one for the cycle picture, for sure.
WOW, what a reversal on gold, miners. This is a crazy market.
Well, looks like I sold DWTI one day tooooo early. Oil continuing down. Should have stuck with $43
Goes to show me you can’t tell what’s right or wrong by the pre-market.
Every time I buy pre-market, I get burned.
Me too. I don’t buy pre-market anymore. Got burned toooo many times. Rule #7
lol…7?
DUST chart – hit new lows and put in a reversal candle. Cant tell if it’ll stick, but it looks like a good reversal off of the lows.
MACD too…
,
refresh
.
Good volume. I was just looking at it.
holy wow.. key support on weekly…
It was tough holding this morning! Green now, thankfully! I see a good run here in DUST, based on a few things. One its the third time its been at this low since January. The other 2 times it recovered nicely. The volume is amazing, the MACD is crossing up, and divergence on the RSI5. Coming out of an oversold condition. Just finished a H&S pattern. We could be looking at $20 in a couple weeks.
strange… that DUST spike lower didnt register at all on Worden’s charts, but did on Stockcharts dot com
It may be showing pre-market ( They sometimes correct it later) . It shows a low of $11.60 & I only saw it trading that low in Pre-Market
$12.51 was the opening # , I believe
… oh .. my … do tell ;o)
USD approaching overhead resistance.
Amazing, the USD (DXY) is at overhead resistance and the RSI is overbought, YET, the MACD is just crossing over and headed higher. WOW
Hi Alex,
Where do we stand with the behaviour this morning…..are we rolling over to a DCL in the metals or maybe still a push higher for that 5th wave into the Fed next week.
thx
These are fast volatile moves in a small time frame.
For me to answer as though I know exactly one way or the other is misleading. Cycles are not clear in Precious Metals right now.
Stepping back and looking at the bigger picture – I tend to think that Gold is going higher. Oil should bottom very soon and Energy will go higher too.
getting a re-reversal in miners (GDX/J)??
… and SLV
Sold my dust 13.40..Phew..this is nuts..going to stay away till gold and miners make up their mind. Banked profit and done till Mon.GL to all
im waiting for the re-re-re-reversal.. then i shall get DUST.. or NUGT ….. or… im lost
LOL
LOL, Stay away till your unlost.
lol…
wow Bas
Good Eye Maria.
Oil must be close
I like the way BBG , CJES, GST, PKD, WTI and a few others look here too, with OIL down.
At present my energy positions are making a daily hammer – unless they plunge into the close. Still long way to go till 4.
still under the MAs in a downtrend though?
i never trust those big volatile spiky things in the middle of a DT.. many times seen to be a B wave!
And…. Unwow. At least it didn’t end down especially considering the way it opened (and they lost hundreds of millions, too!).
Possible Stop run.
in what ken?
refresh Maria
ahh.. tx.
there must be a setting that allows images to show inline…?? instead of refreshing?
if not.. there should be… write to the developers in your spare time.. L O L
Concur !!!
;o)
LOL – Now it looks like KEN wrote CONCUR to the new gif s – lol .
lol…
I concur to all above. 🙂
It looks like Ken agreed because of the way the posts align, but he was actually agreeng with you Maria, and I put the GIF in between the posts : )
Oh Maria All I hear is …. 🙂
.
https://a.disquscdn.com/uploads/mediaembed/images/2701/7381/original.gif
LOL, I bet she’s like that in person!
…actually more like this ..
orrrr .. this …
or this …
Miaouw
Oh My! A new appreciation for cat woman!
hahahah….
hahah.. where’s Ken’s? he agreed… so PLLLDDDDDDDDDD
It shows on Android but not on PC browser
yes.. tx Conrad..
precisely…. ;o)
hmmmm casinos … mgm mpel .. interesssting
USD at Resistance……
Gotta LOVE that SA move.
unReal
Dear Alex…. would you place the chart again from crude-oil where you were thinking the bottom is. A while ago -I think one or two weeks ago- you place a chart what point down and was ready for a break out.
Also Chris has a very good chart for OIL where it could be the bottom.
Hope you both follow me.
Many Thanks.
I dont know which one yu mean, but I posted one that the support type lows would already be broken, except for a ‘stop run’.
I will post that one, but I think that I had another where price was higher than where it is currently.
.
Maybe you mean this one? It had support shown, but I wrote in the report that the magenta line would be an A-B-C-D target. ( refresh)
.
I believe BILL had a target of $42 on an oil chart a while ago too ( Bat, Shark, or something)
From Bill I found it Alex
https://a.disquscdn.com/uploads/mediaembed/images/2681/6611/original.jpg
Hi Geurt. Just seen your post. I’ve been out of circulation the last week or so with visiting family so a little out of touch in all kinds of ways at the moment. I’m not sure if this is the long term oil chart you meant but have posted this udated one just in case. I can’t decide yet if the MAJOR MAJOR wave 4 low is in place yet or there is one final low to come. The rally from the late August low looks horribly like a completed A-B-C move on my shorter term charts right now. If that is the case then we should be in a final wave down and potential retest of the $37.50 lows to finally end this bear market. But I’m not fully convinced of that yet and need to see more price action to feel more certain either way. Just glancing at the shorter charts we look like we are at a pretty critical level right now to decide whether we start rallying again (as I believe Alex thinks) or make that final move lower. I’m totally undecided right now.
Thank-you-very-much Chris.
Have a good weekend.
Thank you Geurt. You too. 🙂
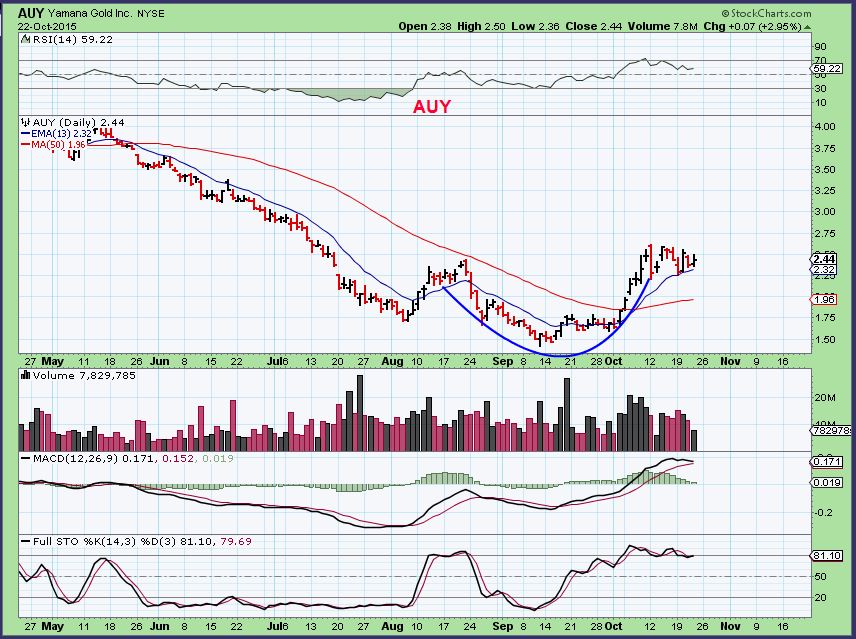
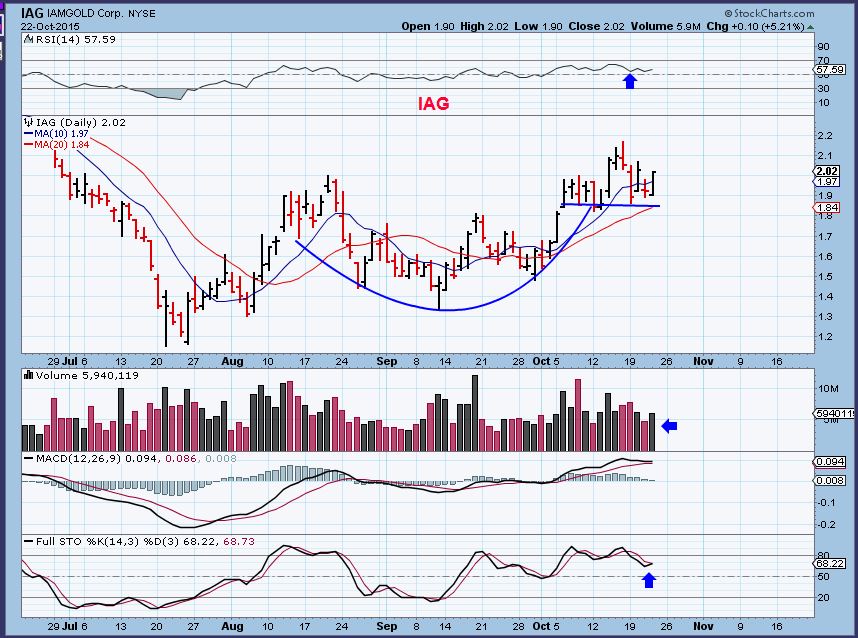
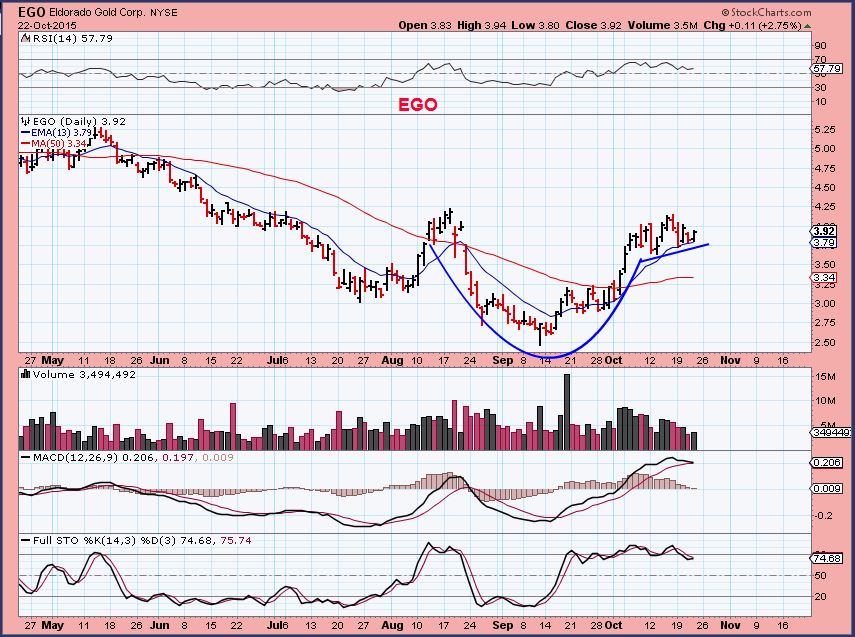
All of those Juniors in todays report (Above) look like they still want to break out. SEE IAG, AUY, EGO
TGS .. u ever trade that?
I cant trade anything that light in volume.
becuz ur #MrMoneyBags and have 2much .. size … ? 😉
LOL – Funny girl.
No – It has 50,000 volume so far today ( $4 stock). Last week it had 12,000 all day and 11,000 all day long.
If anyone big was holding & just dumped 10,000 shares, that price would drop fast B4 I could even put an order in. Then my sell would continue the cascade.
Stay liquid – stay hydrated my friend : )
Performance by the miners is impressive in light of the dollar’s advance the last two days. Volume isn’t great but at least it shows some resilience.
Alex, Inverted hammer on GDX daily chart?
you mean bearish Bill?
Yes, I was thinking bearish for GDX
Bill this means we “will” go down a bit?
Thanks.
Ya, I thought GDX would/will go lower. I figured if the inverted hammer indicates a reverse in direction? Alex, is thinking higher. I don’t know…….
Thank-you Bill
Isn’t it a hanging man ?
Hi Ray
Hanging man is found at the top of a run, but this was a dip & reversal. Looks a bit more bullish right now.
(Plus we have to wait for the close to see how it really looks).
Alex.. you still recommending this as an offloading opportunity rather than a buy ?
HMMM, I was recommending it as an opportunity to unload if we break to new highs and get the 1-2-3-4-5.
The cycle count is not clear and that makes me wonder a bit. Using tech analysis, these are normal runs higher, pullbacks , and then another leg up. When I see what SA did…unloading too early would be frustrating.
Would I buy here? Maybe. IAG, EGO, AUY etc, look like they want to break out. If I was a a trader in front of the screen, one could buy knowing that we are going into the weekend and could gap down Monday….but it is possible that the Dollar hits resistance and drops next week and since Gold has ignored the $$ run higher. I imagine it will run higher if the dollar drops.
NGD, NG , AKG, and more also just have that bullish look. They all could use a bit more volume, but sometimes that volume shows up on the break out day .
think im inclined to leave til monday… see how gold goes early markets.
noticed that has GLD broken out of a descending wedge, and currently backtesting top TL
For me, I’ve decided to wait for a dip into next cycle low. COT is nasty and dollar exploded higher with Fed on tap next week. Don’t want to overtrade if we get into a 1day up/down pattern. If I was already in unleveraged I’d hold, today was encouraging.
It’s a bullish reversal if it closes here. Many individual miners look like they want to continue a bit higher too. ( It depends on the close, but it points to higher prices in my opinion)
Thanks ALEX….
GDX is either going to continue the pattern that it has been for the past 108 days, which indicates to me lower prices OR its a bull flag forming and we go higher. I have nothing that tells me GDX will go higher other than the chatter that we could be at a 3 year low in commodities. I have several TA patterns that point lower. Time will tell.
Bill what means: I have several TA patterns that point lower.
Thanks Bill.
Even BAA is looking rather bullish on a 3 month chart.
Yup, MACD and RSI diverging nicely, volume today isn’t that much. Looks like a basing pattern.
I have to say, having the dollar up so strong the last two days, and not seeing a total collapse of the miners is a bit unbelievable.
Really bad COT. Doesn’t mean miners will head down right away but if they do rally next week it might be time to sell and wait for the correction.
Gold near where it was in Jan, silver the highest commercial shorts showing on the entire chart. But go back up in report and look at end of first cycle in Aug. GDX went STRAIGHT DOWN. This time, it’s holding at the highs (for now). Something is up…