We discussed abnormal cycles in the markets in the last 2 reports, and I want to finish that discussion in the Gold report today. First lets review the other sectors and then we’ll see whether or not the moves in Precious Metals are likely to be a few more false starts, or closer to the real deal.
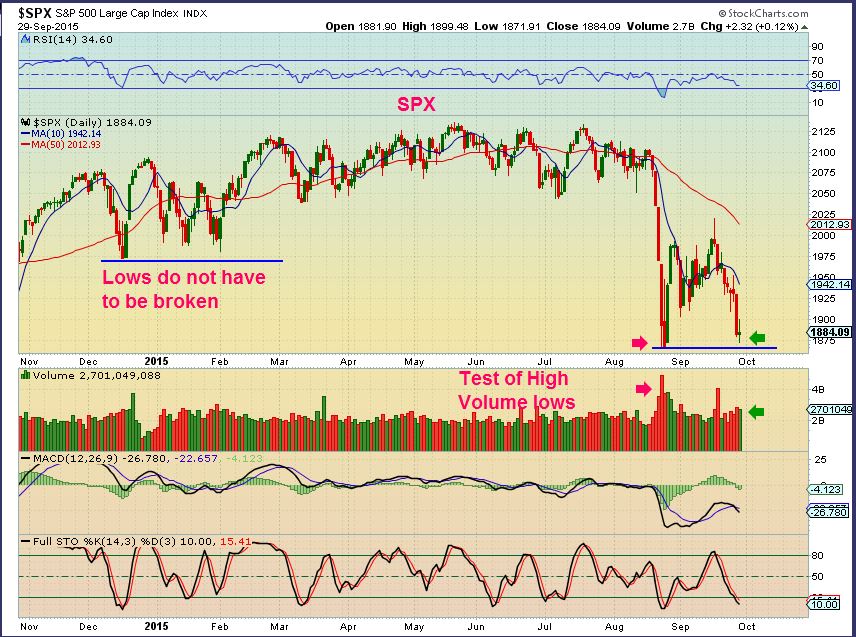
My SPX chart from over 1 month ago is playing out nicely. I expected a test of the lows and a test of the break down as shown here.
SPX – Sept 29 we got the test of the lows as expected. Now we should see a reversal higher.
SPX WKLY – We got that reversal as this week ended and I expect the SPX , DJIA, QQQ, etc to run higher.
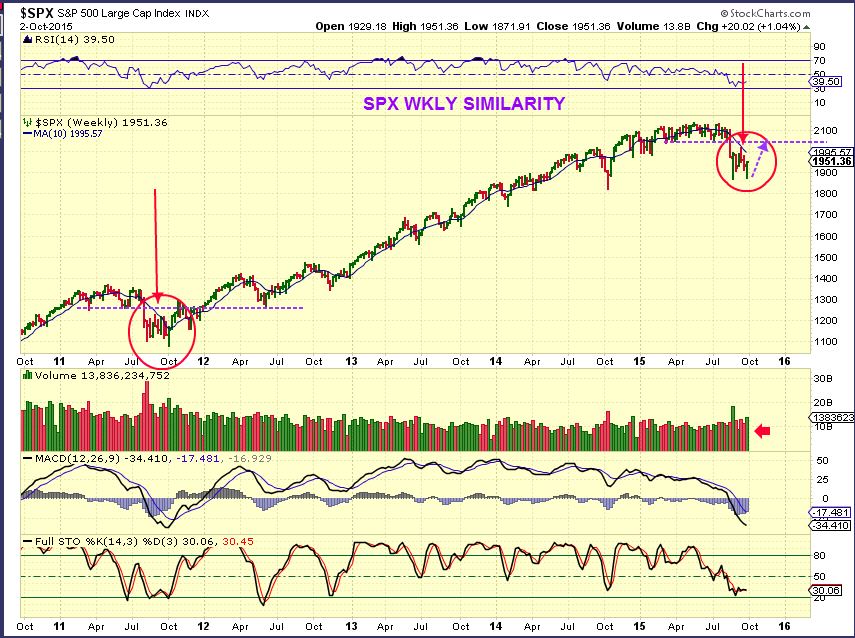
This is what I’m expecting next…
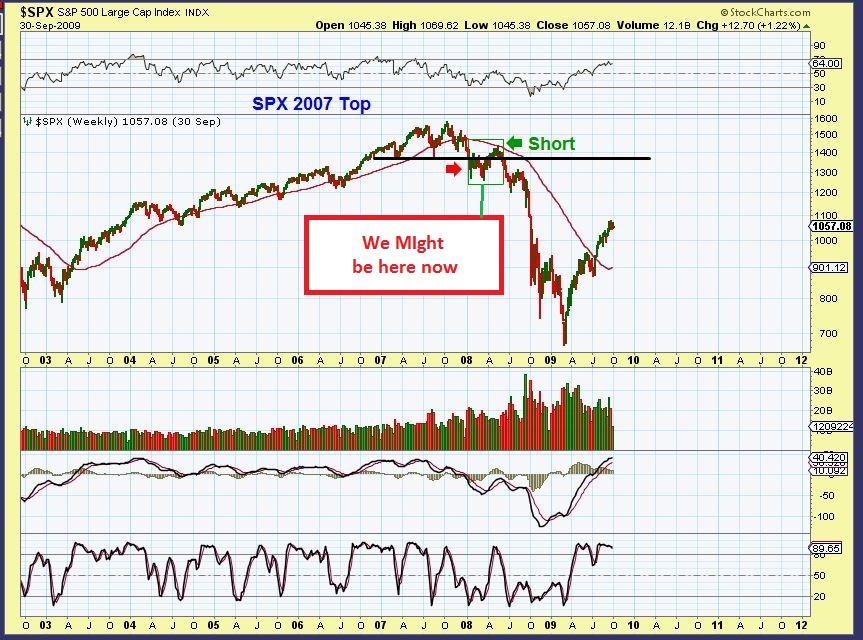
Here is the 2007 SPX – It topped the same way. Drop to a double bottom in the green box, a run up to test the breakdown, and that is a low risk short. We’ll watch for that.
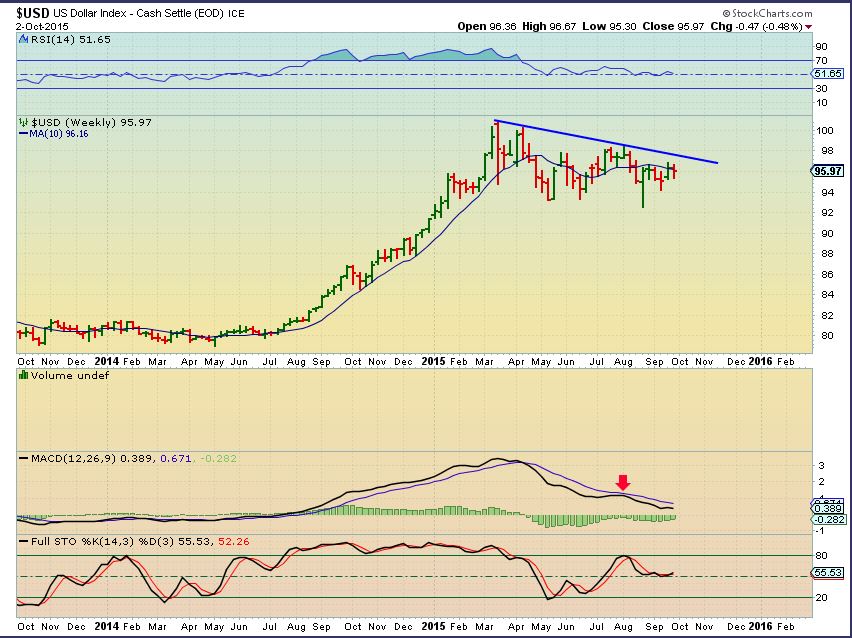
USD– It has still been unable to tag that upper trend line.
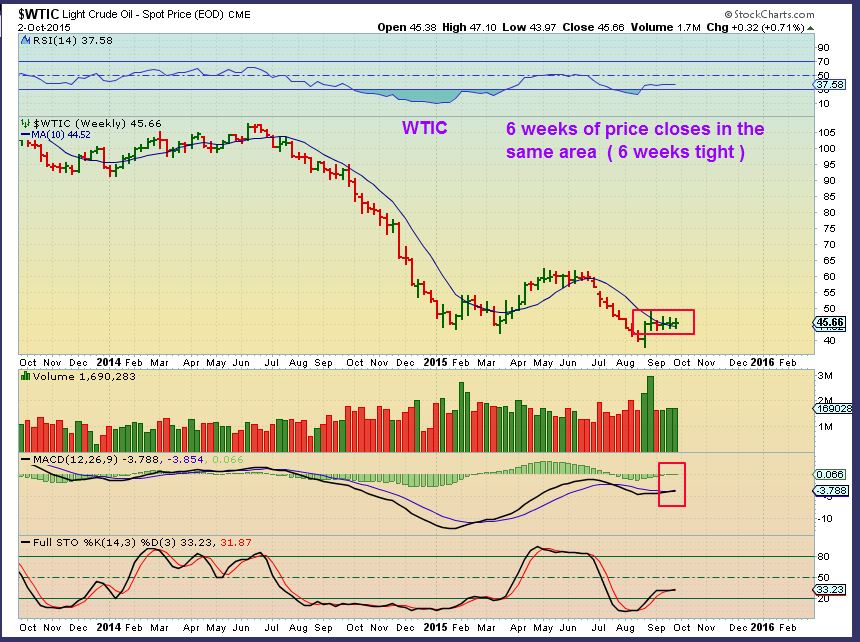
WTIC– We are still waiting for a break out from this very tight weekly close. Will it break higher?
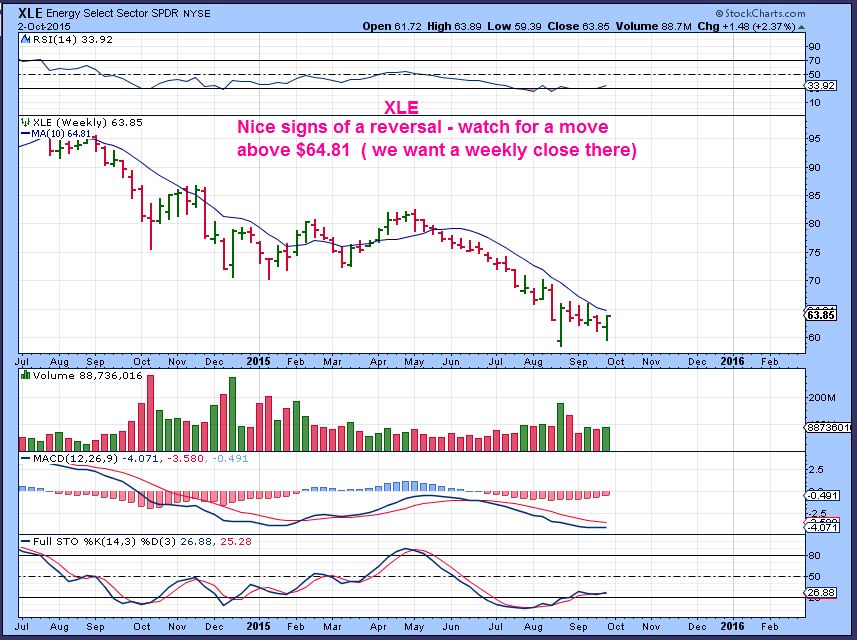
XLE WKLY – This reversal may be leading the move higher.
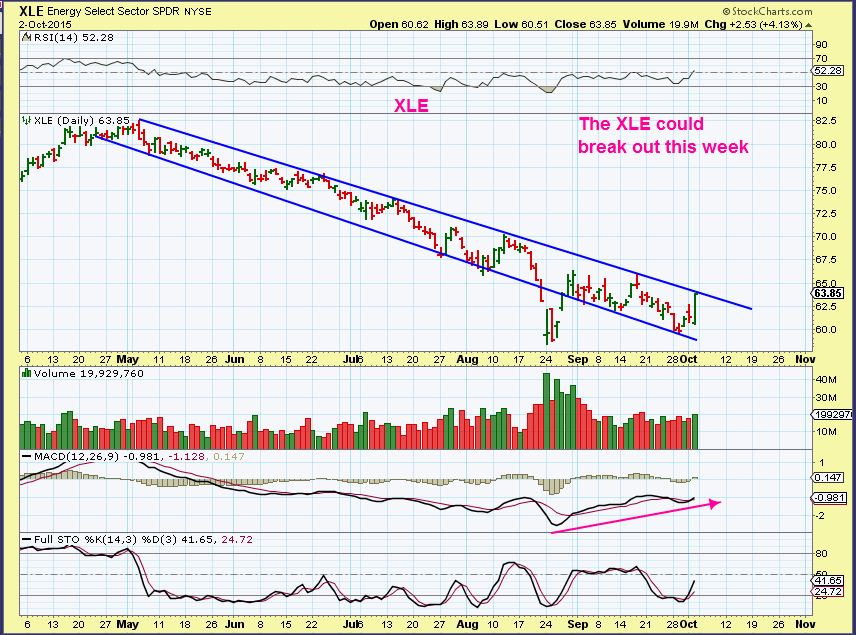
XLE DAILY – If Energy stocks are leading the way, watch for this break out this week. That was a strong reversal on Friday. See XCO, BAS, REXX, LGCY, UPL, CRK and other energy stocks possibly forming set ups .
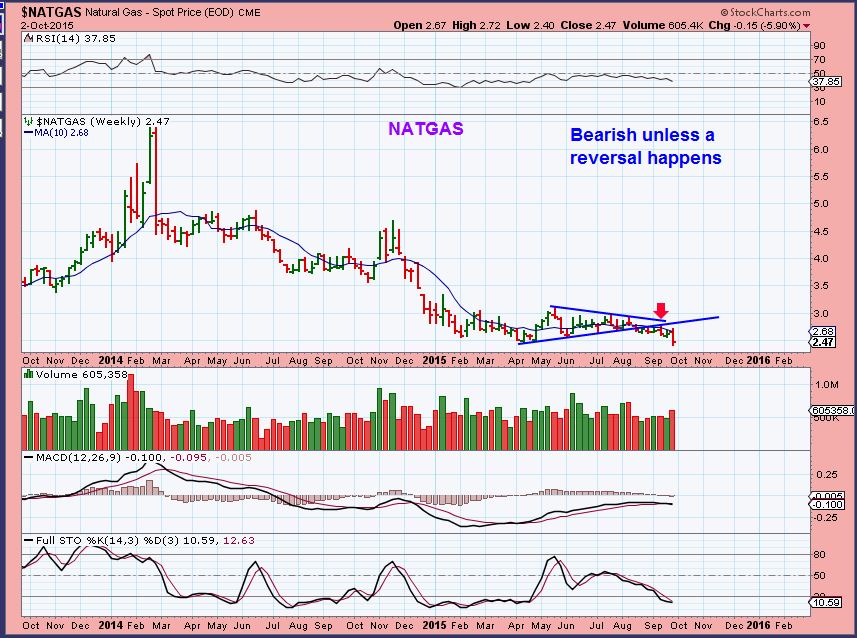
NATGAS – This is still bearish without a reversal. It is oversold and can bounce higher, but the weekly looks bearish , so caution is warranted.
GOLD, SILVER, AND MINERS
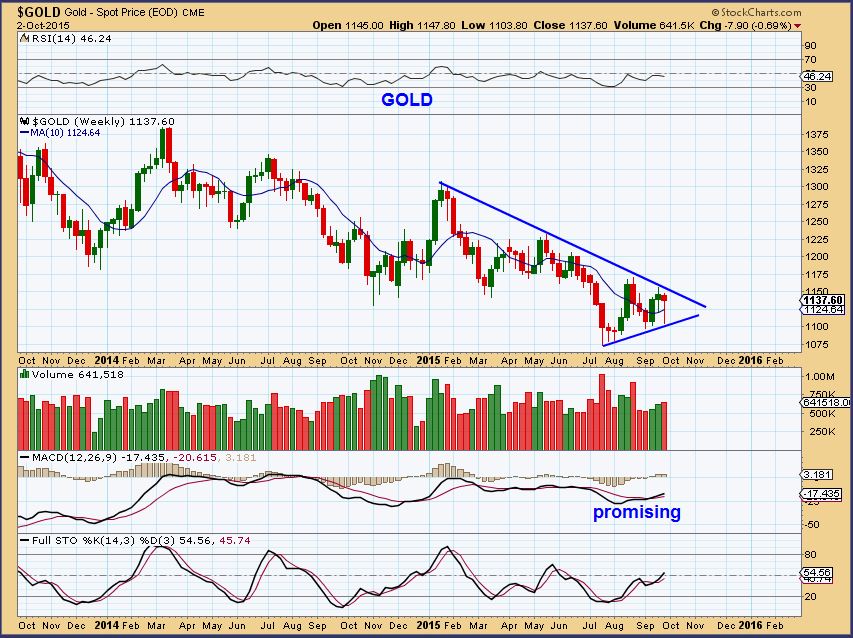
GOLD – Strong reversal on the weekly chart, but notice that it did not break out ( I do expect it to break out higher). Notice the Triangle type bottom. I will discuss this triangle later.
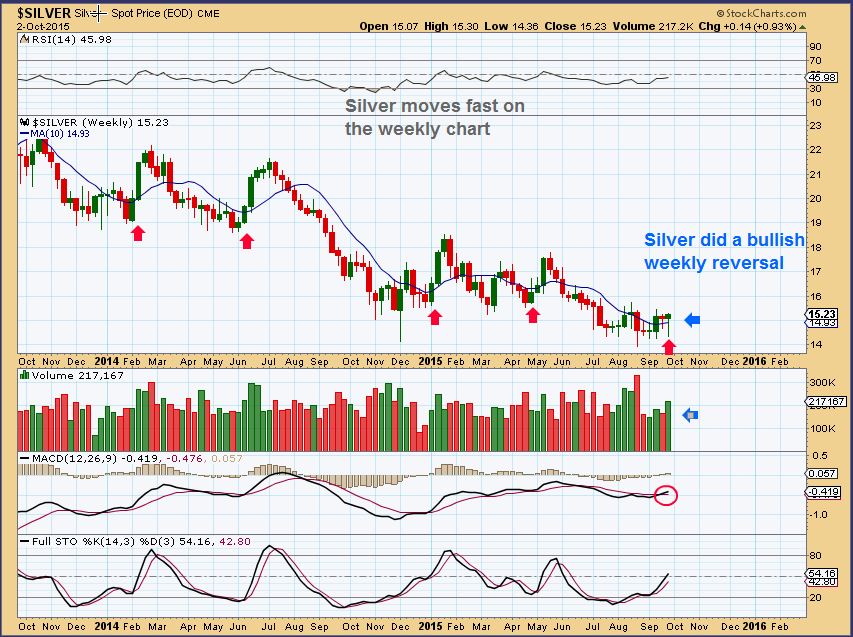
SILVER WKLY- You see a reversal here, closing above the 10wma. Doesn’t look like much,right? Check out the daily.
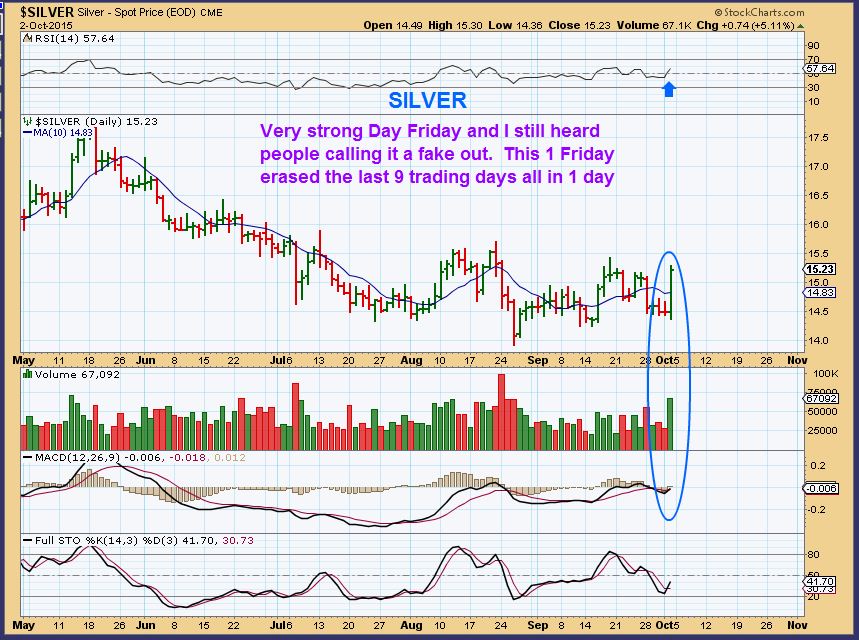
Silver daily – Surging up over 5% with the strongest volume in about 6 weeks. USLV was up almost 15% Friday. After such a big move, Silver could drop to the 10sma at $14.83 and still be O.K. , so I’m watching that.
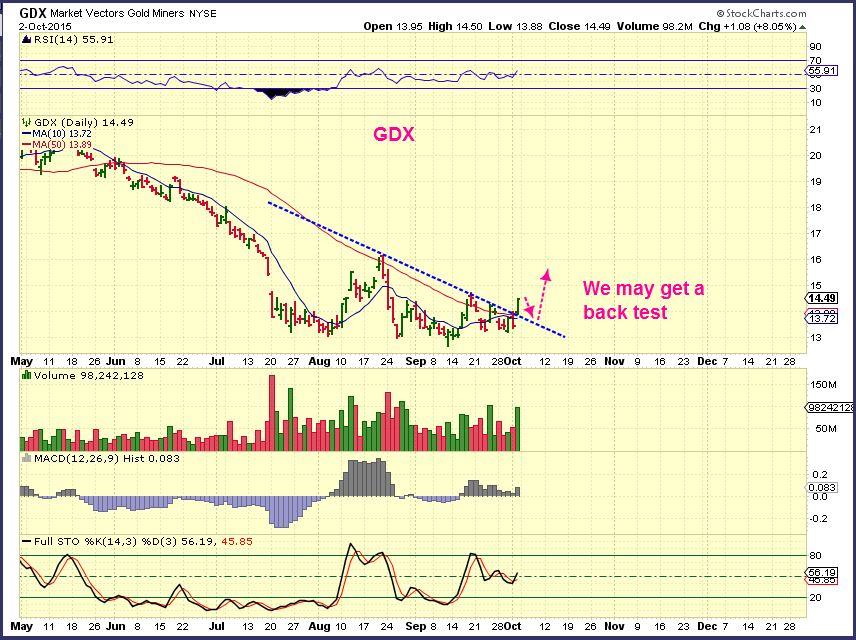
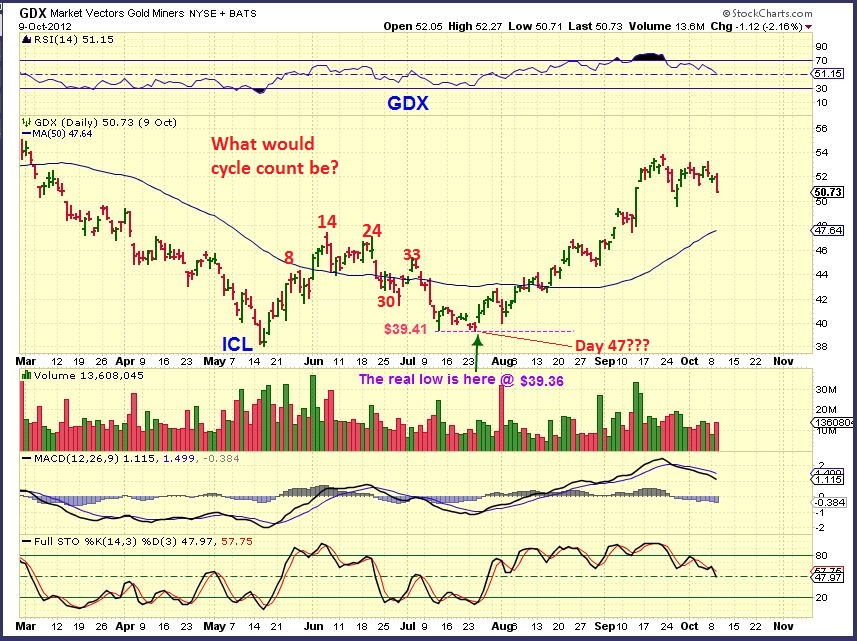
GDX – I posted this in last weeks report entitled “Abnormal Cycles”. Indicating that we are squeezed at what has been the lows for years, It would be a buy. This was a bullish set up, and we broke out Friday with GDX up 8%.
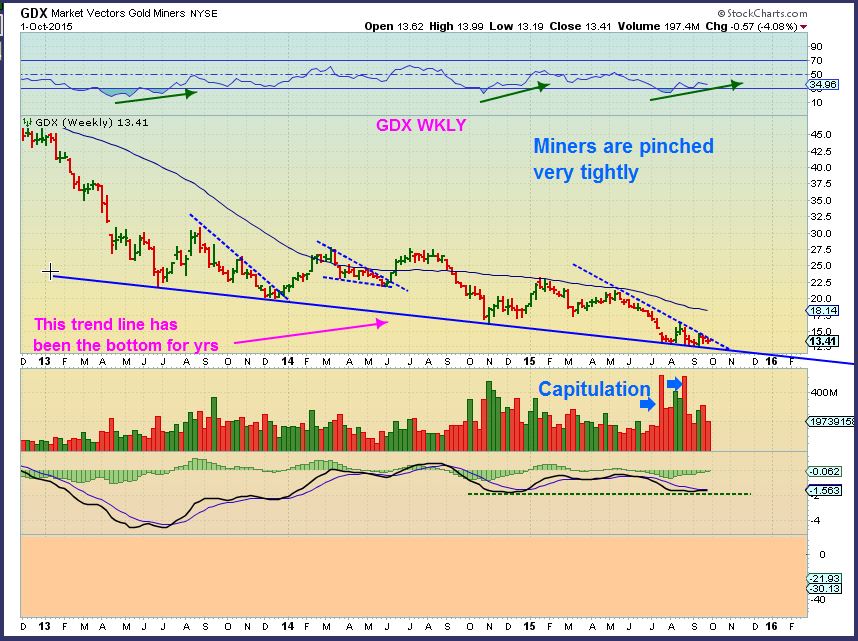
GDX – Due to recent swings in the Miners , many felt uncomfortable buying that break out. Look at this chart however. If we were trading at $18 in the near future, we’d look back at this chart and say that this looked like an easy, obvious bottom to buy.
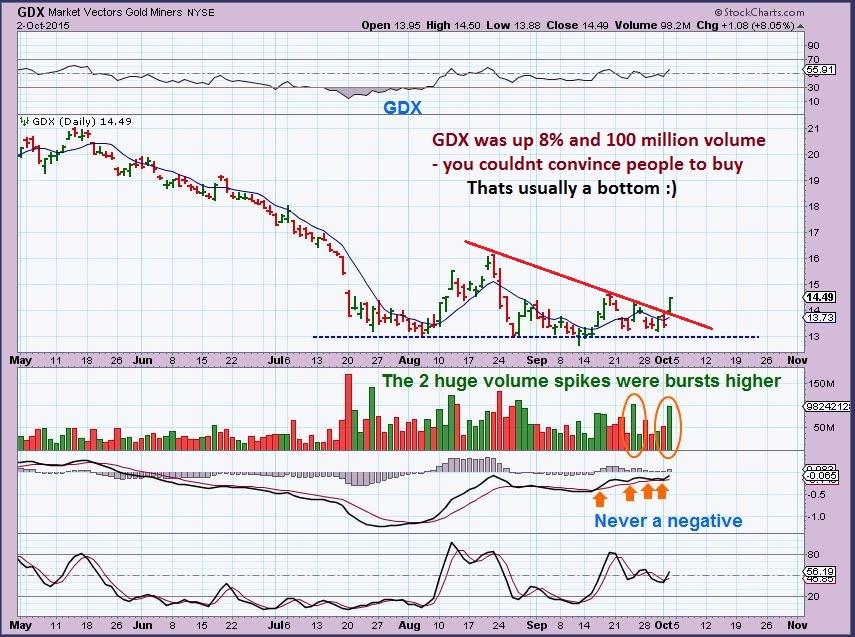
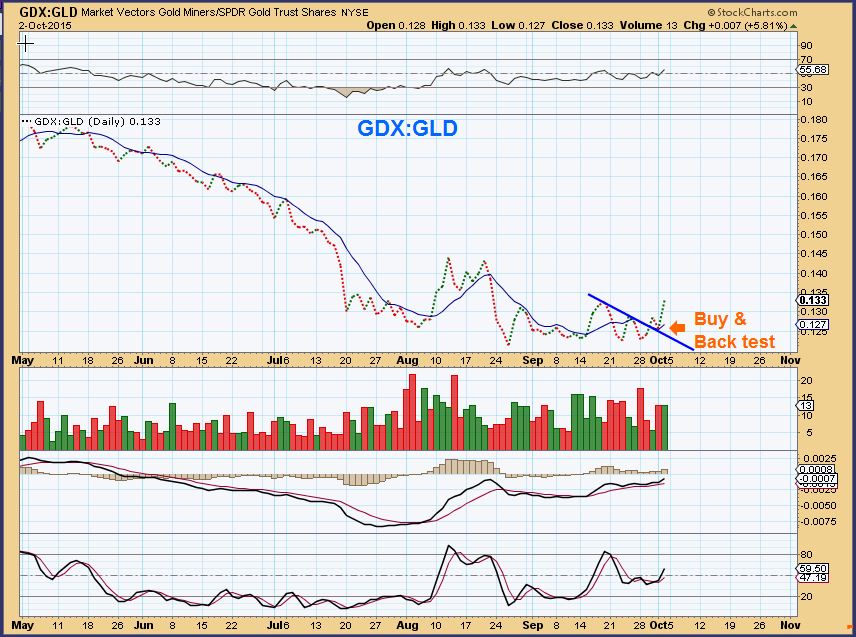
Lets see if we drop back and back test this break out. That could offer a lower buying opportunity.I think Miners are a buy in this bottoming area anyway. I will explain further down.
I pointed out the buy signal in a similar chart last week. After Friday it has further confirmation.
I pointed out various bullish patterns on Miners and they are still bullish. Let me just quickly point out a couple below.
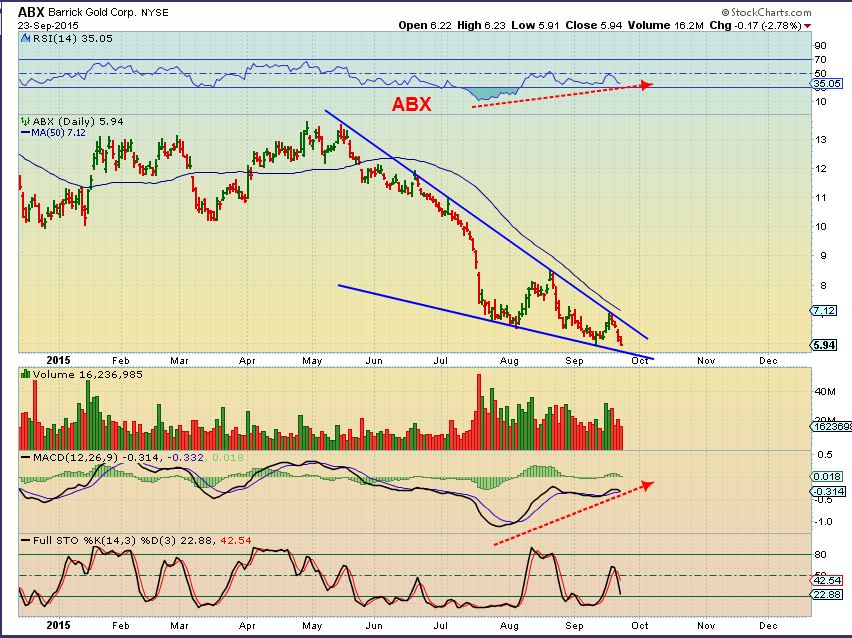
ABX – Sept 23 $5.94
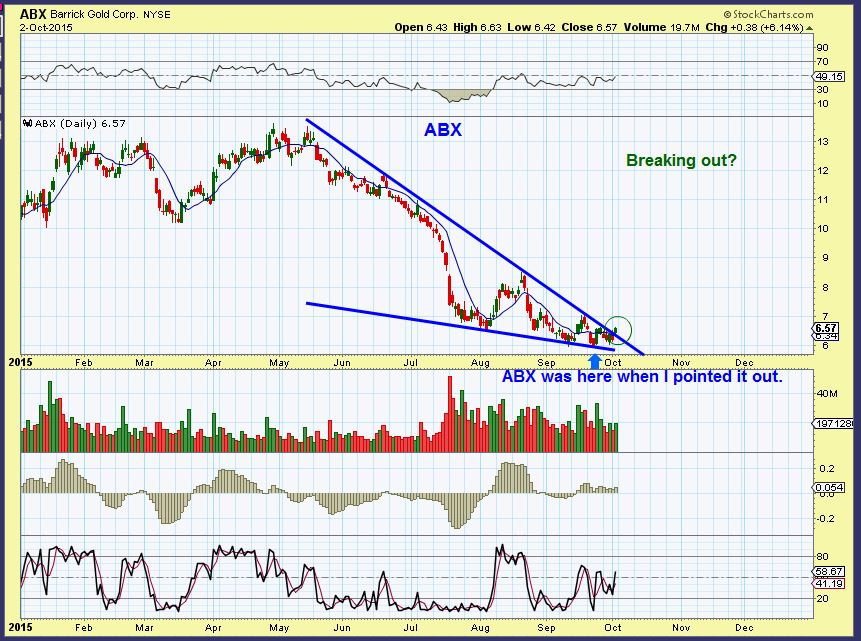
ABX – $6.57 & just breaking out .
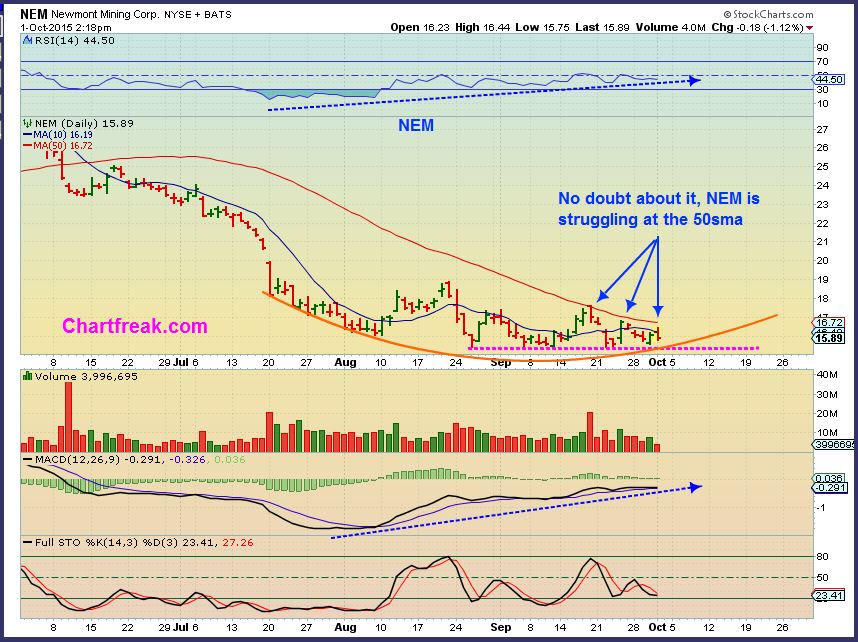
This was NEM at $15.89 in the Friday report, unable to break above that 50sma. Friday it closed at $17.07, above the 50sma. It broke out and is just probably getting going.
This Precious metals sector has been up & down and all over the place. Can it be explained reasonably? I think so. I understand that this may seem like a long winded explanation to some when I present a lesson, but it is always designed to help you understand what you are seeing. I would rather try to understand what I am seeing, not just keep guessing. You can choose to skip this if you wish 🙂
Lesson for recent unnatural cycle movement
Using technical analysis, the Mining stocks really continued to look bullish. That seemed odd with the cycle counts getting a bit late in the 2nd daily cycle. Were we running out of time for Miners to run higher? Lets take a look.
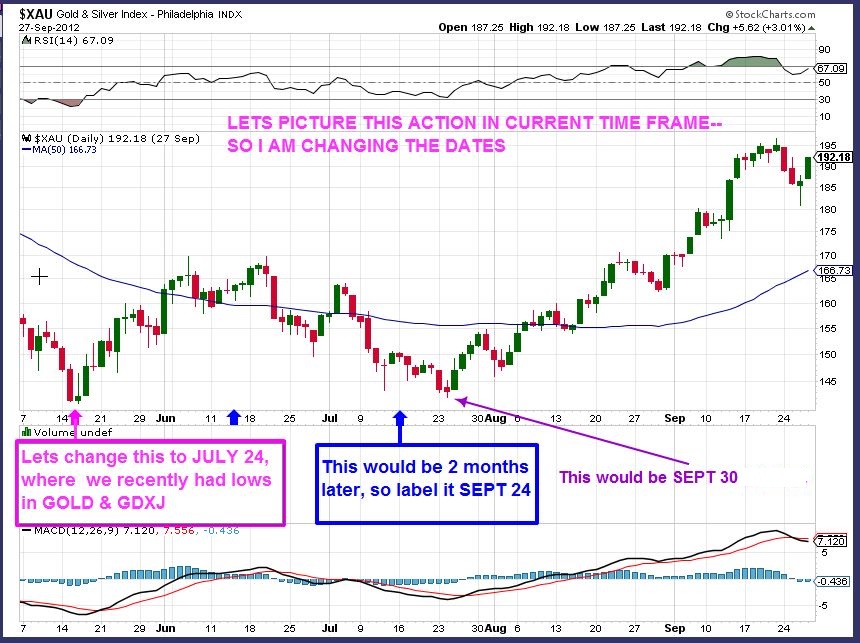
Continuing my theme of Abnormal cycles. There are definitely times when cycles act like clock work and are very reliable. I have pointed out here about 6 months ago that when they form Triangles and other patterns, they can act unpredictably, breaking higher later than expected.
Example: GOLD 2012- This constant Up & Down action looks fine in technical analysis, it is a basing process. Now imagine riding this day by day as though you are counting cycle days or E.W..
The Lows were in on MAY 16 – it went sideways ALL SUMMER into August. It was pinned below the 50sma, it too would be stopping many out all through June & July.
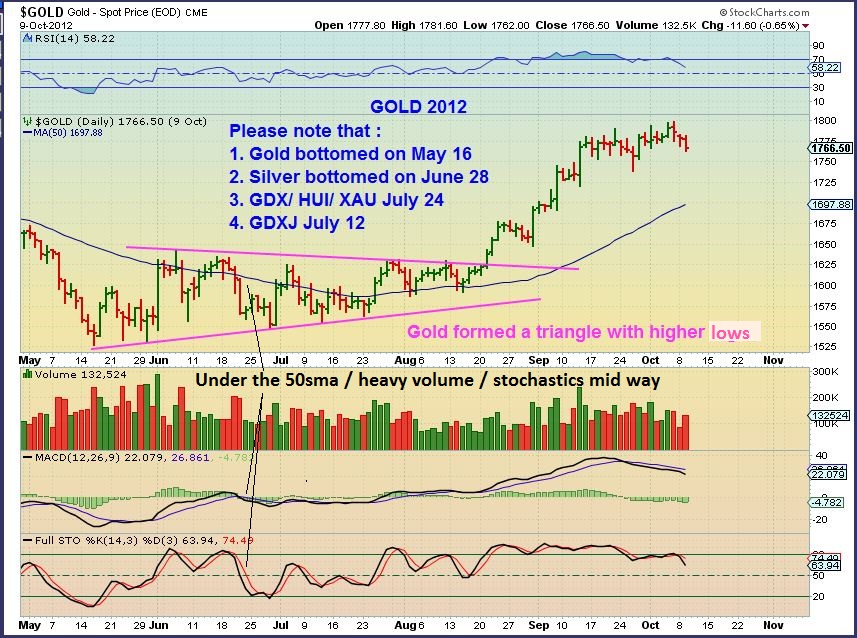
So Golds lows were in on May 16, 2012.
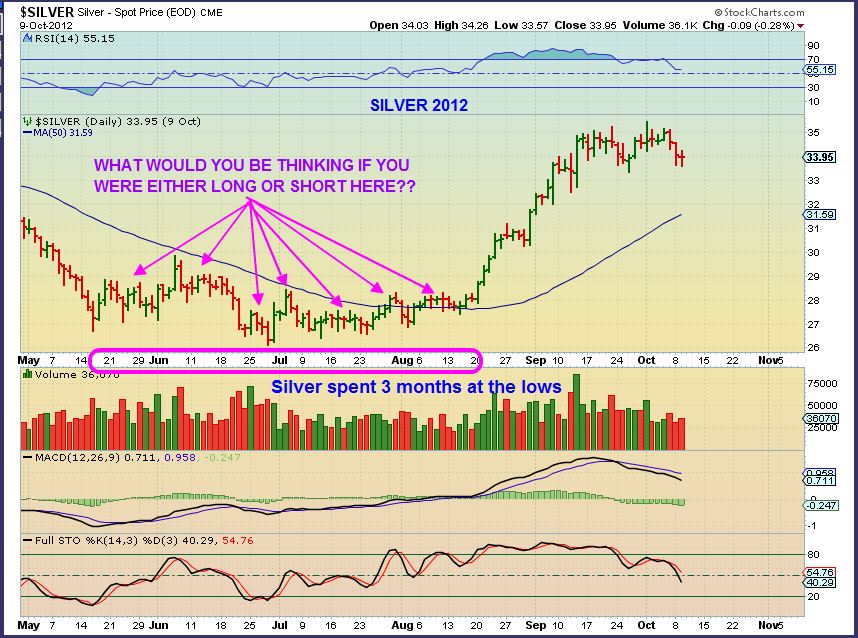
Now look at SILVER 2012. Whether you went Long or Short, you’d be on a Bucking Bronco! Gold bottomed in May, and Silver broke the lows on June 28! It went sideways for 3 months. In June & July I’m sure you’d be hearing ” Silver failed, go short!”, and then it ran higher. It also seemed weak, unable to break above the 50sma. It was a strong base.
I wanted to post this to show how Miners acted. After Gold bottomed in May, notice that Miners ran to the 50sma, gained it, lost it, gained it, lost it, broke back above the 50sma and then shot down to the July lows ALL THE WAY BACK TO THE MAY LOWS 2 months later. I also want to point out that this took almost the same amount of time that we just spent from July lows to now ( 2 months a few days). Then it ran up strongly.
Let me put it this way. Abnormal Cycles can drag on & on, yet still burst higher.
GDX was not acting correctly cycle wise either in 2012. This chart shows GDX going 47 days while Gold formed a triangle and Silver went sideways for 3 months. It also gained & lost the 50sma and returned to lows, who would want to buy that? Then it ran higher July to Oct.
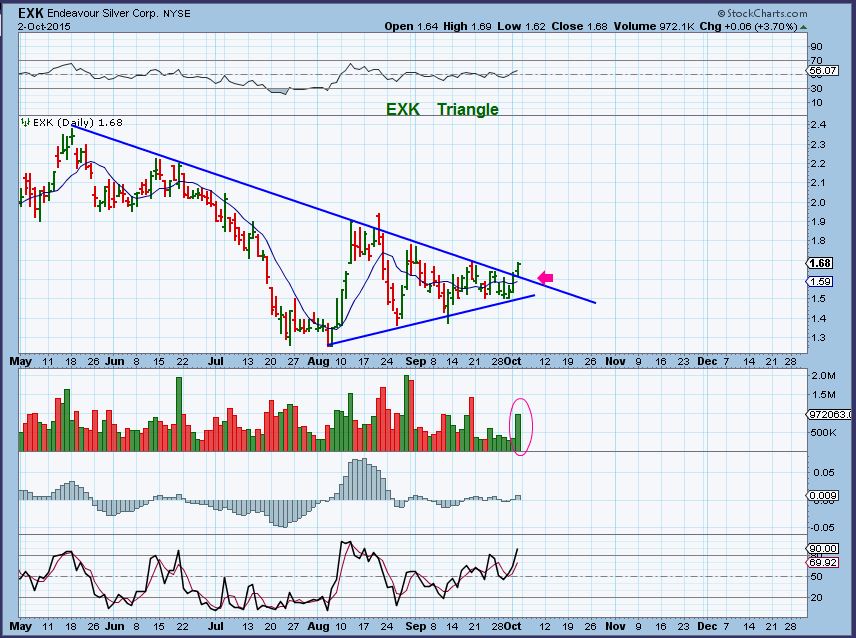
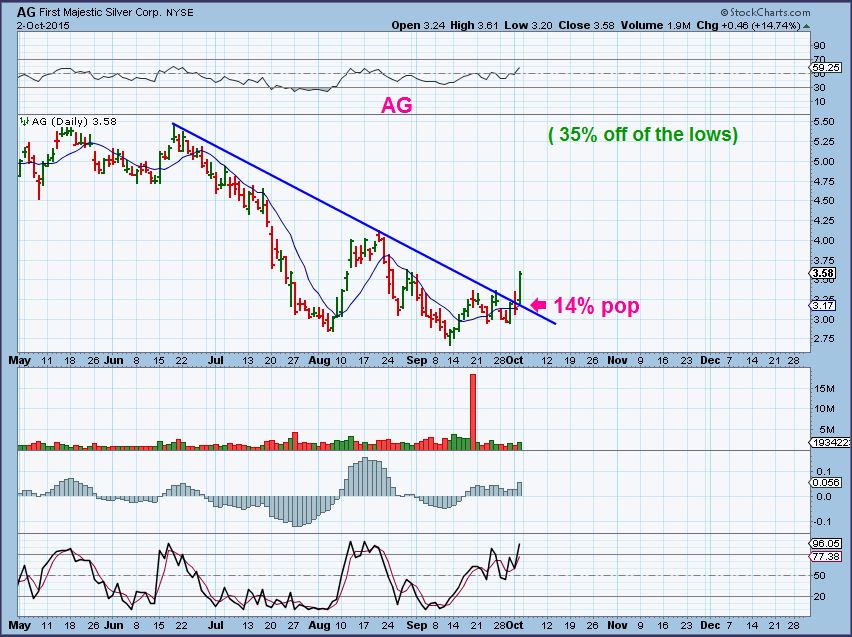
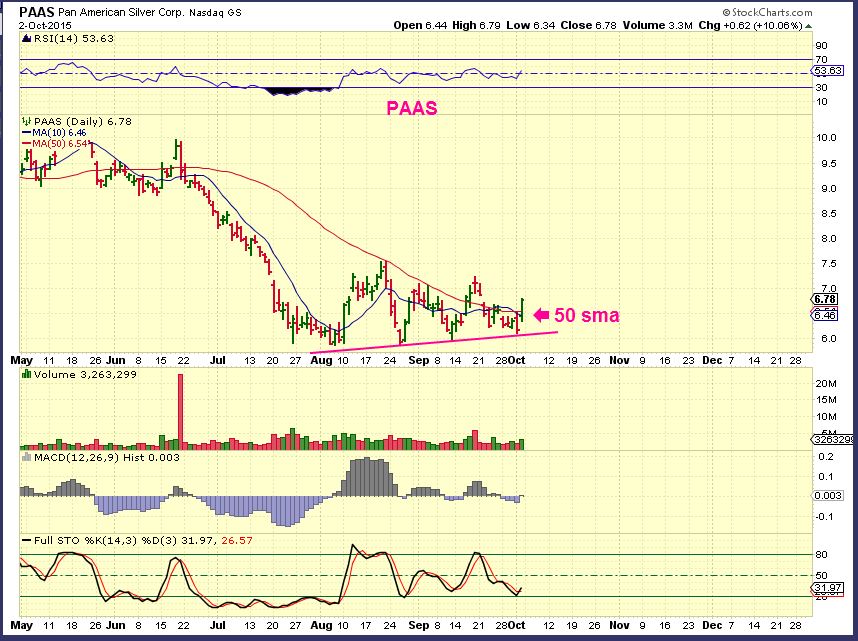
I wanted to point out the abnormal cycle timing, because I know many here rely on cycles are are thinking that day 15 is too late to move higher in a 2nd daily cycle. Currently I see more than just a few miners forming patterns that look bullish , and that has to be telling us something. I still think we can move higher and stocks like SA, SAND, EXK , AG ,SSRI ,PAAS , AU, AEM, etc .
This is an example of how some Silver stocks look to be breaking out at this point. They have formed bases that can be viewed as triangular in a way. Trendline breaks can also get back tested, so I expect a possibility of more non-directional trading. Only time will tell on that one.
It looks like the sector has been in a bottoming process and can still move higher.
I will cover more miners in the next report if the set ups remain bullish. First we need to see how Monday plays out . Often a triangle break out can back test too, offering another buying opportunity. Today I’ll be looking to see if these bottoming , triangular type patterns remain in tact. I hope all had a nice weekend, and I hope this report helped us to understand the type of move that we may be seeing is a bottoming process. I still expect it to break higher at this point.
~ALEX
P.S. Some here seem to only want to trade JNUG or NUGT , but the sideways/ bottoming process currently happening can make such 3xETFs difficult to watch. If that is you and you now see that this could have just been a normal bottoming process, why not try a smaller position in a couple of mining stocks on the pullbacks instead of 3xetfs?
Abnormal Cycles Part 2 
 The Runners
Scroll to top

Thanks a lot Alex, perfectly discussed.
Thanks Alex. Another very thoughtful and thought provoking report and loved the lesson element. A great example of stepping back to ‘see the wood for the trees’. I’m very aware we might all operate on different time frames ranging from very short term out and out traders to more intermediate term/longer term traders/investors but we can all get lost in the shorter term ‘wiggles’ from time to time and miss the bigger and ultimately more important picture. Definitely a great reminder for me and I’m sure others also. Thanks again. 🙂
Up date on the GDX H&S pattern. Playing out nicely, also following the last ICL pattern (gold candles). Promising
Definitely looking promising Bill and thanks as always for sharing. I’m also monitoring the development of a possible base pattern on silver with the key resistance/breakout level around 15.65. IF..we can clear that level, the base pattern would suggest a near term target around 17.00. When I say near term I’m thinking over the next few weeks rather than days!!
That’s not too far off of my original target, but since we took so long to get there, I had already stopped out or exited. #MissedTheBoat.
Good morning Alex! Thank you!
NGD!
Alex, all, I want to buy some miners. Got stopped out. Where can I get in? Doesn’t look like its going to come back down to retest the trend line. Up above all the MAs so far. Train left without me.
gold looks like it may turn for a correct at $1140.
has it done 5 waves up yet?.. im not sure.
but negative divergence on hour MACD.
maybe miners could pause & come back to the MAs
Bill, I’m with you…so I decided to chase for a very SMALL position–keeps the “fix” at bay and will add later if and when get a chance–but the small position really satisfied the craving. Not riding in first class but 3rd ain’t so bad either–having paid a lot in the past only to be thrown off–I’m good for now. 🙂 GL!
Good advice, skin in the game, but just in case we get a down day , you dont feel like you jumped all in at a bad time.
Sometimes I wait for that mid-day pullback that we often see, and add if things aren’t too extended. sometimes I wait for a down day, since past runs higher can go up 2 days , down 1 , up 3, down 2 etc etc tagging the 10sma.
Also for individual miners – I was just looking for a couple that haven’t taken off yet, but are still in consolidation. Maybe one that is just breaking above its 50sma? It’s possible they play catch up and are not so extended that they will pull back as soon as I get in.
For example : HL and PAAS still seem healthy in their consolidation. They may be catching up soon, but really it’s tough to tell. I play them for “Scalping” that way.
When I mentioned HL & PAAS they were just getting going. They actually did play catch up and may be ready to continue higher, breaking out of their consolidation.
I had the same question since Bill and I are in the same boat. A pullback to the trendline here doesn’t seem likely (that is what too far after this move and would be bearish); so sounds like best advice is small basket of ind. miners, see which ones are not extended, and as soon as we can get a pullback. I won’t chase if we keep going higher day after day as that would eventually end badly.
Alex, I know you mentioned other minders if you could slip RIC and NG in there much appreciated! Both seem to be in long consolidations and I’m not sure if I should hold on while others continue to make substantial moves…afraid when it’s over my holdings could still be stuck in the mud (or snow by then :-)) Thx again!!
They look like healthy set ups, and they can break out and take off at anytime, but no guarantees.
Ric has been in a long consolidation, if it breaks out it could run b=very nicely, but ‘when’ is unknown.
RIC is at that upper trend line, look for a break out. Refreash
Thx Bill, fingers crossed. A lot of them seem to be in triangle formation and some giving it up so it’s a mixed bag.
I was too short-sighted and dumped it last week before Jobs Report. 🙁 🙁
RIC broke out, headed higher
WG, CRK, BBG, LGCY, AREX, DQ….interesting . They have nice gains lately , but I still cant tellif they are leading a break out in Oil or just a good bounce.
I jumped into DQ when it looked to be breaking out. I see it as a AB=CD pattern forming with a bull flap in the middle. Should reach $20. Also, the end of a harmonic pattern whic is good. But mostly because Maria told me too. Refresh
Yes, I remember you having that discussion with Maria last week. I love trading DQ – moves well but volume can get a tad light at times.
I meant to add ‘so you might want to try to sell on the way up, just before your target’
yes… I’d like to see CFs harmonica
… opps, wrong person… his chart
i also likn VSLR….
exactly… scale in… scale out….
L M A O … oh did I …… ;o)
What do you make of the up tick in volume on NUGT? Refresh….That’s a lot of action
… i ‘think’ we are in 4of5 in some of the miners….EWers??
so .. in the 5th wave…. just finishing 4 heading into 5 of 5….(down) probably truncated tho….
are we topping in GDX/double-topping in GDXJ?
MACD is suggesting we head down now (or sideways)
Time frame?
I didnt see it
it was on the 10 min GDXJ (PPO shown, not MACD.)
also.. GDXJ seems weak at todays close compared to GDX .
may be an opportunity for us to load up some more on a pullback… hopefully 🙂
the double top i was referring to was the 2 peaks earlier today.
Keep us updated if you see something, SOG. I’m worried that I’ll jump just as we top in the 2nd DCL; that would really be my style.
Cason… lol.. u R 2much…. i just literally laughed out loud at this …
we’ve all been there .. done that.. for sure…
lol yeah, mine too…
will keep my eyes peeled Cas..
must admit.. not sure those shorter time period momentum divergence signals are as reliable as the longer ones.
I’ll try to post my entries so you guys have time to get out before it crashes.
you were too busy sitting motionless watching sd take off …
Idk, I’ve been looking at Wave 5 ending diagonals and truncated 5ths for 18 months now. Someone, wake me up when Major1 of Primary 1 is confirmed.
where’s the chart? Come on man
LOL… im working BillyBoy… but some.. like AKG.. im LOVING. “.. an ending diagonal for a move back to the origin..and then some” – (thats EW experts talking) looks textbook….
https://www.tradingview.com/x/CyOgEKj4/
@ray ?? do you have *some) miners in 4?
Why can’t you multitask?
… your gettin to be quite the smartypants… billybob… ;o)
Volume is very strong in the miners today. This looks like a real move. GDX over 27m NEM over 4m already.
And then there is this danger, thus the need for a small basket if trading individual miners
See RBY
http://www.marketwatch.com/story/rubicon-minerals-temporarily-suspends-mill-operations-underground-operations-continue-during-the-trial-stoping-period-2015-10-05-6173143?siteid=bigcharts&dist=bigcharts
I saw that, Alex, it’s in my basket of lottery tickets – thankfully it is a very small basket
However, if I buy any more GDX/J, I’ll have to change my business card. At some point, it will be time to either trim those back or more likely for me, sell covered calls to reduce cost basis
Alex, I would sure appreciate your input on when that time might be!
I think RBY is a well run company and today’s price is an overreaction to the news. Do you have any ideas for possibly jumping into this pool.
I dont at this point in time. That is a huge volume dump…even if its capitulation, its hard to know when it’ll spring back, if those lows will be re tested etc.
Maybe later (Look at a 1 yr chart of WG. It may take time to recover like WG )
Sounds like prudent advice. Thanks!
WG (AGAIN)
That’s a new stock for me?
I had it in past reports – it was a little rocket. kind of crazy when you look at it on a 3yr wkly too.
i know.. crazzzzzzzzzzzzy
SD just passed it %-Wise. CRAAAAAZY
HK has been good… healed some of my wounds from trying to catch the knife… ;o)
CRK also.. wooo Haa
maybe a bottom in GDX finally, after 4 long years
still own it :))))))))))))))))))))
yes…i thought of you the other day frenchie… nice nice nice…
Energy stocks are going crazy
You guys probably didn’t see my BAS chart from this weekend, did it on Sunday so posted on Fri PM report.
BOOM!
I’m already at work by the time morning reports come out so can’t post charts until 10PM that night, sorry can’t share more.
wow.. whatup with the volume in DUST…
Check my post earlier, just the opposite of NUGT. Money moving . If you have time, I know you’re busy working.
I noticed Huge volume in DUST here too , Maria.
Yeah, Crazy.
hilarious (not)
nice cycles btw …will you be falling off one (i mean) riding one in the next report?
selling out. Volume on average was higher in the spring.
I sat there and watched SD just climb & climb & Climb. First Friday and then today. Wow.
Alex, please keep up the general market analysis. Scaled out of 2/3 of SPY long calls to assure profits. This was a big win for me (200%) and I needed it. Left a runner just in case she keeps going. Your analysis has been timely, accurate and original, we definitely have a leg up on the crowd.