
Lets Look At The Big Picture
Every now and then I like to step back for the weekend report and take a look at the Big Picture. I have been reporting for months that I see big picture changes in many sectors starting to take shape. Lets see if they are advancing or falling apart.
The SPX is approaching resistance. Will it halt the rise, or possibly just give it a pause like we saw in 2011?
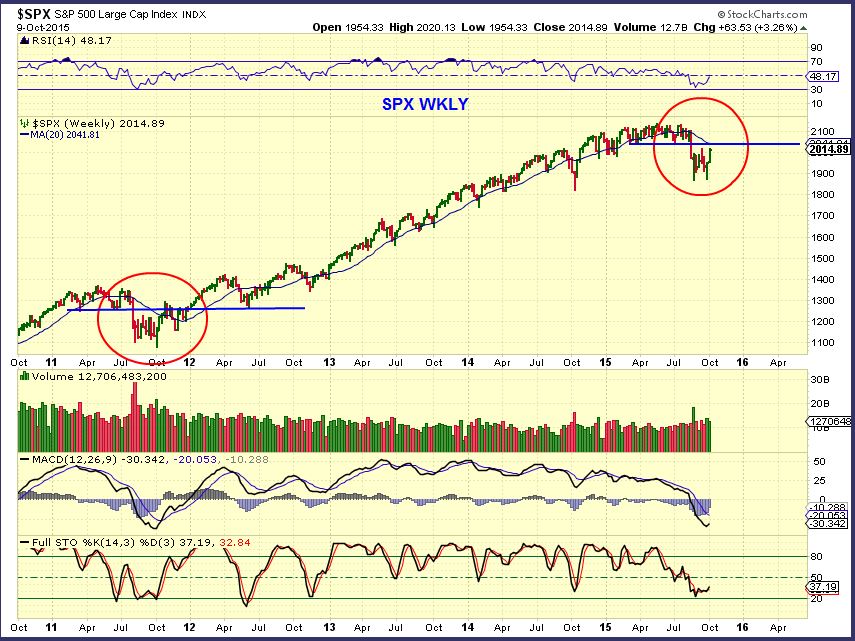
Lets look for some clues…
I have been longer term bearish since the early summer months and after the recent smash down, I did expect a bounce. While these markets could still roll over, right now there are short terms signs of strength.
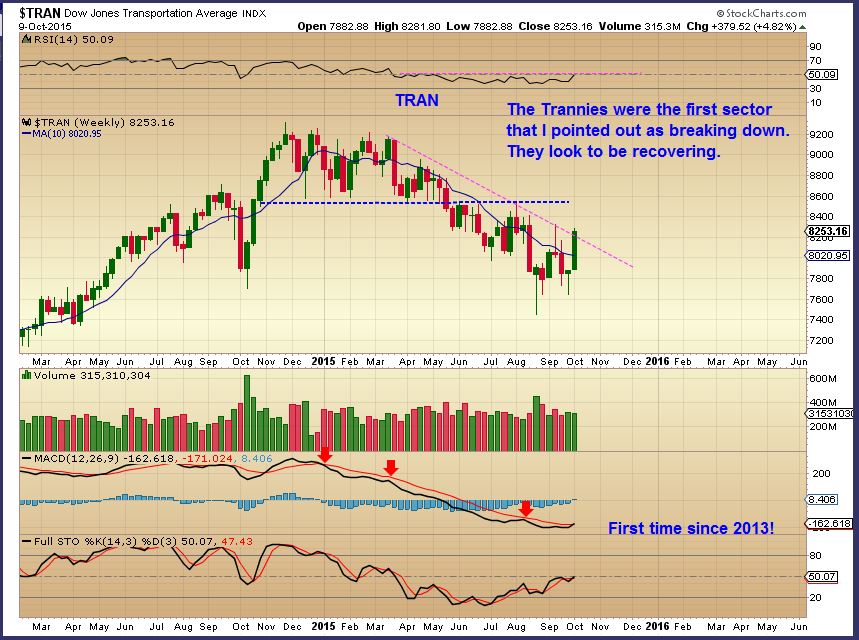
The TRAN was one of the first sectors to started breaking down. It actually looks to be improving (See the MACD).
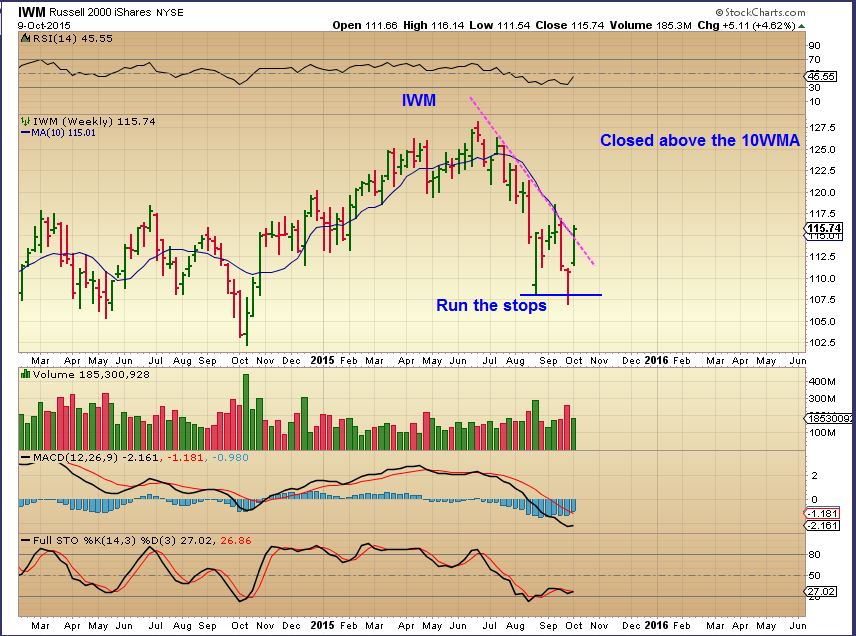
IWM – The Russell 2000 ( IWM ) broke above the 10MA and closed above this downtrend line. Watch it this week for follow through.
SO I am watching the markets at this point to see if they are going to continue higher or roll over.
.
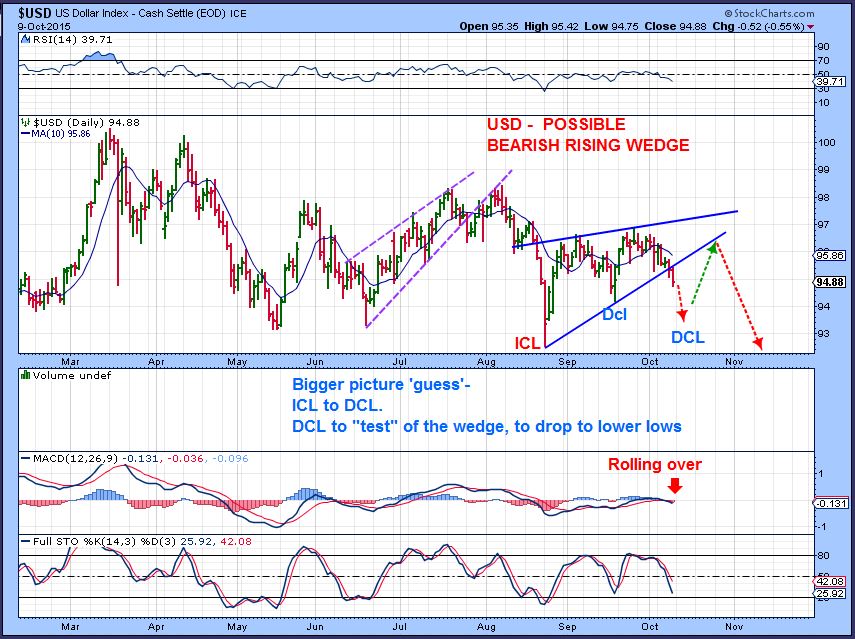
USD WKLY– The Dollar remains weak at this point. You could make the case for lower highs and lower lows and a reversal at the 10 MA
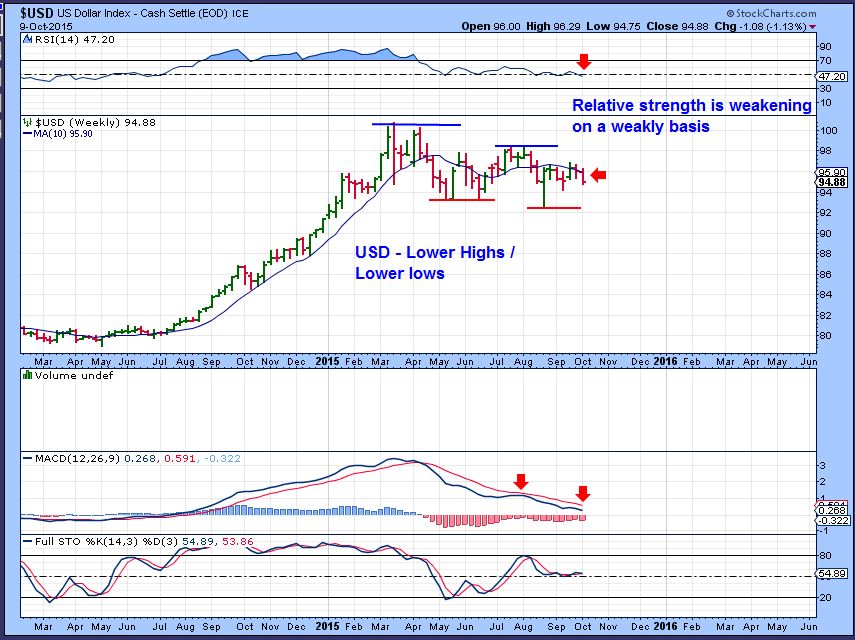
We are close enough to see a Daily Cycle Low soon, So I am simply guessing at what I can see as a possible path. I see a Bearish Rising Wedge break down. This would play out nicely for commodities. The “Test” of the wedge later for the dollar could send Gold into a DCL.
For months now in past reports I have been saying that I can see possible LONG TERM lows in Commodities and Precious Metals. That would line up nicely with a long term top in place with the dollar. Lets step back and look at some long term charts that show that this is still playing out.
.
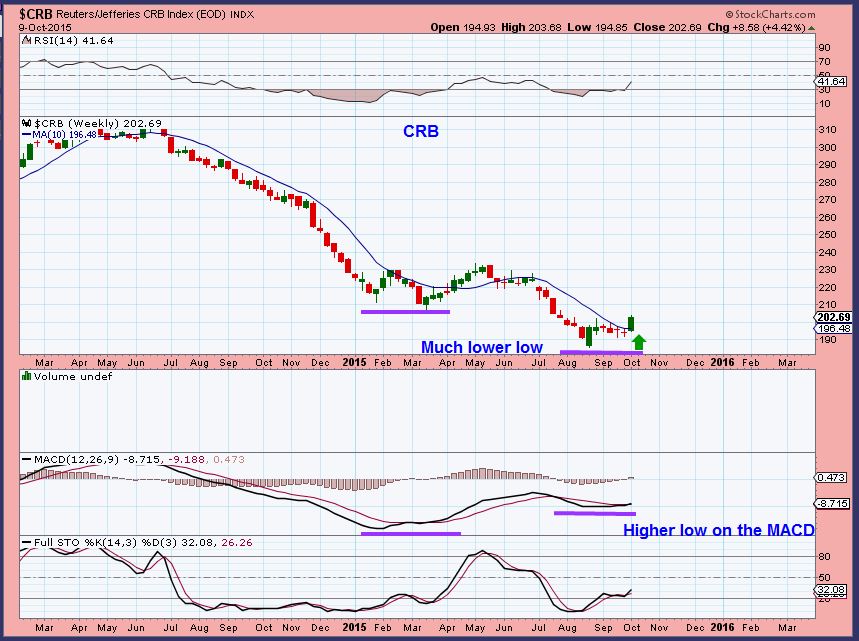
CRB WKLY– With lower lows, the MACD has strong bullish divergence. It broke and closed above the 10MA.
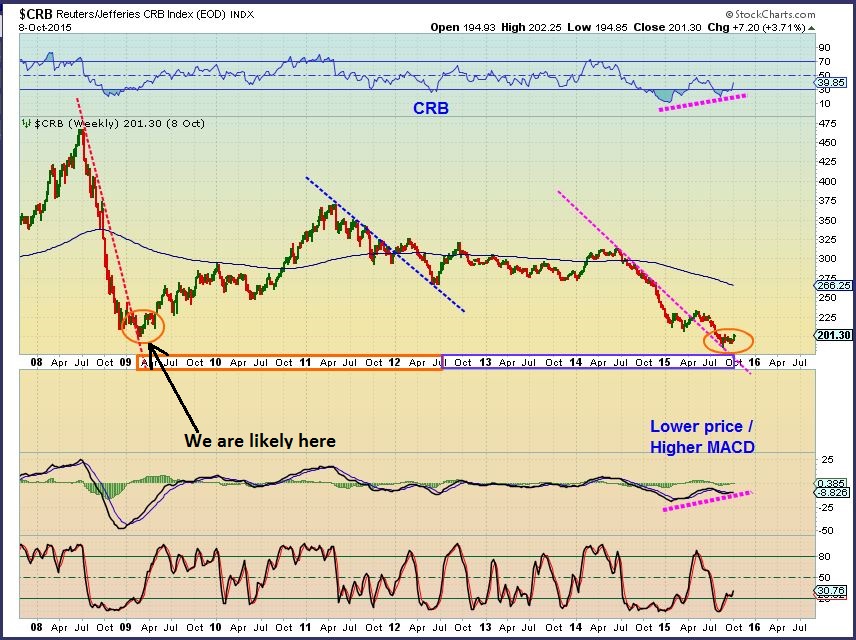
BIG PICTURE $CRB – Break out & back test in place? These may be THE commodity lows for many months.
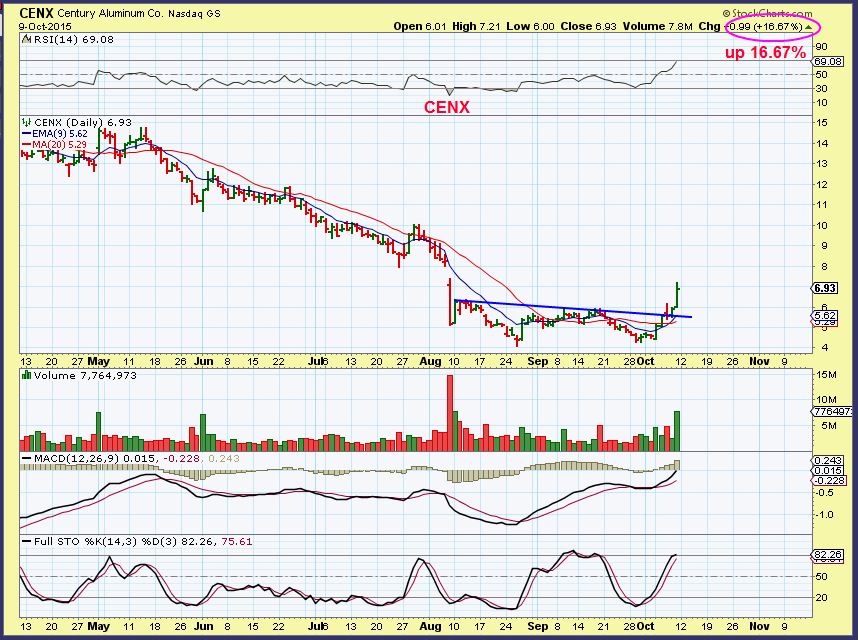
BIG PICTURE THOUGHT: So with the beat down, sell-off in commodities for many months, we should see some great buying opportunities. I pointed out VALE, SCHN, X, AA, AKS,CENX, FCX, MTDR, etc in reports recently. The above chart could be indicating that these will stair step higher for many months now.
.
CENX below is an example of what we are seeing now.
The first chart is my Oct 7 chart at $5.57.
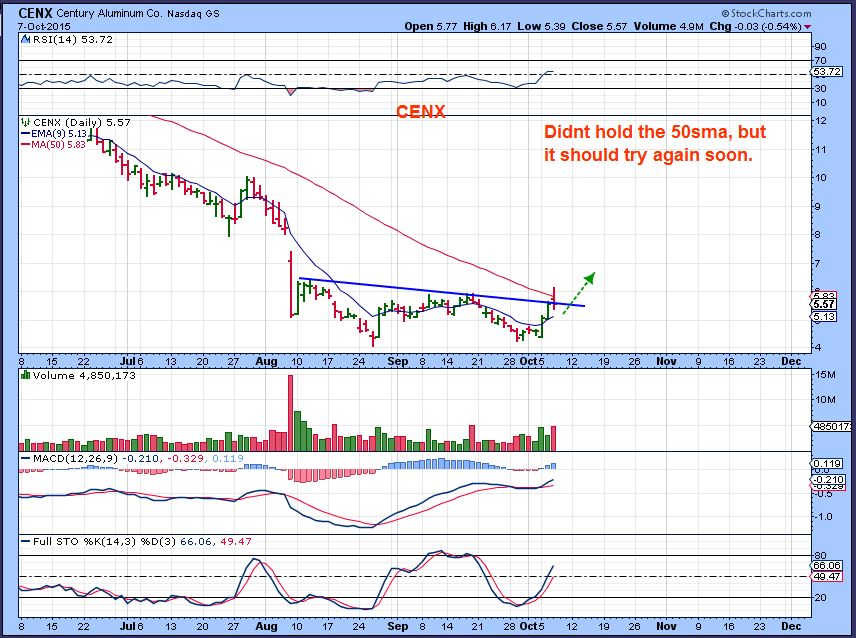
2 days later it hit $7.21
WTIC – I expected resistance at the 200sma when I posted this chart.
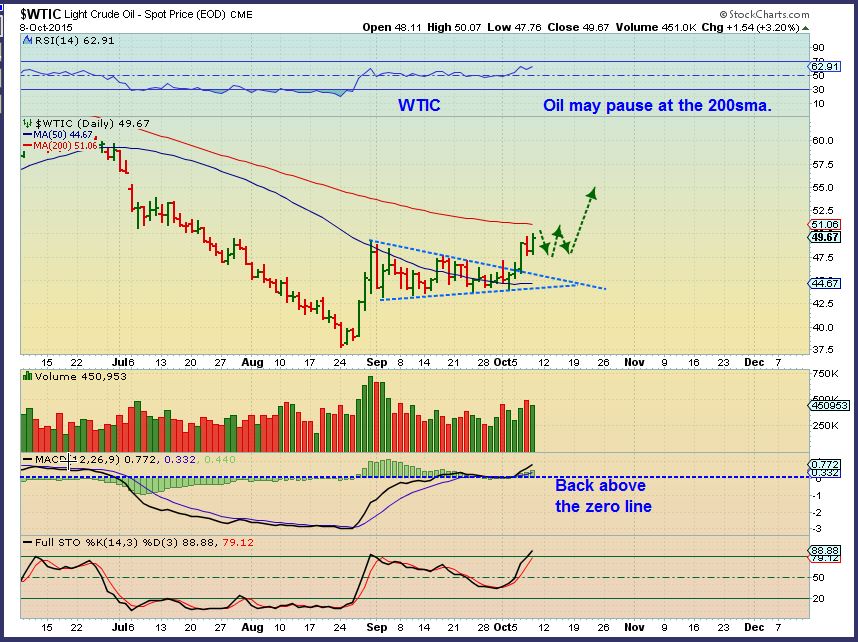
Friday – reversal at the 200sma. I expect a pullback and then a run higher.
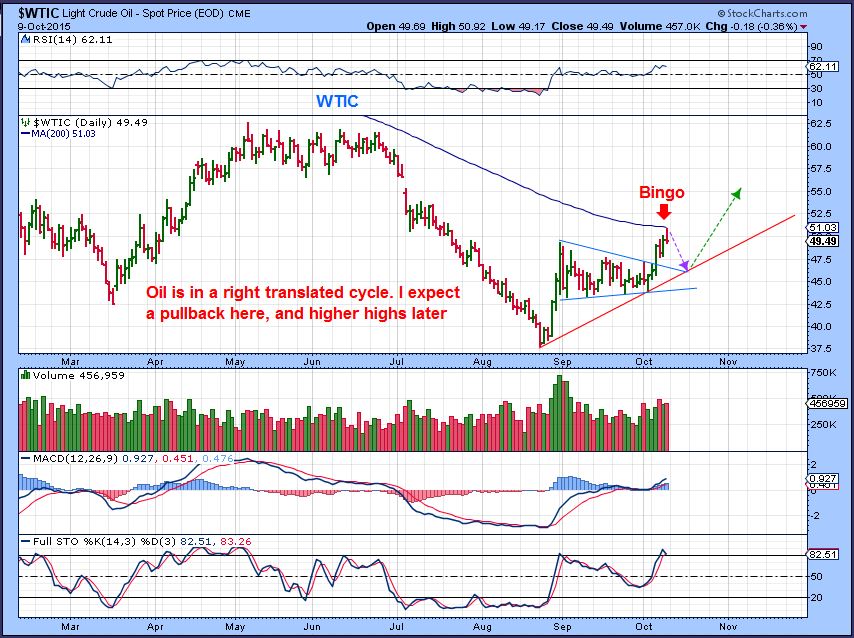
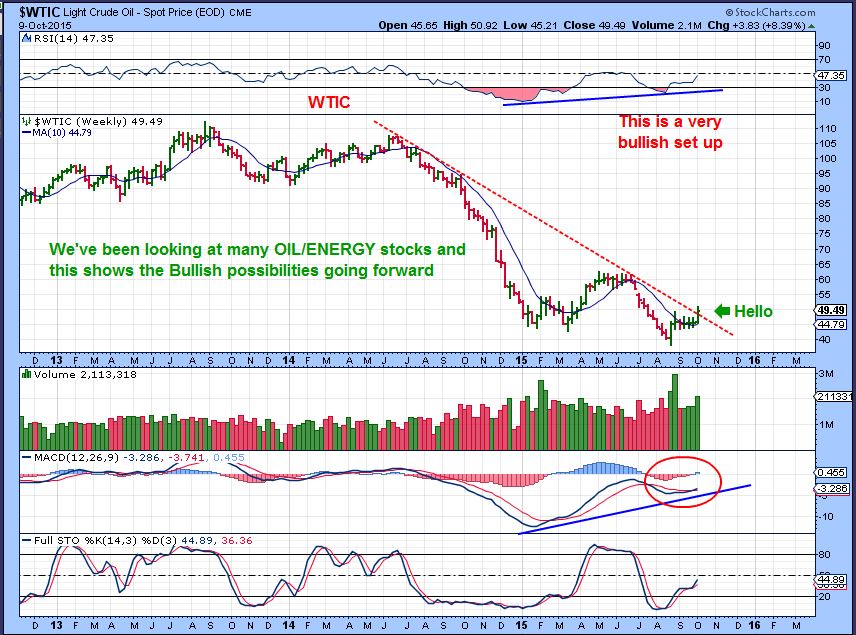
BIG PICTURE OIL : This break out may indicate that the lows are in. OIL/ENERGY STOCKS are rocketing out of their lows. Strong capitulation volume was seen in July.
GOLD,SILVER,& MINERS
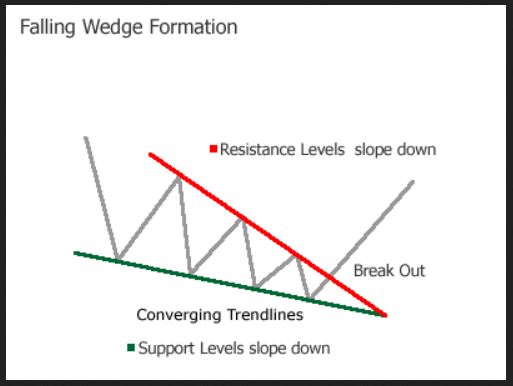
BIG PICTURE : Descending wedges are bullish
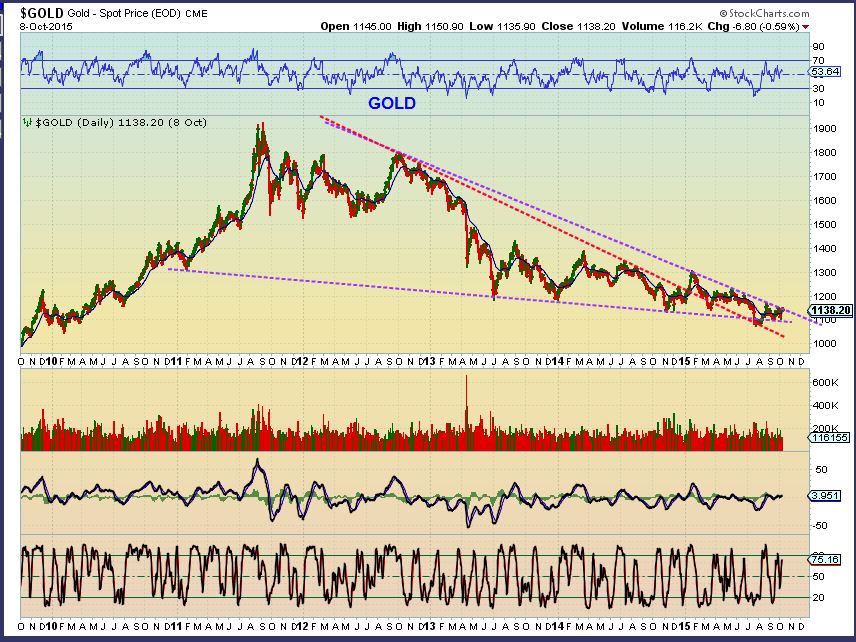
GOLD WKLY – I drew this up on Oct 8. We have broken out above this purple line on Oct 9 and that is Bullish. Even before we broke out, I drew this to show that we may have broken out of the red line and back tested in the January run.
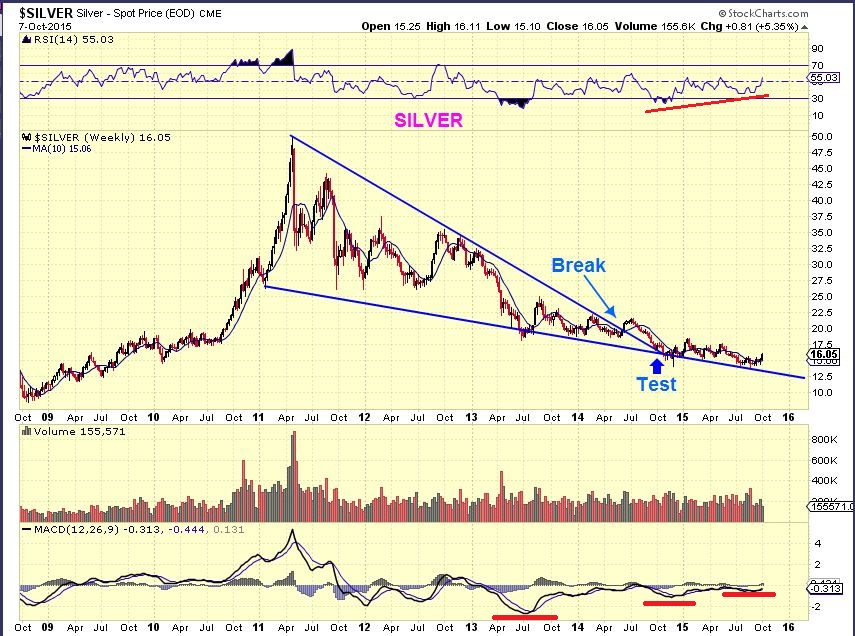
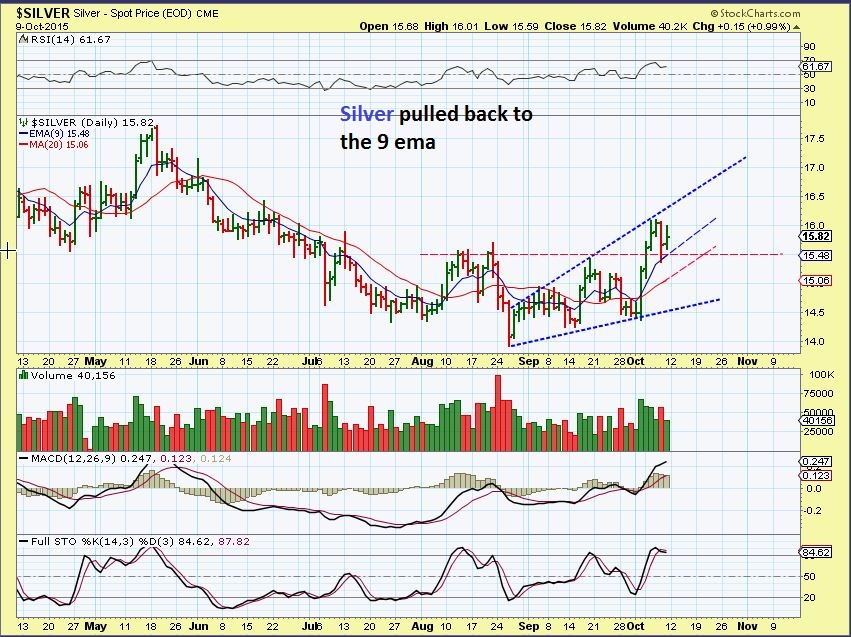
SILVER – Strong divergence. On a linear chart below it looks like a break & back test bottoming process. Nice weekly divergence. On a Log Scale, Silver is close to a break out.
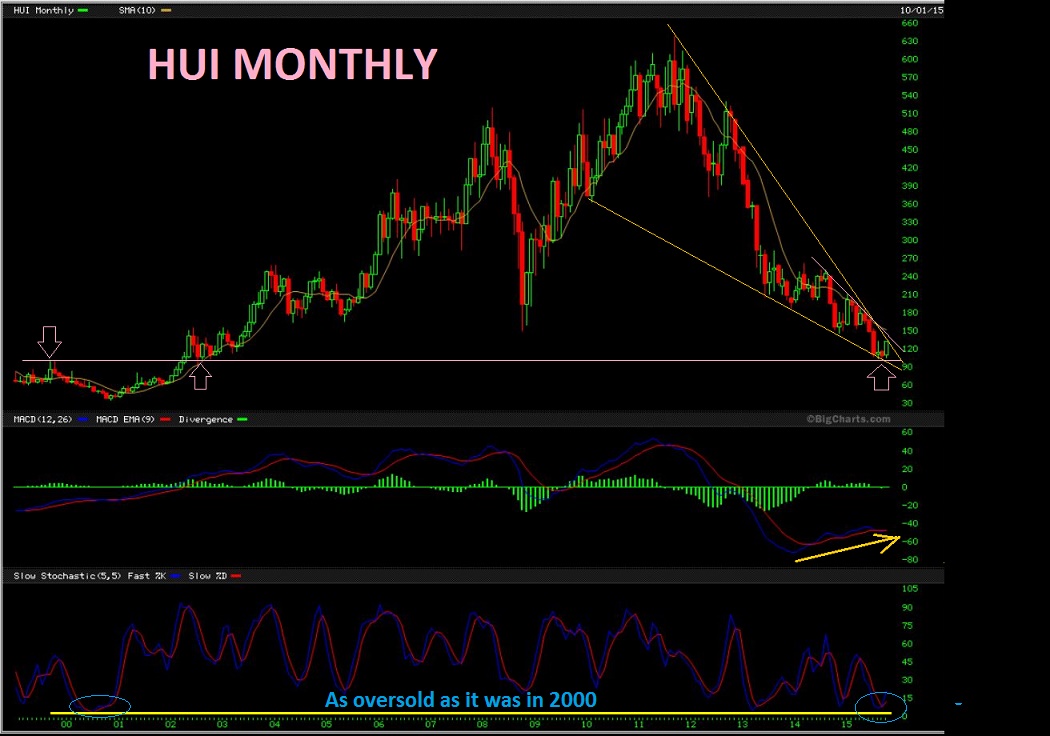
MINERS HUI – This could be a monthly descending wedge. A break out is bullish.
The Big Picture is shaping up nicely in OIL, The CRB, and GOLD ,SILVER, & MINERS. Lets zoom in on the shorter term moves now.
Gold wkly close up – breaking out of a smaller wedge is bullish.
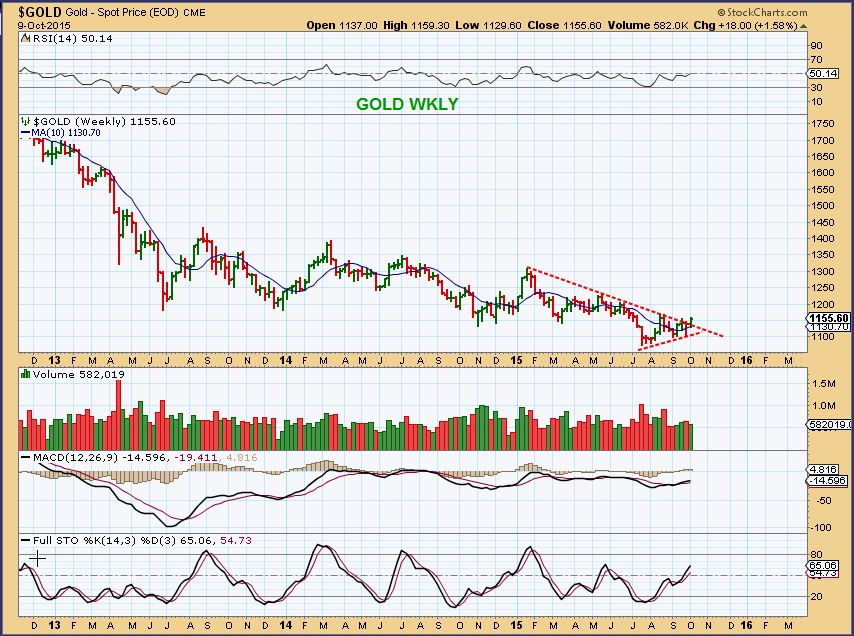
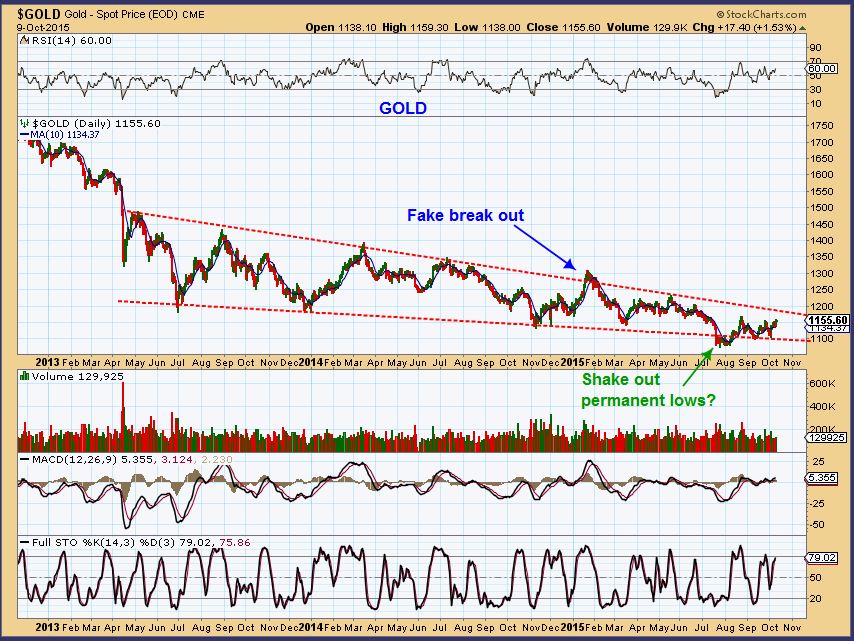
Gold is NOT breaking out of this channel yet, so we’ll still take it a little at a time. It looks like a possible shake out at the summer lows.
SILVER- Tagged the 9 Ema. As I mentioned, sometimes price can just keep climbing from the 9 Ema.
A close up on Miners. I see so many interpretations and guesses at how the Miners will play out using E.W. and many guessed that it was pulling back mid week last week.
If you look at the example below, the 1-2-3-4-5 pattern from Dec – Jan highs could be used as a possible path. That slight red blip in between 2 to 3 was not the real pullback yet. GDX may climb a bit more.
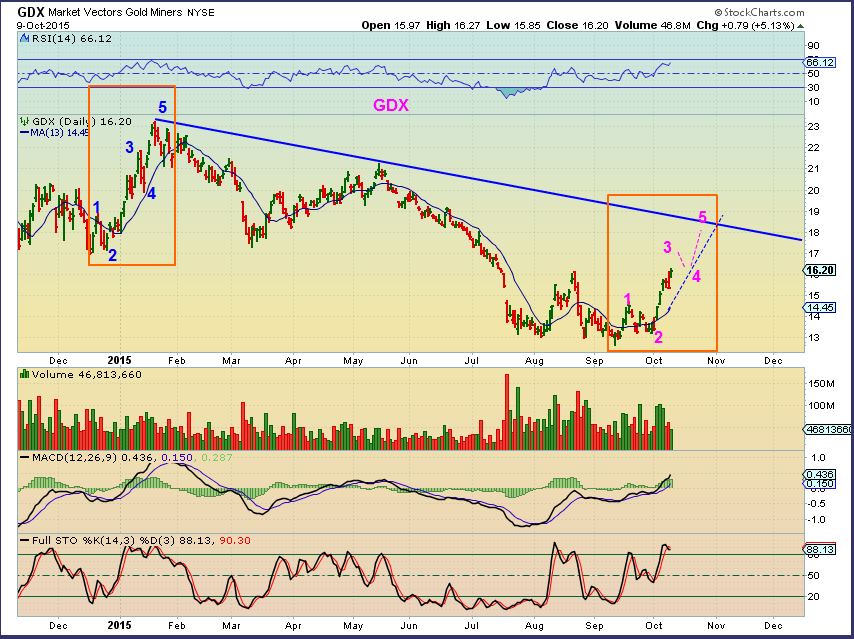
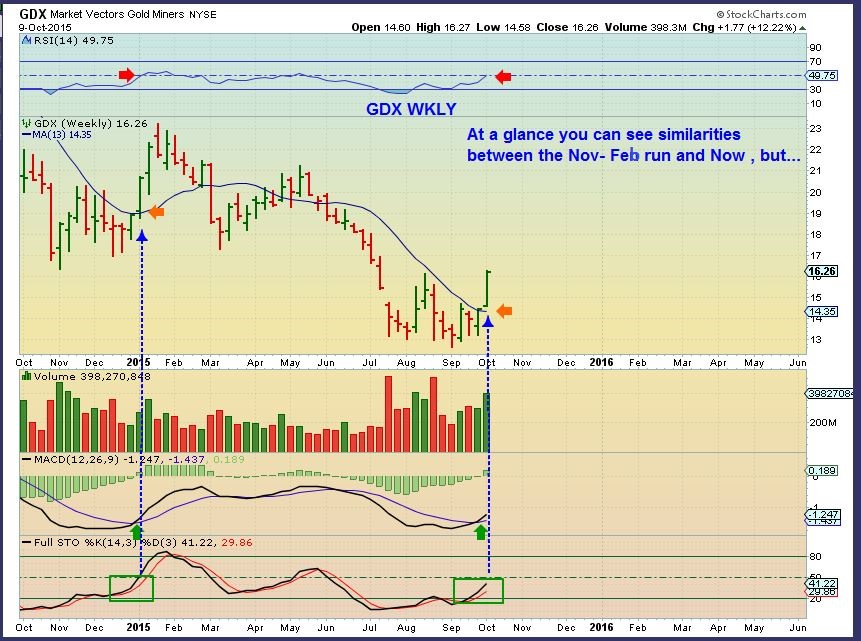
The weekly chart of GDX also looks like Last January, when GDX burst above the 10 MA. Notice how in both areas the MACD crossed , RSI went above the 50% line, volume swelled, etc. GDX went higher the following week and then gapped higher and pulled a reversal. They look similar, but there are bigger implications this time. Why?
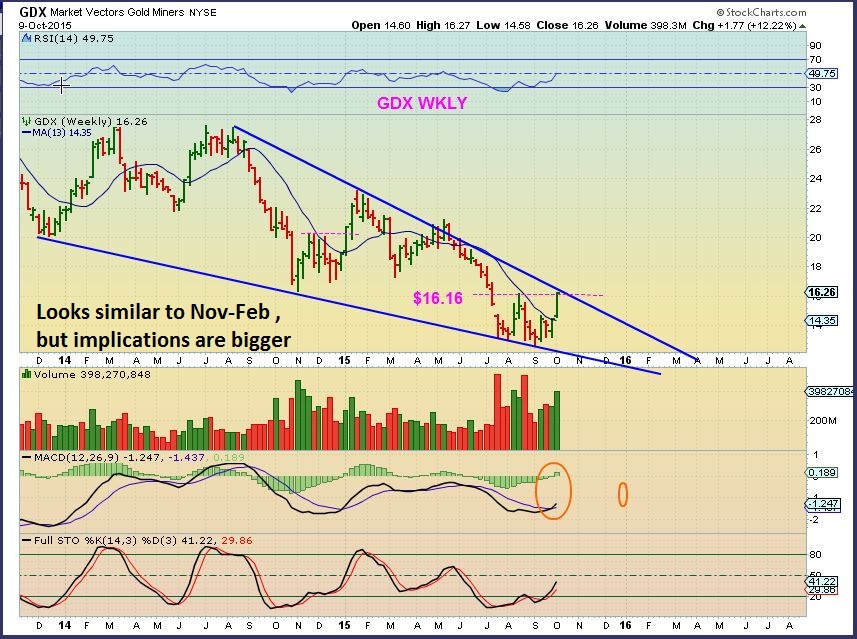
GDX – A move higher this week is actually a break out this time around.
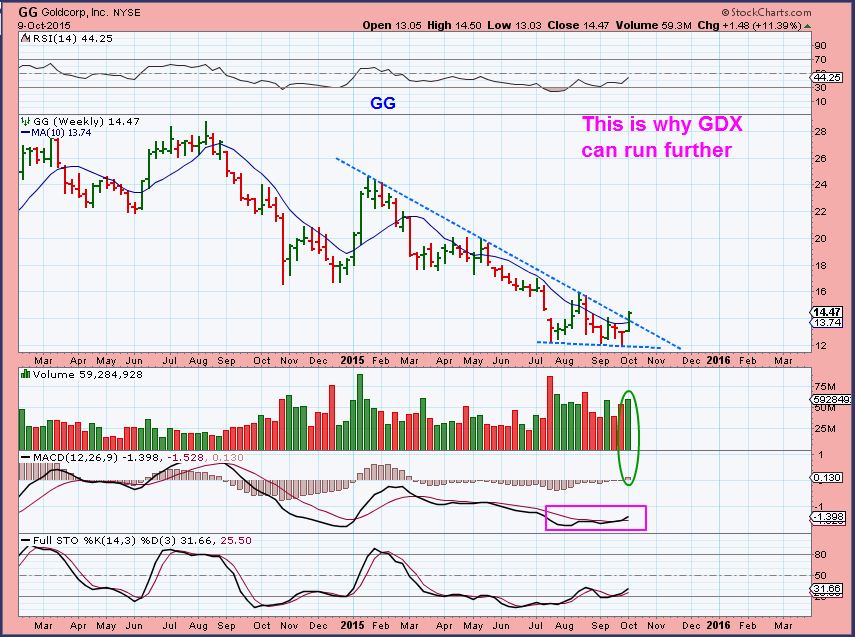
GDX is made up of a basket of stocks, with GG, ABX, & NEM as its main components. When I look at their charts, it looks like they have further to go. Again, if Miners have bottomed, they have MUCH higher to go.
GG – This might be just getting started.
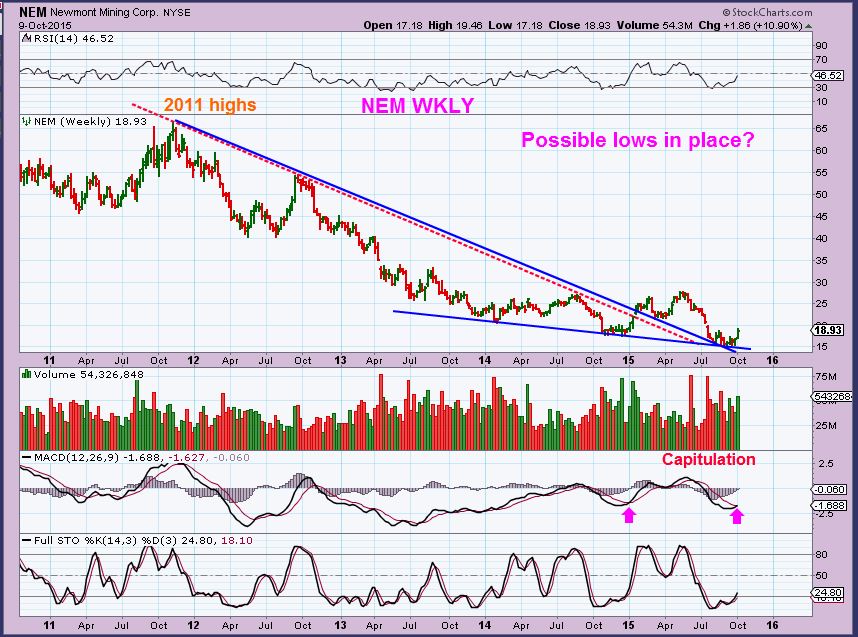
NEM – NEM as a falling wedge may have bottomed for good.
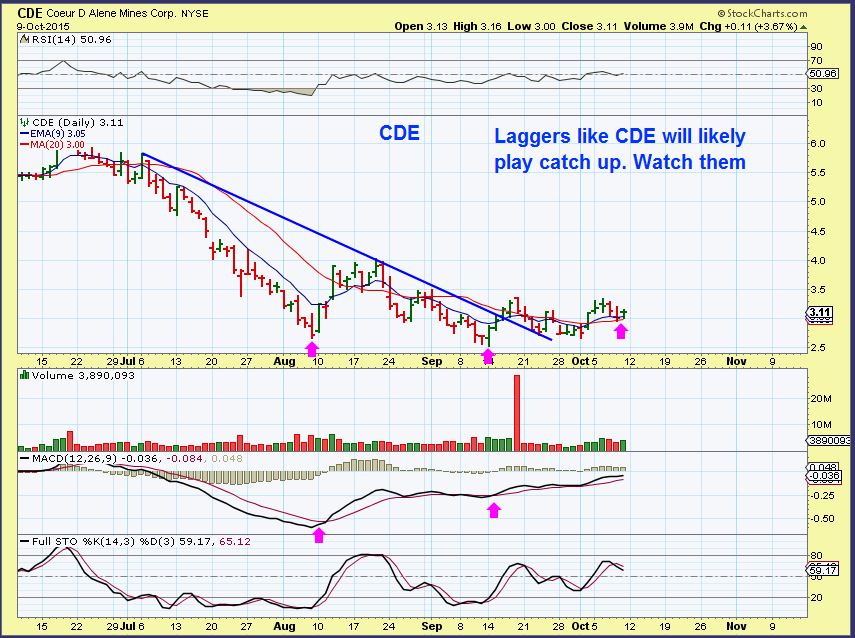
I’ve been pointing out Energy, Metals, and Miners as some nice trades in the past few days and weeks. Last Fridays report was specifically highlighting set ups in Energy stocks that are still low risk set ups . I will point out more as the week goes forward and they develop, and also if we get a pullback in Miners, we may see some nice entries too for some short term trades. Some Miners are acting like laggers & May play catch up. Keep an eye on them if you find them.
CDE – Is an example of a lagger. It is sitting on a support area.
Looking at the big picture, things really look to be developing into a long term bullish set up. Some of these OIL stocks and Miners that we look at will offer huge %-Gains if they return to former highs over time. Look at that chart of NEM above. It went from $65 to $15 in the recent drop. In a recovery, $15 to $65 will make for some great returns. This means that some who are a bit more conservative and want to wait to be sure that the lows are in will also do just fine. Eventually buying NEM at $25 and watching it return to $65 or higher will be great too.
So we are keeping an eye on the big picture, while trading the set ups in the near term. Have a great week and thanks for being here.
~ALEX


I didn’t spot any typos Alex…but I was working until 1.45 am this morning myself!! So I may not be the best judge!! Excellent report as always though and as you point out so well, potentially on the verge of/start of some major trend changes. For those of us who tend to invest on longer term time horizons, that is music to our ears. 🙂
With gold at 1700 I would say Maria’s box is broken and we should be looking up not down.
I wouldn’t count Maria’s box out just yet Bill!! Lol I still see scope for a minor pullback in GDX for example, to create an ideal looking 4th wave set up and give the lauch pad for the 5th wave up into later October. But if we did see that pullback I would see it as very short lived and possibly not much lower than 15.50 on GDX and almost certainly 15.10 max if it went any lower. But overall it defnitely looks like things want to break loose again on the upside as Alex points out. You shorter term traders will love it. 🙂
My expectation is still valid from 9-29-15. See below. The harmonic pattern looks like it could play out but the gold colored candle pattern is the same as the last ICL. Looks like around 18 GDX will pull back. The Gold colored candles have been a pretty good road map.
I was seeing 18 as a potentail target for the wave 5 top and firsr intermediate high. But I have no probelms if it makes it to nearer 19.0 in line with your ‘harmonica’! That would take it close to a major downtrend on a ‘log’ chart so would be another attractive target area for this hoped for first major wave up.
You can see where I got the road map in the red box on the left. Notice there was a big down turn right after. However, if we are now in an uptrend, it may be a minor correction. No pun intended.
Definitely LOTS of similarities with last Nov/Dec. Alex has also mentioned that a number of times. Although this is getting ahead of ourselves as we haven’t even seen the outcome of this upleg yet, but assuming it plays out as an impulsive 5 wave move up in EW terms (to make a larger wave 1 of an even bigger five wave sequence) and thus would potentially be the very first minor wave up in a brand new bull market all I would say is that under EW rules, the wave 2 pullback is permitted to retrace up to 100% of wave 1. I’m not saying it would but even if a new major bull is starting that pullback could just be a bit more than minor. But that wave 2 low whether deep or shallow becoems the real ‘sweet spot’ for loading up, especialy on longer term investment positions. It would be intereesting to know/see how that ties in with Alex’s cycle analysis once that starts kicking in again in a more normal way. Presumably Nov would take us into the time frame for the next ICL? A perfect spot for that larger wave 2 low maybe!?
It all depends on where I place the candles. Its not a perfect fit, so there is some error. I may have them too high or too low on the over lay.
Just out of interest…where are you seeing gold at 1700!!??
1170, I fixed it in the comment.
Sorry. I hadn’t refreshed and it still showed the original figure. I did wonder if only!! Well hopefully one day soon. 🙂
i c my box is on your mind today… again ….
L o L
Maybe Bill didn’t treat your box
Quite as good as he should have
Maybe he didn’t love your box
Quite as often as he could have..
I know that song, I don’t remember BOX being in it!
That has me laughing my socks off!! Hahaha
🙂
Always……
ALEX ZAZA! WOW…………..
Alex, Maria, Chris & all Elliott Wavers…
had a detailed look at GDX/J to see if the discrepancy with waves recently was resolvable.
It would appear they were/are on different type final (?) waveforms as explained in charts below.
.. but since rallying i now have them in same wave phase.
Wow. Great looking and detailed analysis. Very impressed with those and most definitely like your conclusions!! 🙂
i have some bearish versions, to keep things balanced… but i dont think they match-up quite so well.
I’ll post ’em in a short while
Great to keep an open mind and see possible alternatives. A real discipline that’s never easy to master. It’s all too easy to make a really good looking vaild analysis and then become ‘anchored’ on that and start believing that the markett must fit our preconceived ideas. That’s one of the things I’m really appreciating about this site. You see one thing and sometimes someone else sees something different. It can make a very useful ‘balance and check’ sometimes. As Bill said, ‘thanks for sharing’. 🙂
Nice chart SOG! Thanks for sharing. I agree that upper trend line is key. If we did bottom, we should break thru.
The other thing that sort of jumps out from those charts and also the gold one if you take a look is that all that price action looks like some kind of ‘coiling spring’!! And thay all look like they are starting to release to the upside now. Just has a very appealing look the moment you glance at the charts. Like Alex says, sometimes keeping things simple is often the best. But very impressed with such detailed analysis. 🙂
sweeeeet .. sog!! luvit.. i had that 5 as truncated as well .. i hope that is the case… nice work!
On the GDXJ can V have it’s lowest point at the beginning of the wave if it truncates (I have no idea). This was very detailed (Impressive!!). Thanks for sharing
happy to oblige Cas..
those final waves were bugging me!
I have GDXJs V as short, but not actually truncated (im assuming thats what Maria means?)
I think that ‘truncated’ officially means it doesnt exceed beyond the bottom of the 3rd wave (as in my zigzag truncated Cs, which don’t manage to exceed past the A)
..and here are the bearish versions, suggesting we are in wave4 only
That was a pretty nasty reversal in GDX this morning, especially with gold up as much as it was, dollar down, and no other catalysts. Short-term top here? However, the volume is certainly nothing special and miners were considerably overbought. Likely this is the potential mid-point or Wave 3 (end) to 4 (start) pullback? Which could give one more buy trigger before we might want to cash out and watch with interest. FSM went from a way outside upper BB poke of 2.84 to give back 20 cents already. That’s definitely a reversal candle.
That’s my current best guess Cason. Minor wave 4 pullback underway and then a wave 5 to follow to hopefully complete the very first larger wave up in a new bull market. It will be the pullback AFTER that,which will provide a LOT more clarity. Maybe Nov time and potentially the next ICL?? But almost clueless regarding cycles so we’ll definitely need to be guided by Alex on that one.
Yeah, a lot of seem to be on same page. I hope it’s the right one!
EMA-9 was at $15.32 this morning and sloping sharply upwards; still a viable target in next couple days, it would appear.
You, me and everyone else I suspect!! Interestingly I have around 15.36 as a very likely target for a potential wave 4 low on my 1 hour chart. It’s the area of what I think was the even smaller subwave iv low which is a classic EW target and lines up nicely with Alex’s guide of the 9/10 ema
GDX hit the upper trend line from the previous peaks. Alex showed it above on the GDX weekly. Pullback expected, but for how long? Shallow or box?
Alex, any particular timeframe for oil to bust through the 200-day? I’m trying to be much more patient and methodical this time – have had the calls correct before but been too immediately aggressive so not done well while waiting out the move. She fooled me when over $50 overnight then gave it all up pre-market. I have my limit buys ready on BAS if it pulls back to 9-ema. I sure picked a crappy time to get into DGP. Dang 🙁
Sold my energy stocks this morning. Don’t like this negative action. Many are at 38.2% already
Yeah, it went from a bit of a pullback to just flat ugly here recently. Barf. I am pennies away on a couple of stops. If we are done tomorrow I would certainly lose my positions. Back to the same tough dilemma I always have, is this the time to add on weakness or the time to step out of the way? My positions still above 9 EMA and 20 Simple. Mad about GPD purchase – I scaled into everything else so while I hate giving back so much today, really I am fine on most. Bought GDP in one tranche. Oops!
I own GDP and it is back to where I got in – it is unfortunate to see it lose the 50sma, but it is still holding the 10sma and the base itself is not damaged.
I’d like to see some of these close higher than todays lows, I’ll have to see where they want to close. Intraday wiggles can be tricky.
XLE closed pretty far off the lows of the day. GDP did not, but the share price is so low that a few pennies is a big % change, so not that surprised. Don’t want to see it lose $.70; if that happens I’ll have to take the loss and try again.
do you trade intraday the 3x etfs NUGT and DUST?
As I said I sold Energy Yesterday morning. I then took a position in DUST. Still holding. I trade 3X ETFs way too much. Sometimes a day trade sometimes for weeks.
No real time frame- I do expect OIL to drop down and it ‘might’ go as far as to test the 50sma and the triangle / flag that it just broke from.
any of u gents watchn crude trade?
think a nice scalp in the making… u???
https://www.tradingview.com/x/RCVo5396/
I’ve got something very similar building on my 1 hout WTI chart. I have a completed 5 waves up. So either that’s the end of the rally from the 24 Aug low and it’s an ABC correction or that’s just the first subwave higher of a larger 5 wave pattern. I’m fancying the thought of just the first subwave of a larger pattern up yet, which would make this a potential wave 2 pullback but looking like it may probe a litttle lower yet. On crude itself I’m watching the 47.80/47.90 area for a potential wave 2 low to form.
hmm.. looks like it’s finished .. and heading down… ? I think it’s an ABC -and possibly it’s now in wave 1 down?
For me, way too early to say. On my 1 hour chart price is still above a rising 200 ema, which from a trend following perspective currently still leaves it in a technical uptrend. Of course that will start to change if price breaks back below the 200 ema, which I currently have around 47.90. So could still be an abc type correction or something more bearish but way too early for me to call either way. So I would give the uptrend the benefit of the doubt until price action says otherwise. But that’s just my style of doing things..or at least an attempt at a style and I appreciate others will have a very different approach. 🙂
did u mean this?? https://www.tradingview.com/x/z69SpkPh/
Not quite. I’ve posted an update here. And the red line is my 200 period ema. Hope that helps? 🙂
Almost there!! Now we’ll see what happens next!!
Very closely. I added USO just recently. Slowly adding a few calls at a time on big down days. Really playing for a move up to 54 on crude before long. USO came back to 9 EMA; WTIC still a few cents above but pretty close. This was quite a harsh move down. Especially on what should have been considered bullish news out of OPEC over the weekend.
Here is my 2 cents (refresh) on crude. Looking at USOIL, the pattern appears to be repeating as it did last summer. I overlayed the candle pattern from last summer, see the gold candles. Looks to be headed lower. Don’t know how that fits with EW theory, but the candles indicate that it can happen.
Man, a near retest of lows and slow drift up would KILL my positions – sure hope we don’t have that again
Alex. Last week when we were discussing some ‘big picture’ aspects of markets, amongst other things you mentioned the Yen and some longer term correlations you’d noticed if I remember correctly. Just out of interest if you were bullish JPY/ bearish USD would there be a potential correlation with that and the general US stock market? And if so, would it be bearish for the US markets? TKA
well .. the top of “1” is 47.05 .. so if it breaches that .. my count is invalidated. my guess is they will touch it or get verrrrry close .. before next leg up.
Well that’s the 200 ema broken as support and now below the 50%
retracement. Your instincts that it’s over may yet prove to be correct! I would hazard a
guess that the line in the sand for the bullish case is a retest of the
broken wedge which is also very close to the 62% retracement around
48.6. The RSI on the hourly chart is getting deeply oversold as well
but nearly $4 off Friday’s peak now!!
I think I am starting my count from a slightly different place to you as well!! 🙂
omg reallly? look at this.. what a “coincidence” hmmmm …
https://www.tradingview.com/x/UBP08aOk/
I use the ticker “OIL” to track Oil too. It tracks it well.
k. tx
Me too Alex. Mine is a continuous price feed as well, so you get out of hours price moves as well. Not sure whether that’s a good or bad thing when trying to do counts but nice to see all the price action. 🙂
I like to watch it play out too – I’m not going to be at my desk all day though, just came in to check out a few things. Looking for light volume on the energy stock selling, and even lighter tomorrow if it continues.
REXX, BAS, AREX etc look light so far.
i like to watch too …
Glass – o – wine & a live streamin;’ chart – I can see it now.
“One foot on the gas and one on the brake”
o my
My count starts from the actual price low that occurs immediately after your 1 peak with the big finger!! Lol So I have a completed fave wave move to Friday’s high which also had bearish divergence on momentum indicators which is a classic sign of a completed 5 wave move. Since that peak around 50.9, so far at least we appear to have a simple a-b-c where c has just tested the 50% retracement of my larger wave 1 (i.e. the 1 that completed at Fridays highs). So this could still be a wave 2 of a much bigger 5 wave sequence and technically under EW rules wave 2 is permitted to retrace up to 100% of wave 1. However,that would take it back inside the wedge and it would hard to see that as good for the bullish case. So the question remains at this point. Is the current rally from24 August lows now complete or have we just completed the first subwave of a larger 5 wave move up. Decisions, decisions!! I’ve added my chart again as it currently stands so hopefully you will see what I’ve tried to describe! 🙂
Alex just mentioned to Cason about possibly backtesting the wedge before heading higher. So that would take us down towards the 62% retracment level of my wave 1 in the chart I just posted below.
The markets have run higher for many months with the dollar, so it is assumed that if the dollar drops the market will struggle, but I do not see that yet.
Commodities running higher may prop up the markets. I was looking at a correlation between the yen and Gold and Dollar / Yen – etc
Ah. Ok. Sorry bad memory on my part!! 🙂
I’m not sure that I mentioned it actually. 🙂
One of the theme’s with last week’s rally was that materials and energy were actually propping SPY up and were up 2x that of general market. The laggards were bio-tech, health care, momentum FANG type names, etc. Will be interesting to see if that continues the next couple of weeks.
Alex, Nice helpful overview the big picture today. The CRB picture looking good— with a little further development the potential for l.t. trades may be arriving.
Thx Rube-
The Big picture looks good, unfortunately today the wiggles in Energy stocks are more like waves 🙂 CENX , AKS, X , etc getting hit too.
Its tough when an energy stock drops 11%+ or so, but when they go up 11-15% 3 days in a row, no one complains 🙂
SO I am not at my desk much today, but I am watching how this selling plays out to see if it remains bullish or does it get a bit too ugly. So far, Not concerned.
Kind of interesting day for these energy stocks. SZYM, ULBI, AMRS, GNE, PLUG – (BLDP, MNGA down but not too bad).
most of these are on my clean energy / battery list however.
SPY – top chart above – S&P MACD and Stoch look they have a lot more room to run right now than the 2011 consolation at the breakdown. VIX was pretty much crushed today even with S&P only up marginally (low holiday vol might have been part of that effect). VIX futures starting to move back into contango. Hard to be overly bearish here, might be an intermediate low recently that sticks for at least a little while. Might.