
That Was Different – Weekend Review
The Dollar was ripping higher this week and we saw the Markets break out higher too. Oddly enough, Gold, Silver, and the Miners were staying green during that run higher too. That was different. Lets take a look at the weeks action and discuss what we are seeing.
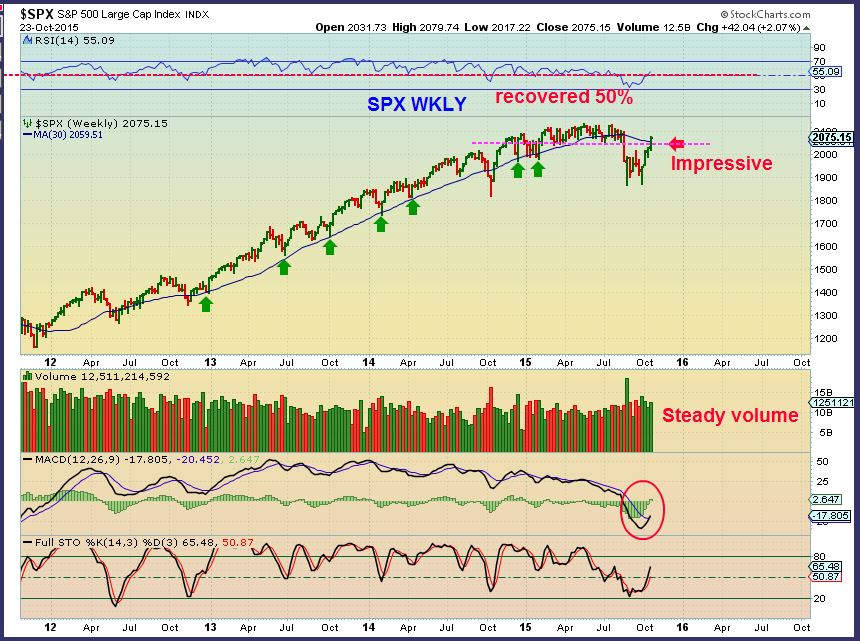
SPX WKLY – This was pretty impressive, I expected at least a pause at overhead resistance. Notice the break above horizontal resistance / Magenta line too ( I will discuss that in a moment).
I had this chart in a report last week, to show that the SPX broke down from a long term channel and may struggle a bit ( Just a Back Test or break back inside?). We are very close to breaking back inside.
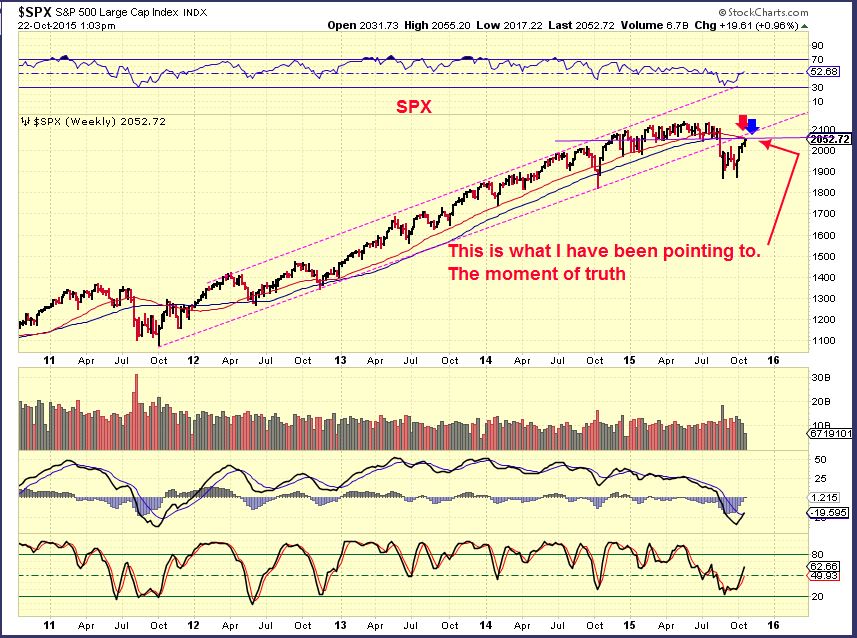
So here is what I wanted to look at next…
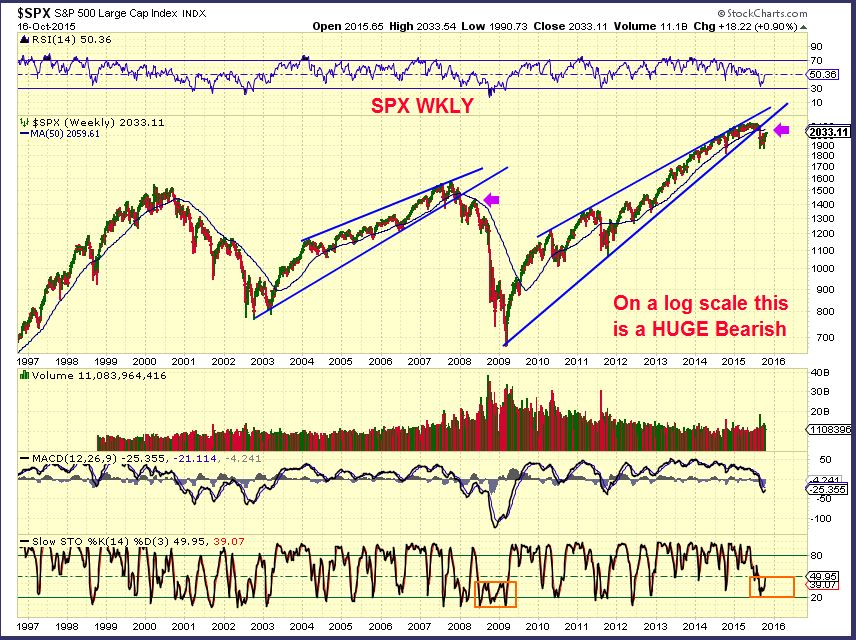
Longer term using a Log Scale – I have actually been pointing this out for over a year as it slowly reached the apex. We broke down and may just see a back test soon. This will keep us alert to possible bearish longer term implications down the road. If the markets are racing higher into the Fed Mtg, what will they do after ? It may pause and drop, but what about that Break out above horizontal resistance/ Magenta line in the first chart?
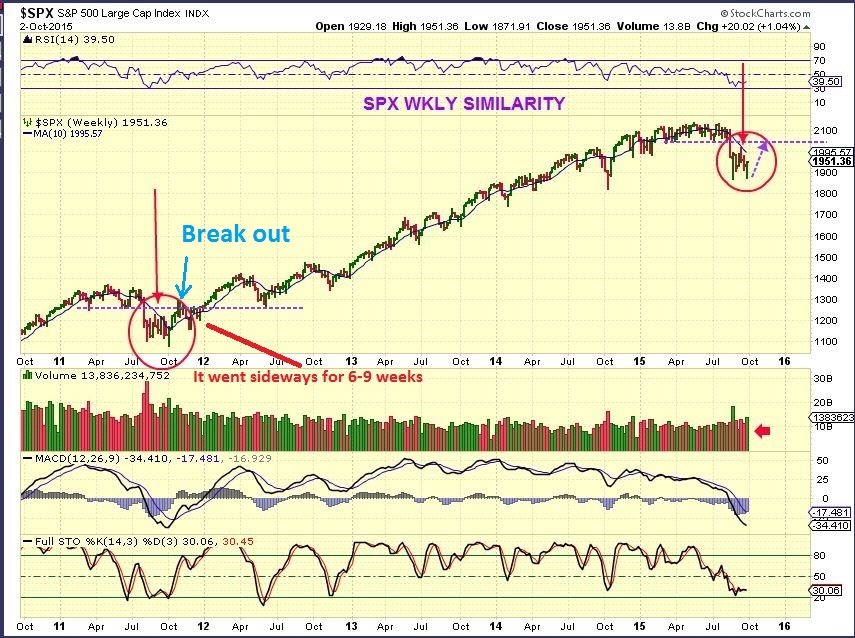
Notice that SPX broke above a horizontal line in OCT 2011 and then dropped back for 9 weeks of consolidation. A break out that sucked in many to the long side, and then ‘nothing’. Could that happen here as the Fed Speaks?
NAZ WKLY – We have Earnings results and many seem Bullish , yet others are quite Bearish ( esp retail ). Add WMT to this list of bad. Right now the NASDAQ has been very bullish coming out of those lows.
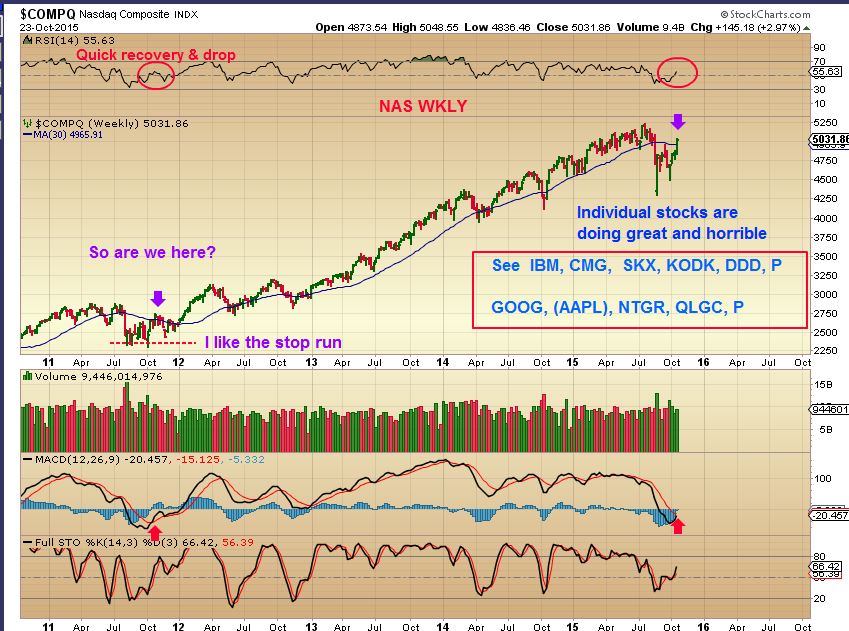
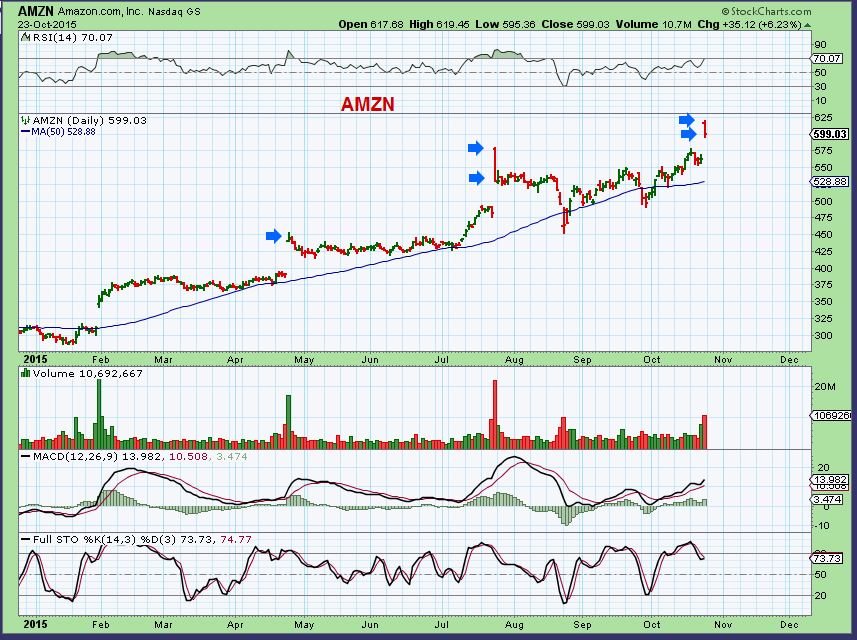
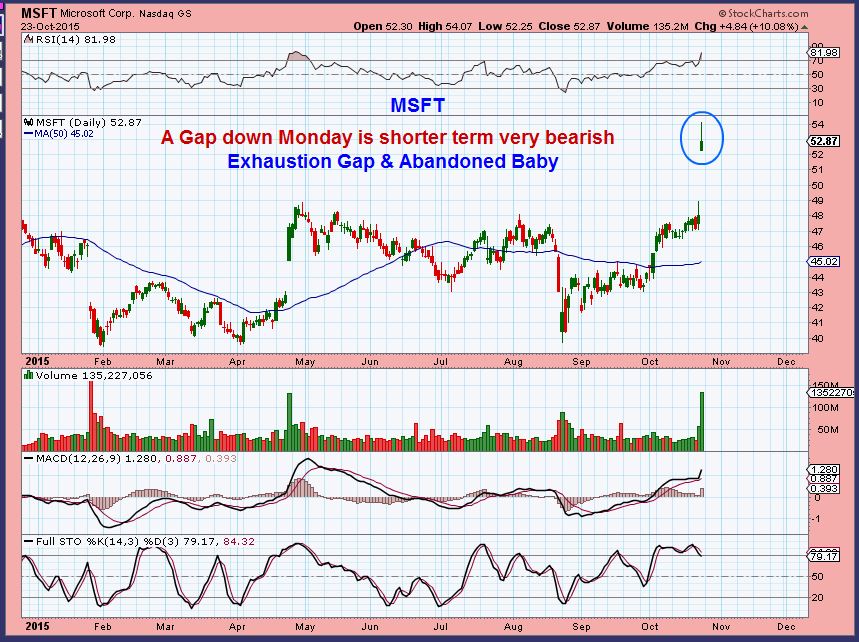
Looking at a couple of the Bullish break outs, they do look in danger of dropping back.
AMZN – It often Gaps open from Earnings and stalls or drops. It put in a reversal Friday similar to July.
MSFT – Thats a reversal candle too.
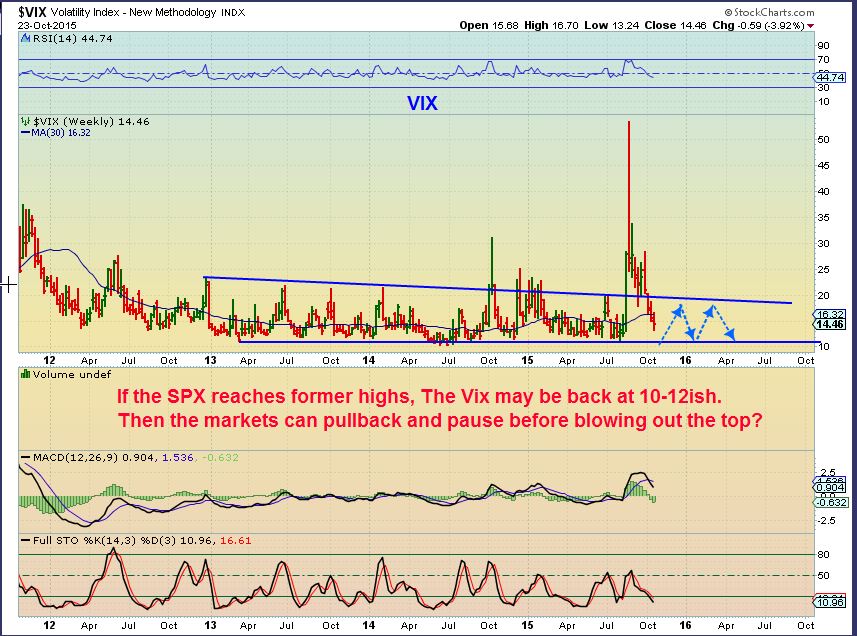
So if we bounce around here , the VIX may bottom as the markets top . If the Markets back test and drop, the Vix will likely put in another huge spike – see the Spike in Oct 2014, July 2015, and picture another huge one not drawn in.
Summary :
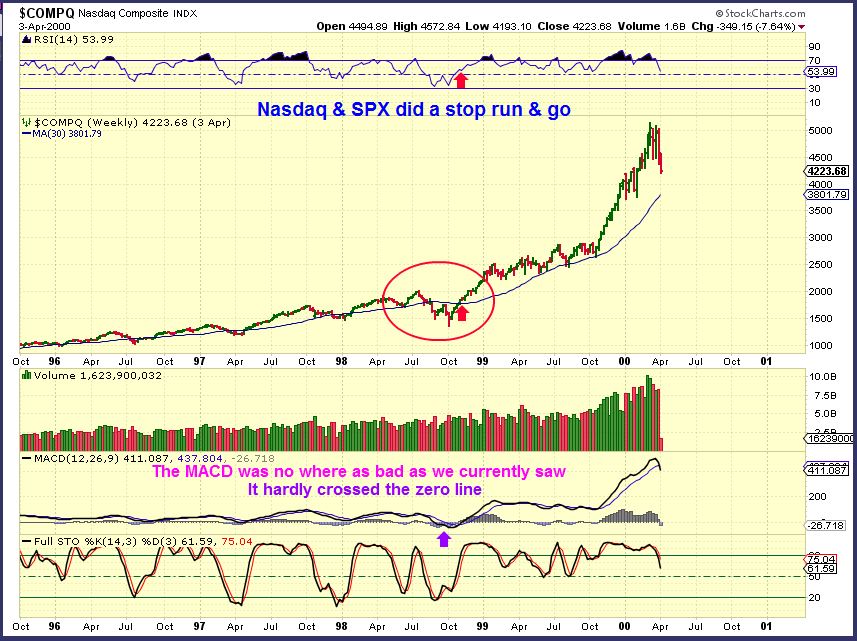
Right now, It was a bullish few weeks for the markets as they recovered from the recent slam down. We are somewhere in the middle of a full blown bullish recovery or a back test and drop again. Could we be entering a Final Blow Off top to the bull mkt that we have had for the past 7 yrs or so? With that in Mind, let me show you the NASDAQ blow off top of 2000. It did a similar shake out , crash right before the blast off. Red arrows are where we would be now. If we just keep moving straight up, this could play out in blow off fashion.
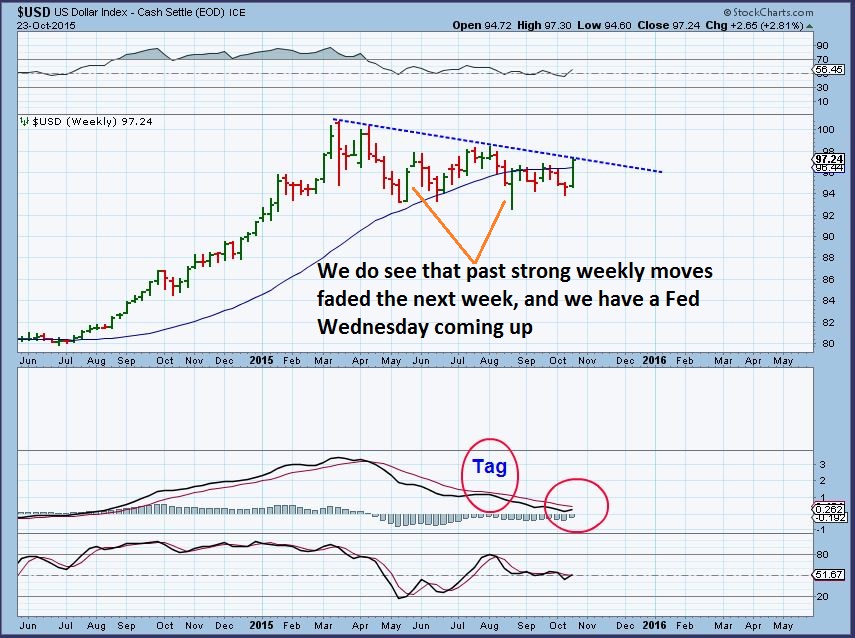
The USD WKLY – Strong move heading toward the Fed Mtg. Will the FED kill or will we get a break out here? Other strong weeks did turn down.
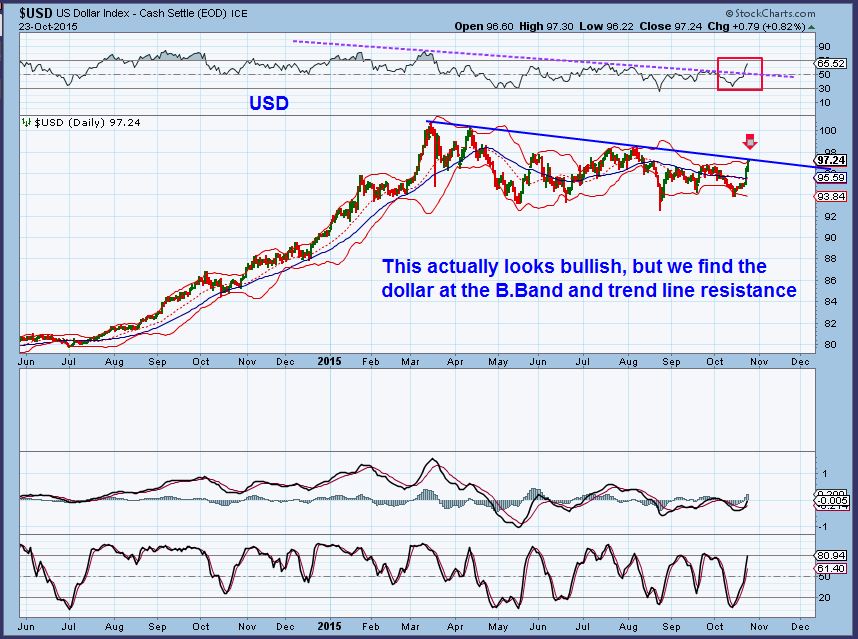
USD DAILY – The daily is up against the Bollinger Band & Resistance, but that doesnt have to stop it from moving higher.
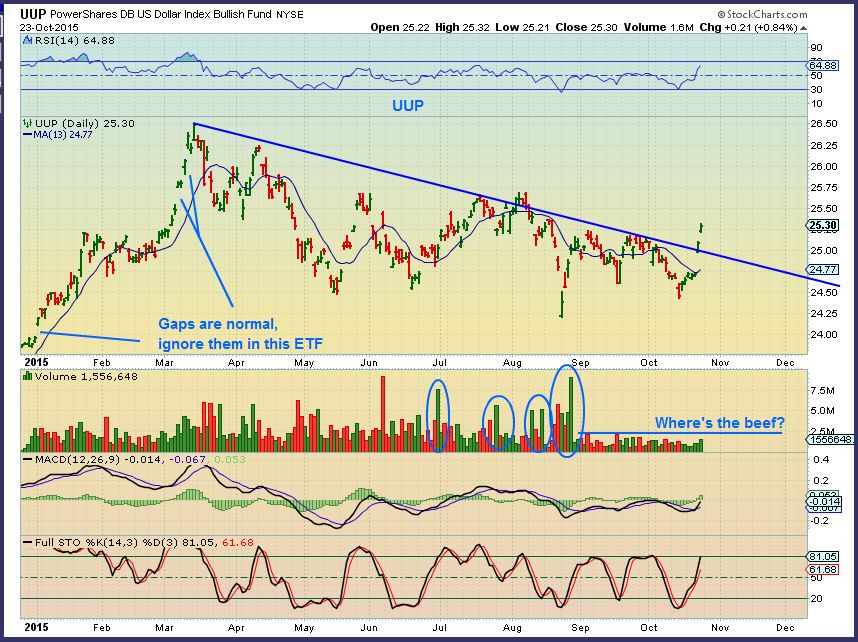
UUP – I thought that the USD ETF showed a strong move without strong volume, so I wanted to point that out. It may be a false sign of strength. The UUP tracks a bit off, so it shows a break out where the USD doesnt. Again, I’m wondering, “Is the Dollar going to roll over at the Fed Mtg Wednesday?”.
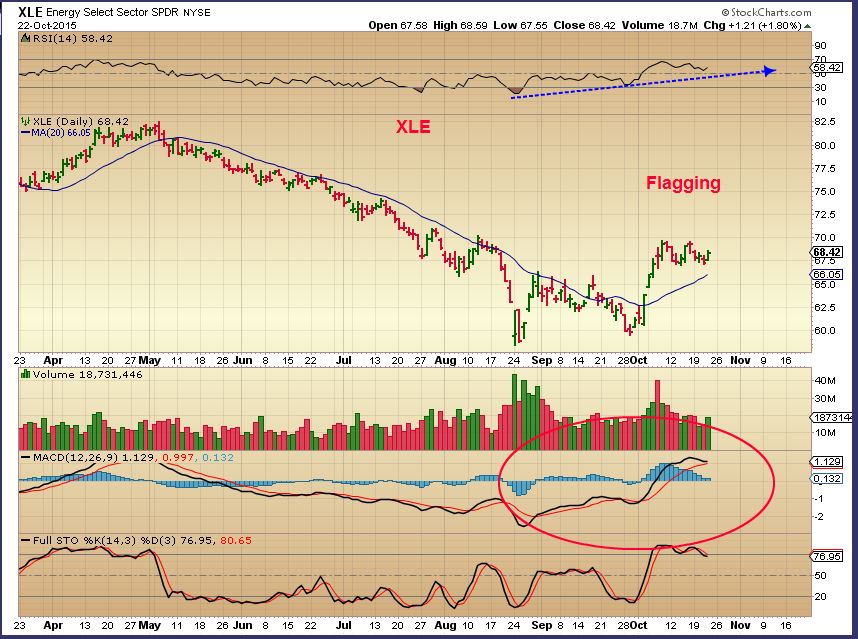
OIL has not found its daily cycle low. It is due, but I must say that the chart ‘looks’ weak, so I will start with the XLE first. The XLE (Energy Sector) Looks strong. A weekly bull flag is possible.
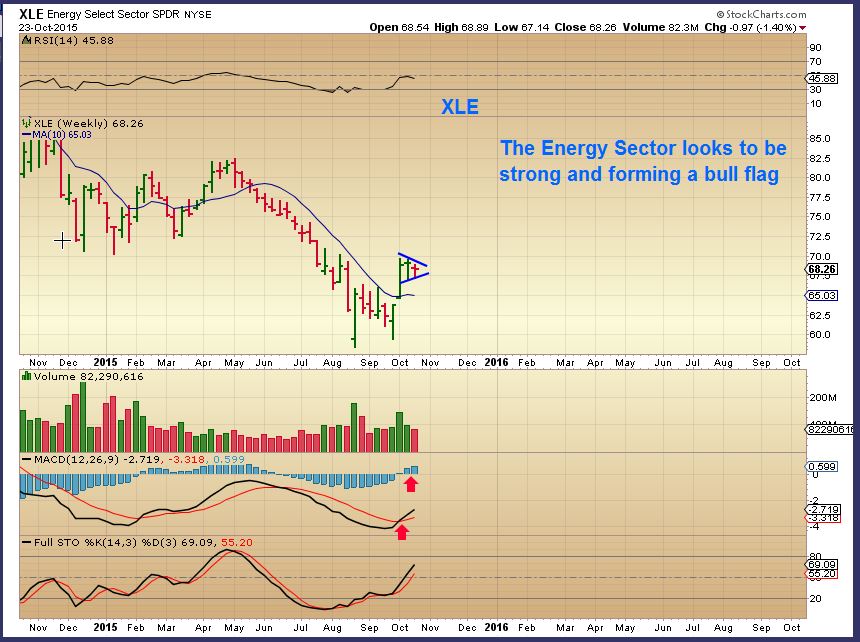
This was my Chart for Friday mornings report. It closed down a bit, but looks the same.
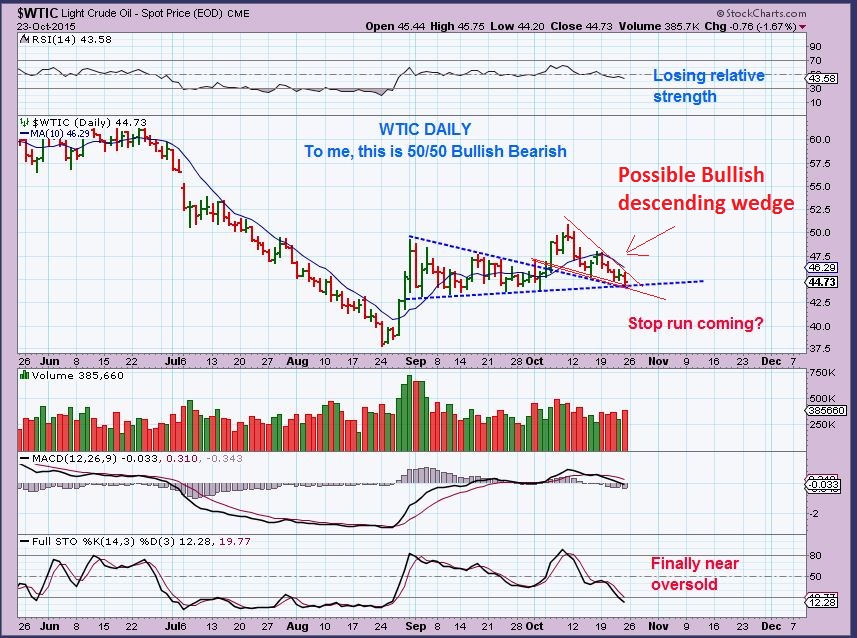
WTIC – DAY 43. That is getting late for a DCL. It “appears” weak and volume seemed a tad heavy on the selling days, but a low is due . I’m pointing out a bullish falling wedge in red. Maybe a stop run / false break down and reversal higher? Again, The XLE & many Energy stocks look pretty good, I expect OIL to break higher soon.
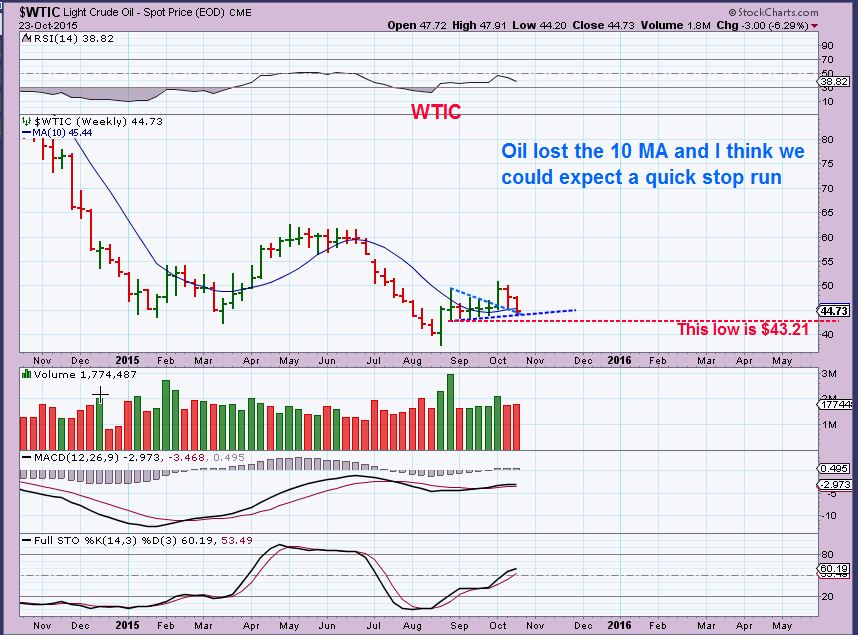
WTIC WKLY – Losing the 10MA on a wkly basis is not what you want to see. I’d like OIL to be higher this week to re-gain it .
GOLD SILVER & MINERS
Again, What can I say? The dollar took off higher and the Precious Metals completely ignored it. That makes Precious Metals look strong. I was asked last week if I was concerned about the C.O.T. readings and I said that they are not a good timing tool at tops, better at lows. This weeks C.O.T. are even higher, so I would expect ‘something’ to come of it. Gold will probably drop soon, but IF we re-entered a bull run I dont expect it to return to the COT Lows of prior ICL’s.
P.S. It is a Fed Week, so I am giving us 2 scenarios to watch for heading into the Fed Wednesday/ Thursday reaction.
.
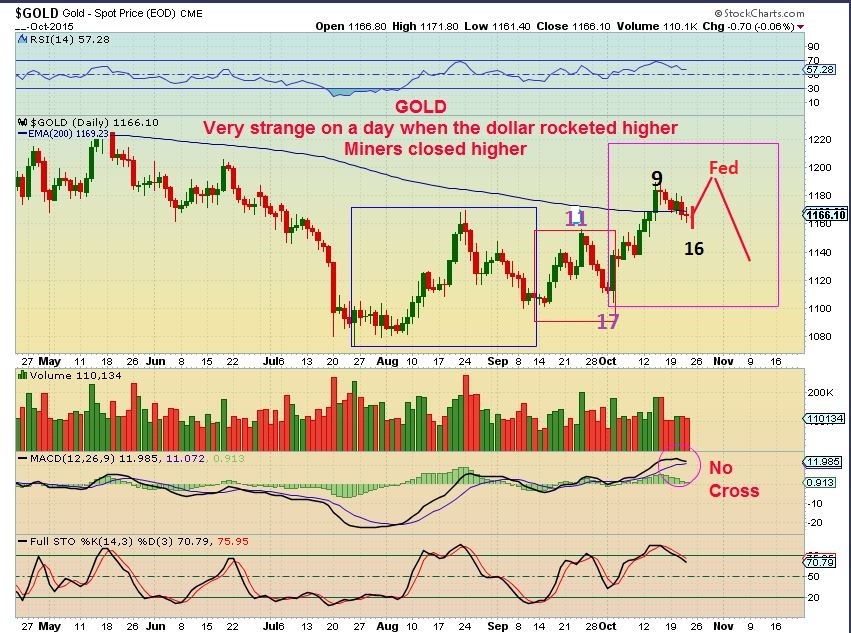
GOLD – Cycle count is difficult, as I’ve mentioned. I have heard 2 differing views, shown below.
1. I think that day purple day 17 on the chart below is a DCL. We have time for 1 more pop and then we’d drop as shown ( Fed Wed?) . OR with this Cycle count we would be on day 16 now . I see a bit of a cup. A sideways move could form a longer handle until a DCL forms and then we could get a run higher after consolidation.
2. That Big reversal day on OCT 2 looks like a dcl to me in Gold & SIlver, but For this chart I want to do the Cycle count as though it is not a DCL. This way would expect a dcl soon. Even on the FED WED MTG. Day 33 would be FED WEDNESDAY.
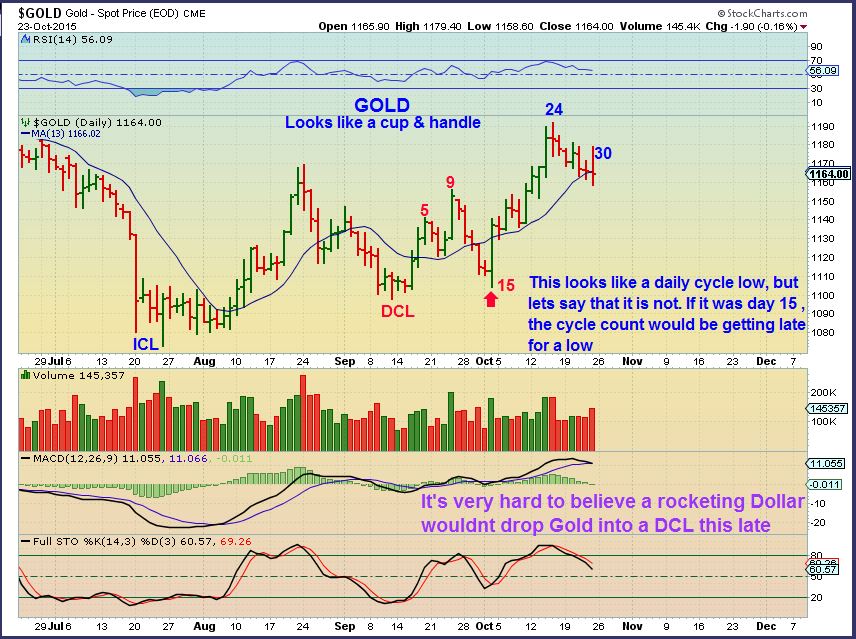
One reason why I was thinking that maybe OCT 2 was a DCL for Gold (with a shortened daily cycle), is the way that SILVER looked on OCT 2.
.
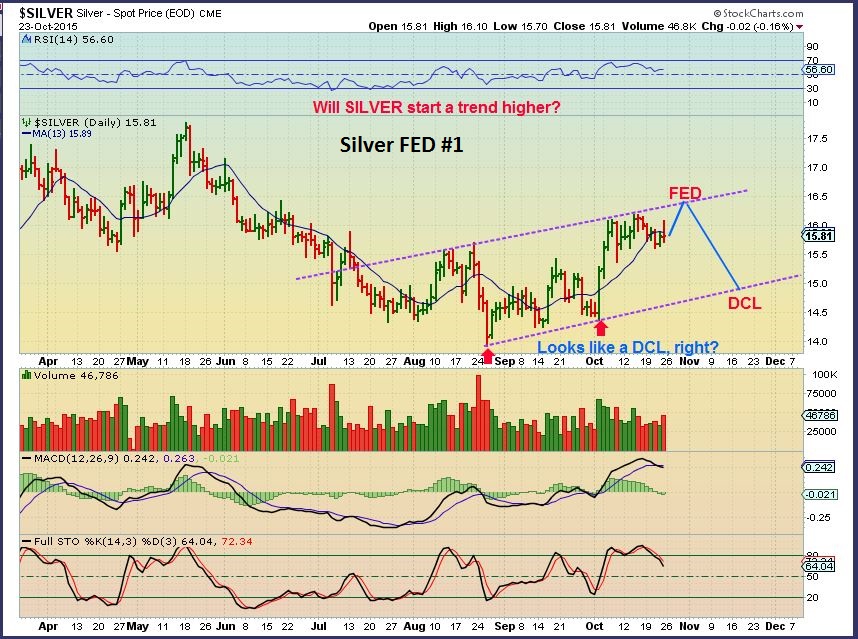
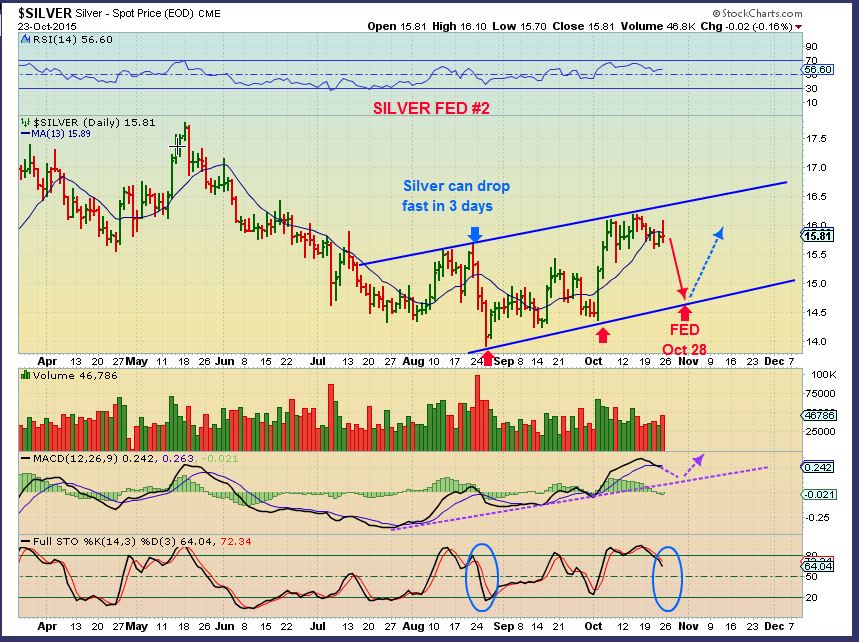
I call this SILVER FED idea #1 and SILVER FED idea #2
.
SILVER FED idea #1 – OCT 2 looks like a DCL. This puts us ready to fall into a dcl later this week. The chart shows what I feel we could see if we rise into the Fed Wednesday. Keep in mind that this early in a daily cycle ( day 16), we could fly through the Fed Mtg and run up higher to day 25. WHY? The First dily cycle for Silver out of its lows was not really long, so the next one could be. If it runs for 33 days and we are on day 16, it is only 1/2 over 🙂
SILVER FED idea #2 – A drop now Mon,Tuesday, Wednesday , and a blast off after fed Wednesday. a 3 day steep drop has happened in the past.
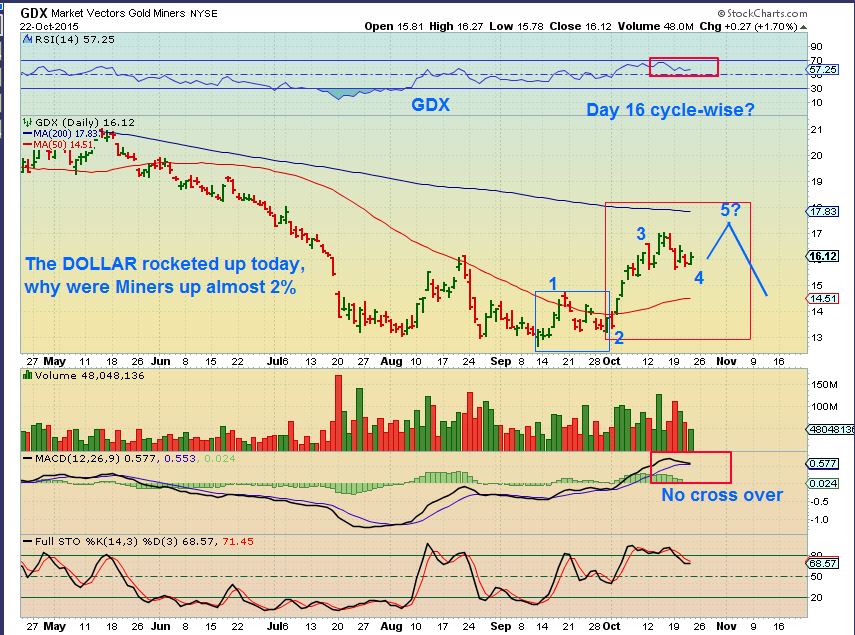
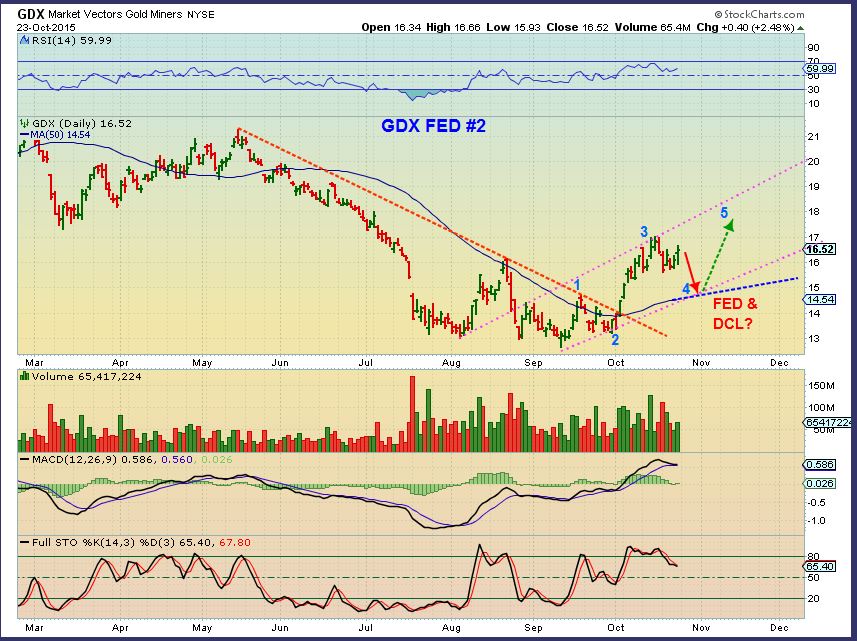
GDX – First a quick review of my thinking as of Thursdays report. Then I am giving us 2 scenarios to watch for heading into the Fed Wednesday/ Thursday reaction too.
1st chart – GDX – My Thursday chart. A bump higher and a drop, 1-2-3-4-5 style.
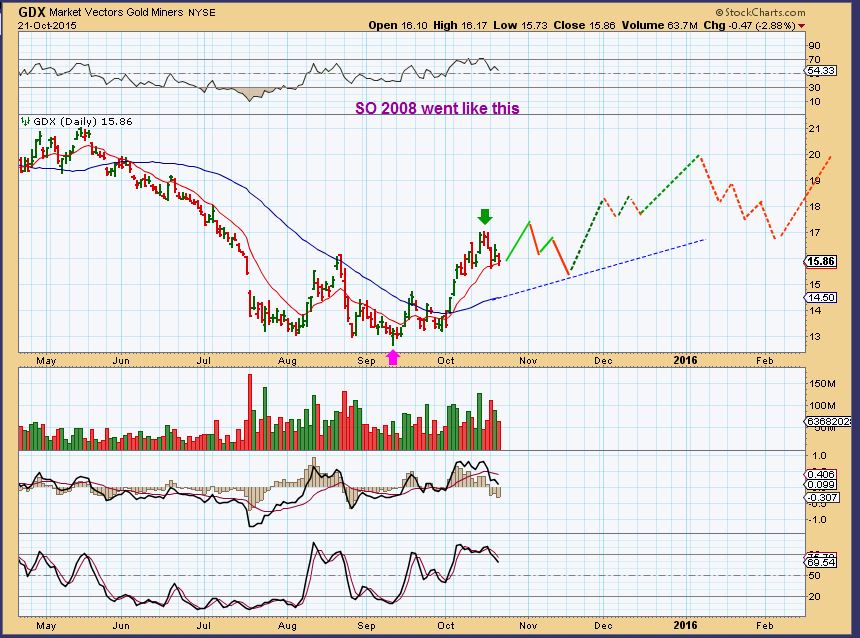
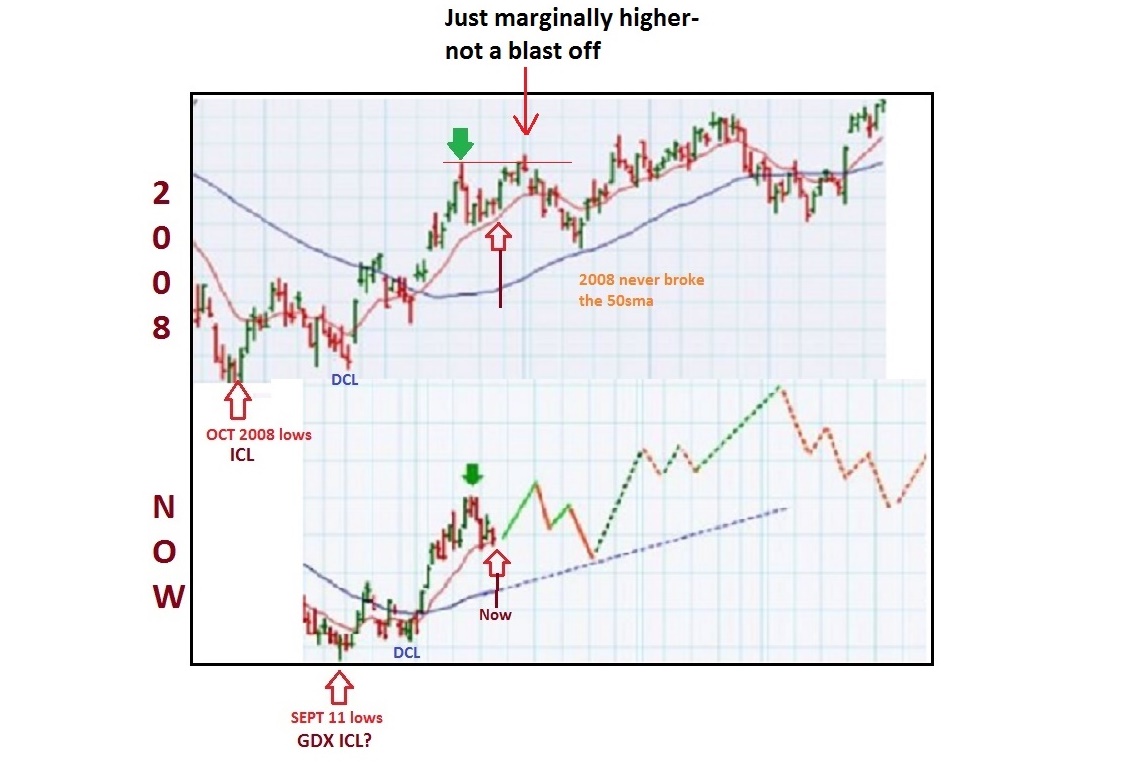
2nd chart – How similarly GDX acted in 2008 coming out of a Bear Sell Off.
.
GDX 2008 and Now. GDX made a marginally new high to suck in “Bulls” and then dropped into a dcl to the 50sma. Could we see that this week?
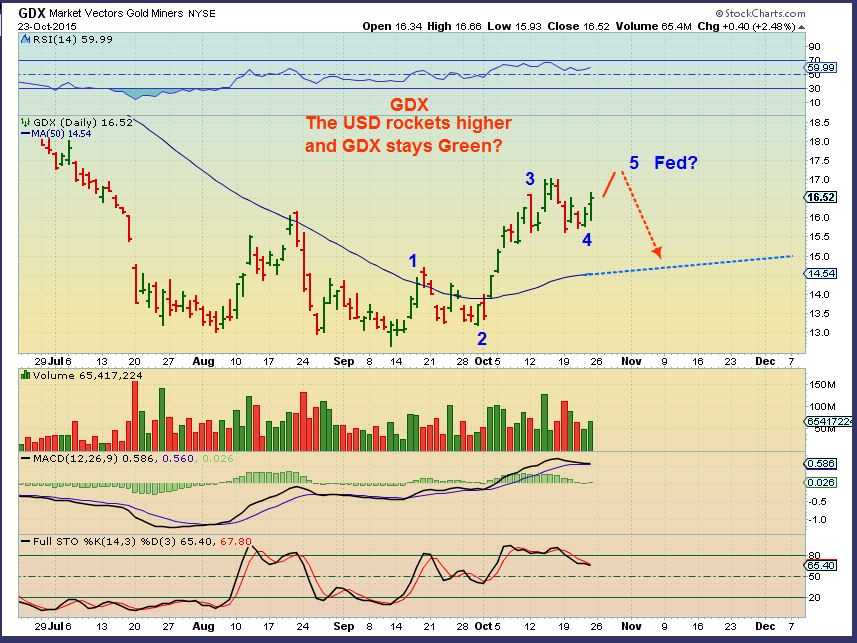
GDX FED IDEA #1 – Rise into the Fed Mtg and drop to the 50sma , 1-2-3-4-5 ? Increasing volume from Thursday to Friday.
GDX FED IDEA #2 – Drop going into the Fed Mtg, and take off higher Thursday.
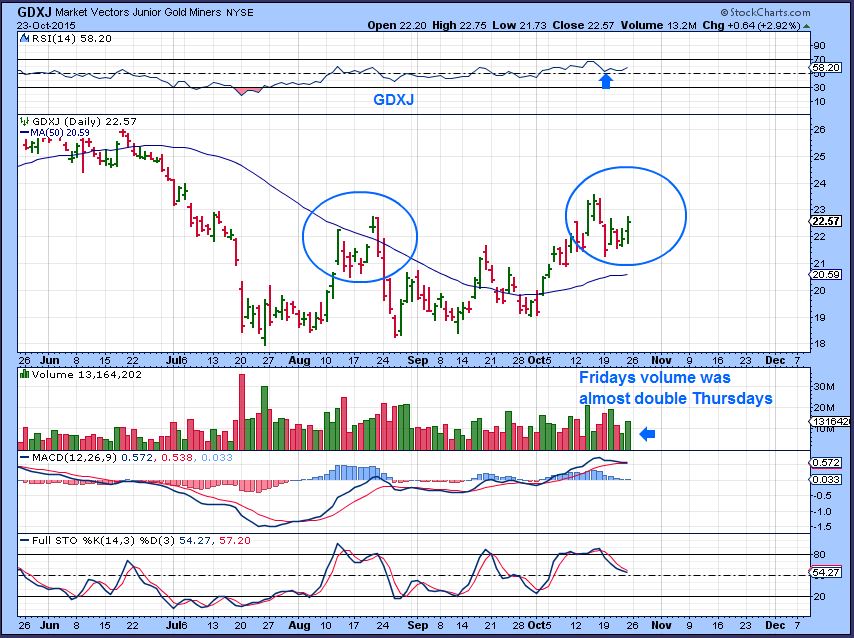
GDXJ – Pop & Drop like we saw in August?
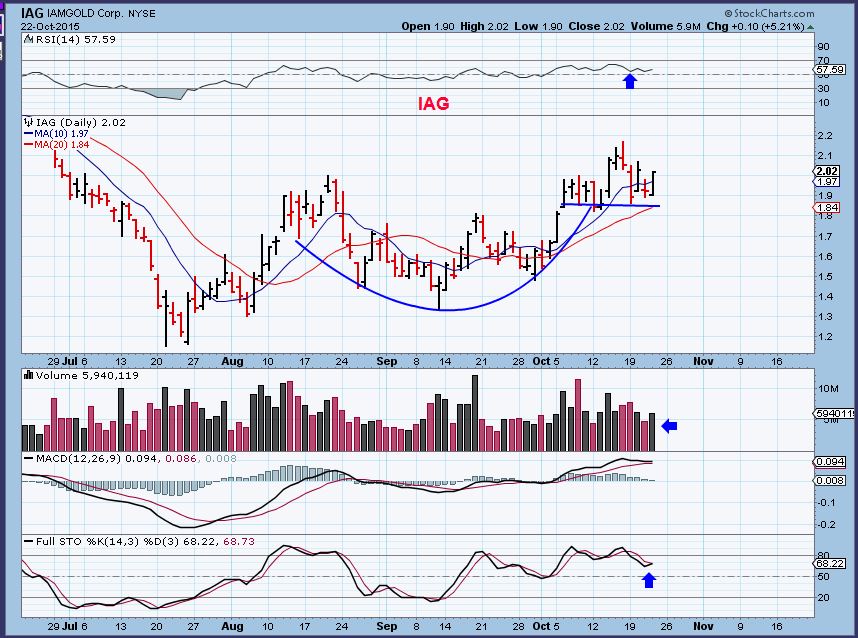
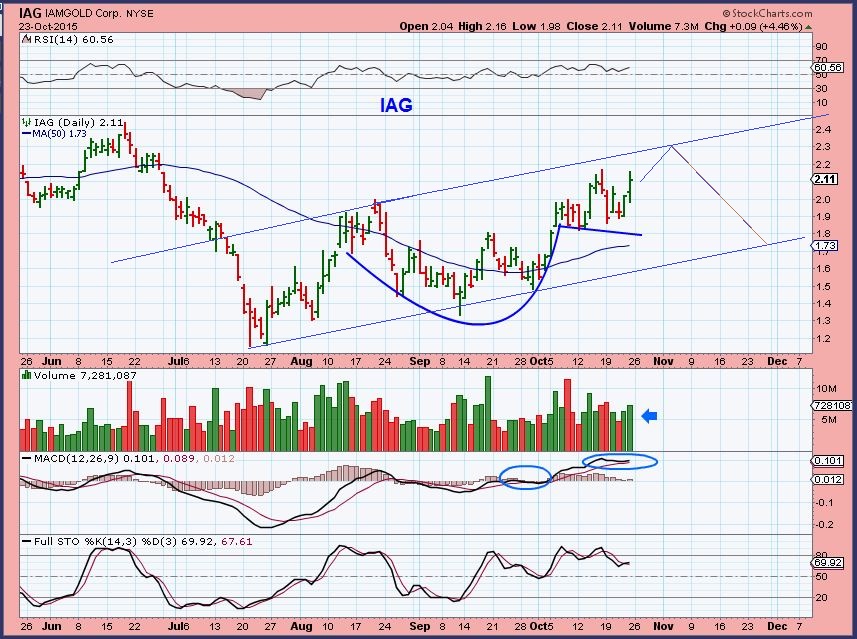
I posted Bullish looking charts of AUY, IAG, SA and EGO Friday a.m. to show why I think Miners look like they want to go higher. They all improved. This was IAG Thursday for example, and Friday .
 I just found out that I am going to be on a plane during the Fed Meeting Wednesday!


:o) .. w .. o .. w and gulp.. great report CF
… interesting you are showing GDX 2008 comparisons… some of the EW guys are projecting possible market decline to look like 2008 …
Thx Maria,
I have been following ( And actually posting charts here) of those correlations in the market too.
If you scroll back up to the SPX charts in this report for example , I have also been watching for a market decline similar to 2008. It is in the chart with 2 rising wedges and a tag (back test) before a bigger drop.
2008 post-crash, i hope.. as far as GDX/J are concerned!?
Me too…Like Oct 2008 onward : )
Teehee
I CANNOT not not WAIT to pullup miners now&then on a split chart like yours &compare the waves. On yours, I can EASILY count the 5 wave move in 2008.. its textbook perfect.
U prob know this offhand..but i woild luv 2 see oil, gold,miners,dxy as well. If marktes collapse hard do/would speculaters flock to gold, oil, and possibly dxy as well?
There are differences and small signs that the bear mkt in Gold & Miners is ending/ bottoming, but we do need a little more proof for longer term. I think that it’s best to keep trading and stay alet to that more change if it comes. .
RIC, NG, LSG, SSRI, MVG and a few others on 3 yr charts already bottomed. Nobody seems to notice. SA may have just done a final shake out bottom. I like what I see 🙂
Could be a big cup and handle on RIC……….
Thats what I do think….sort of a long rounding base, but RIC went sideways and it does look like a handle. LSG is similar, on a monthly it could be playing out as an inverted H&S .
Either way, So far – they look to have put in their final lows quite a while ago
For some reason Tradingview won’t let me find NG, LSG, SSRI, or MVG? It would be nice to finally get a buy and hold opportunity.
Really? Very odd. I was able to see them there.
stockcharts.com to see them.
I can see them now. SSRI looks good, maybe a little overbought but trending higher.
GREAT REPORT AS USUAL Ray
THANKS RAY 🙂
Alex, any thoughts on nat gas other than ‘stay away’? Sorry, didn’t have time to copy my chart in but closed well, well outside lower BB on both daily and weekly charts. Down another 10 cents on no news this morning. Definitely a bit overdone, near ridoculous, at this point. Newspaper this weekend had a front page article to expect cold and snowy winter in Mid-Atlantic. So, clearly different opinions about El Nino abound.
Glad I’ve stopped playing that for now. UGAZ would be at 80 cents now if it didn’t do the 1-5 reverse split.
HOLY crap! Yet ST trolls are calling for next reverse split after this drubbing!
At this point I think NATGAS is capitulating.
look at DGAZ and then UGAZ. They look slightly parabolic in both directions, so NATGAS may be finding a bottom – I am not taking that risky trade, but it looks to be getting a tad overdone as you said.
Would you please keep an eye on Nat. gas ALEX?
Of course -I think- you let us know, when you think it’s a ‘bottom’.
Thank-you very much for all you have done for us.
Just so you know…I have a very very busy week ahead of me starting Wednesday morning .
If it bottoms then I will not see it. If it bottoms Thursday, I will not see it. Friday is questionable. I will be writing reports strictly by doing my homework and seeing what happened during the day while I was away from the markets. Timing is unfortunate, but out of my control. NATGAS has been very tricky. I may not catch the lows.
You keep your eye on it too. ; )
Sorry Alex, hope I ask not to much…. I will definitely keep an eye on.
Or….. who ever from the subs sees it, hope they will report it in this session. Wish you strength and wisdom Alex, this week.
No – It isnt too much to ask me to watch Natgas, it’s just that I wont be watching anything real time at the end of the week, so I just wanted you to knpw that you wont hear from me mid day wednesday if it bottomed then.
Thats a good idea, maybe some of the readers here will see something and call it .
I just wont be in front of the screen later this week, so I wont see it bottom if it happens around the Fed day.
Looking at the charts of DGAZ, UGAZ, UNG , etc…It could bottom today or tomorrow, but I cant say for sure.
Today is a ridoculous move, maybe capitulation. Nothing in the fundamentals has happened btw Fri and today. However ETFs are rolling front Month from Nov to Dec. Please don’t buy a long gas ETF, even UNG until that is complete and a reversal spotted. If I see something (which is unlikely!) I’ll post it.
I really appreciated Cason your input, so as always.
BTW…. I has some UGAZ @ 4.00
I’ll throw my chart in tonight if have time, an traveling this week. And again on Wednesday. Good news is my flight is in the evening AFTER the Fed.
If possible Cason, I look forwards to see it.
M A N Y T H A N K ! ! !
UGAZ is way oversold, and in new lower territory. Massive selling, MACD crossed over and headed lower. I’d stay away until something changes. Wow, haven’t looked at this in a while.
Alex, thanks for the report. I guess its good to see two scenarios. One of them should be right? I’m invested currently short miners. I would really like your guess as to which scenario happens.
Bill I did the same but only as short term trade, took some profits on DUST
Best guess would be sideways until the Fed Mtg. I think the next directional move may not come until after the Fed.
If we continue this action this week May take a bunny long ahead of the announcement…!
When you take a “bunny Long” as stated above, do you also sort a kitten? : )
Only if my bunny loses support!
Gold marginally higher, Miners down? Possibly playing catch up from last week? This is going to be a crazy week.
Majors are down quite a bit but juniors not so much. Maybe a downgrade from somewhere?
NEM downgraded
Not a bad reaction-
I remember when a downgrade would drop them 10% on the first day, 8% on the next on HUGE volume. 🙂
And volume on them is light.
Seriously? Its like, why downgrade now? I mean, duh. Gold has been in a vicous bear for over 4 years, I don’t get these analysts. Or the kneejerl reactions their dribble creates.
They often do it so they can get it to sell off and then buy it lower.
Which cements my theory that they are all huge DBs
Volume is very low on the miners on the decline today. Even NEM volume is pretty light.
Check out the inverse H&S on BBRY and use a 50sma- That looks pretty tempting.
And YELP – That looks like a break out from a flat base, but earnings come out Wednesday.
I have some cash in my 401k account. Trying to decide when a good point to enter the Stock Market will be. Anyone want to take a guess?
In general, as I have said, I think we set new highs, maybe by a small amount, maybe a blowoff. I would then expect a bit of a contraction afterwards. Small bear, big bear I don’t know yet, I have seen theories on both. I would think you could long here with trailing stops, leg in, then look to get out at highs (by trailing). I may do the same. Looking at high cash position for some time, if we get a huge selloff, 2008 style, I’d go all in once bottom is identified.
AAU – strong volume today , but I didnt see any news on it.
GDX, GDXJ head and shoulder pattern points to lower prices?
That would fit in nicely with idea #2 above
I’m signing off – Have a Good Night everyone
Oil is getting to the ‘it won’t ever go up again stage’ here mentally. I was prepared for a Wave 2 type pullback but not just a constant bleeding regardless of market conditions. Anyone see anything positive other than: nearing extreme oversold, and due cycle low? XLE pretty much crushed today.
Wow, just saw BAS, big pop at close. Everything I was following was down, however. Just wasn’t sure if someone out there had a fresh perspective.
The pattern playing out in oil is very similar to September 2013 to January 2014. Getting to the point of a turn now. Look for a 61.8% retracement and then the move higher. 61.8% would be around $42.76 in USOIL.
https://www.tradingview.com/chart/USOIL/xcXQO3j3/
Sept 2013 to Jan 2014 broke to new lows
The overlaid gold candles are from that time frame. They have been right on for a while now, at some point they will change, but until then Im staying with them.
So shouldn’t you over lay the starting points to be accurate? Your lows for 2012 are way above the lows we saw in August. IF you lower the 2012 lows to 2015 lows, you’d see that 2012 broke its lows. It did not do a 61% retrace.,
I was just trying to help – I look at 2012 sell off and see lower lows at the end of it.
Well, its not exactly the same pattern. I am looking for turning points (days) to line up and that’s where I eye it up. The old pattern looked like a gartley so I was looking for 61.8% retrace from the high. I got it perfectly. If it holds.
i love stuff collapsing and getting ultra-oversold… … so long as i’m not holding 🙂
sooo much easier to get onboard at extremes, provided we don’t get that choppy up/down crap like the miners in september
idk. I’ve had a rough time with some of these bottoms as Alex has highlighted – ‘little wiggles’ that are 8-10%! I thought oil was good to go when we hit $50 earlier this month. Nope!
Geurt, All, said I would try to post some nat gas. Natgas weekly looks like finishing Wave5 down at some point? Lower BB Crash, stoch bearish embed, MACD has crossed down. I would grab yet, this could have more to come. No hints from volume on NATGAS yet – hard to say b/c Nov to Dec rolls MUST be complete by Wed, which is Nov futures expiration. Jan futures also in play (significant contango which will affect UNG negatively).
UNG daily – RSI (5) deeply oversold, lower BB crash, MACD cross down, stoch embed. This is an ETF but 2x avg daily volume today. This is a capitulation move, but these can keep negative energy for 3 total days so bears watching. GL all.