Some of the ‘set ups’ mentioned last week are running now, other stocks that ran recently have pulled back and may be currently setting up to make another run higher. Lets discuss this after our market review. Something interesting may be happening there too.
From yesterdays report, we saw this in a few sectors
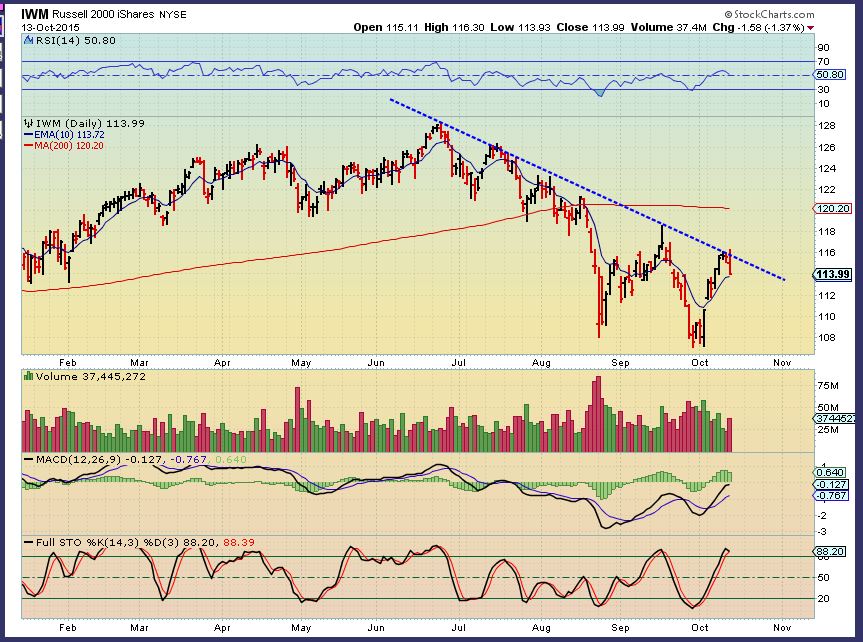
Now we are getting a little follow through to the downside
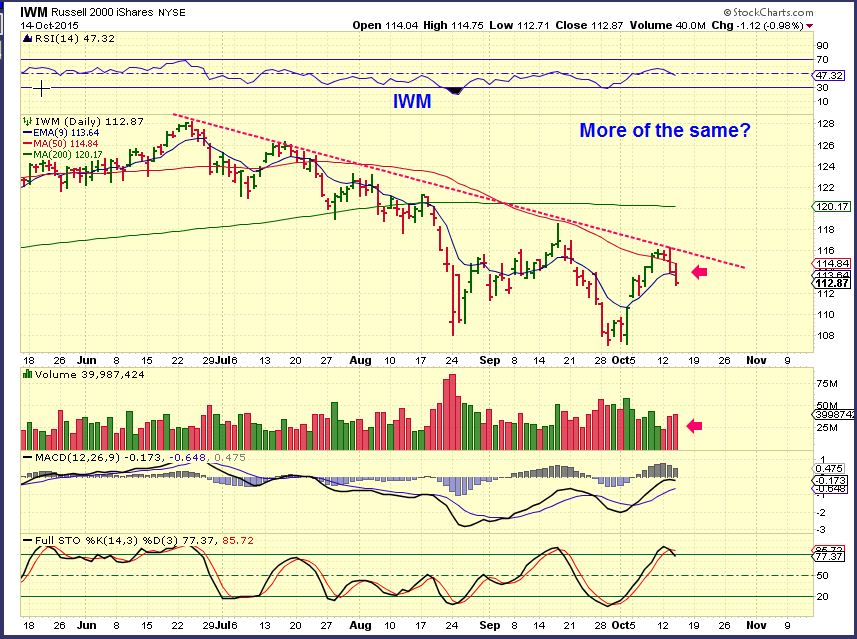
This caught my eye however…
They say that semiconductor sector often leads the markets. The Sox (Semi sector) does look to be recovering.
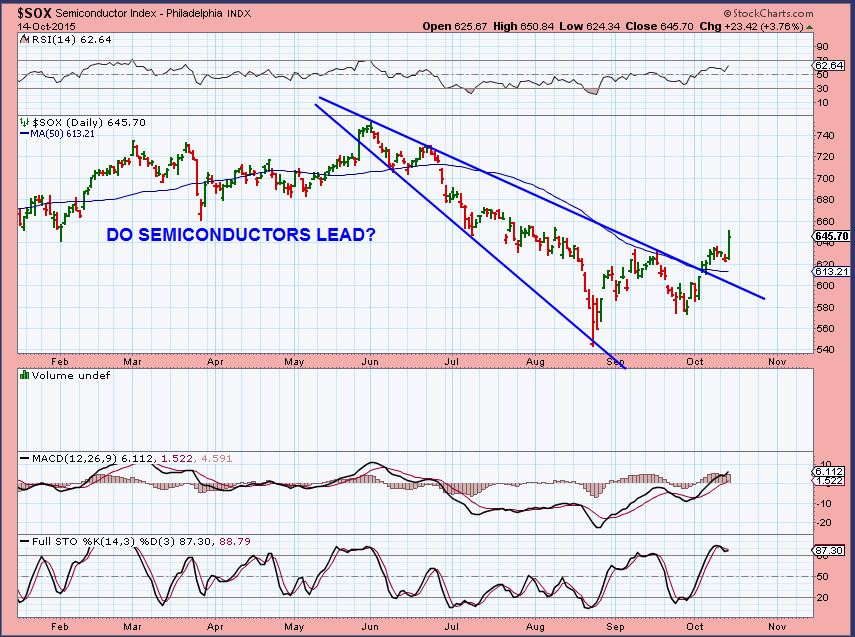
Lets peak at semiconductor stocks
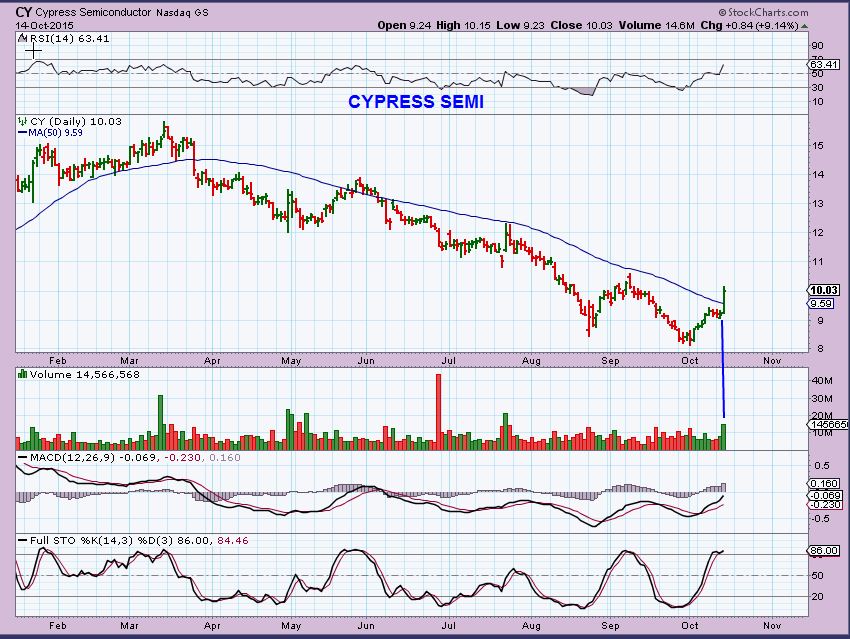
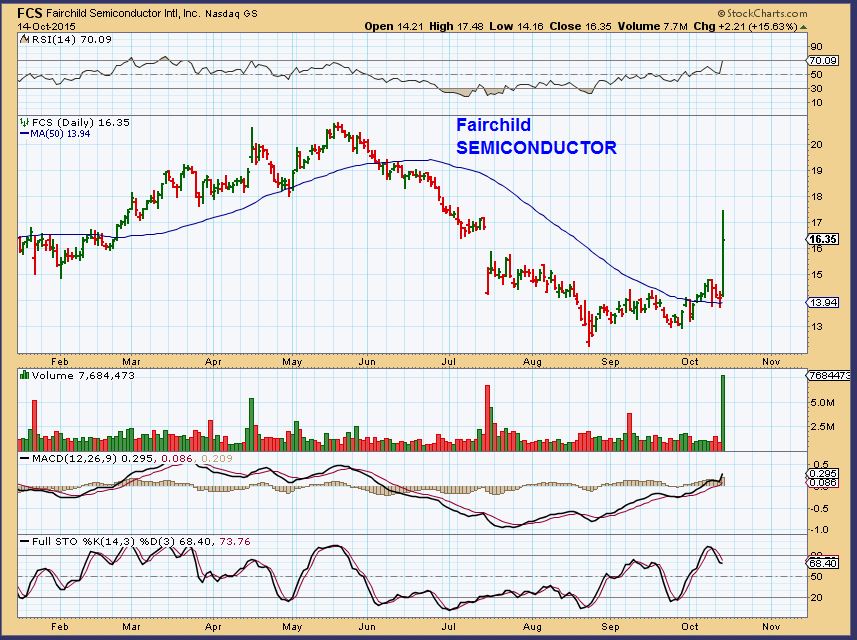
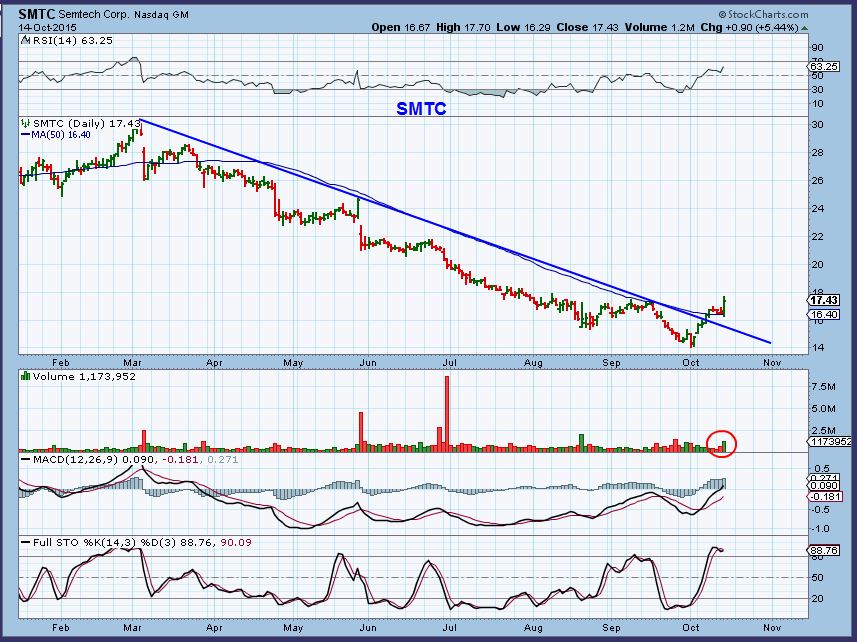
SO if these semiconductor stocks ( And others) are perking up, we should be alert to the idea that the Tech sector may start recovering from its sell off. These stocks actually look like they are breaking from the downtrend and receiving some love. They may become “buy the pullback” candidates for those that like trading the tech sector.
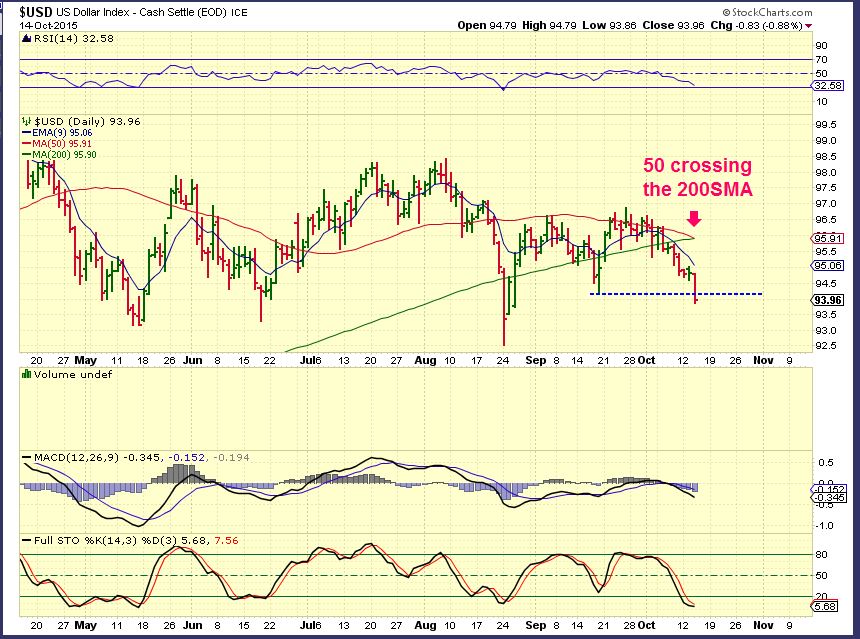
The USD broke down further as expected. As mentioned yesterday, we are now seeing short term lower highs and lower lows. Now the 50sma is (Death cross) dipping below the 200sma. We often get a “Test” Bounce from this condition soon and then further downside should occur later.
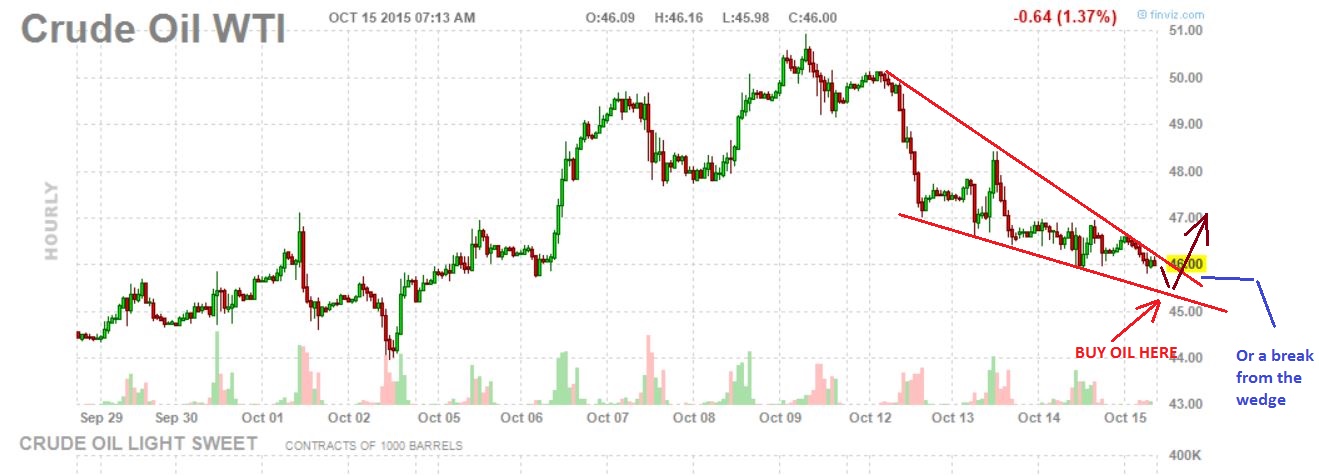
$WTIC – For the past several days I have expected this tag of the 200sma and then a drop. Almost there, maybe the $45 area? Keep your eyes on Oil / Energy stocks during this pullback. If Oil runs higher again, they should make their next run higher too.
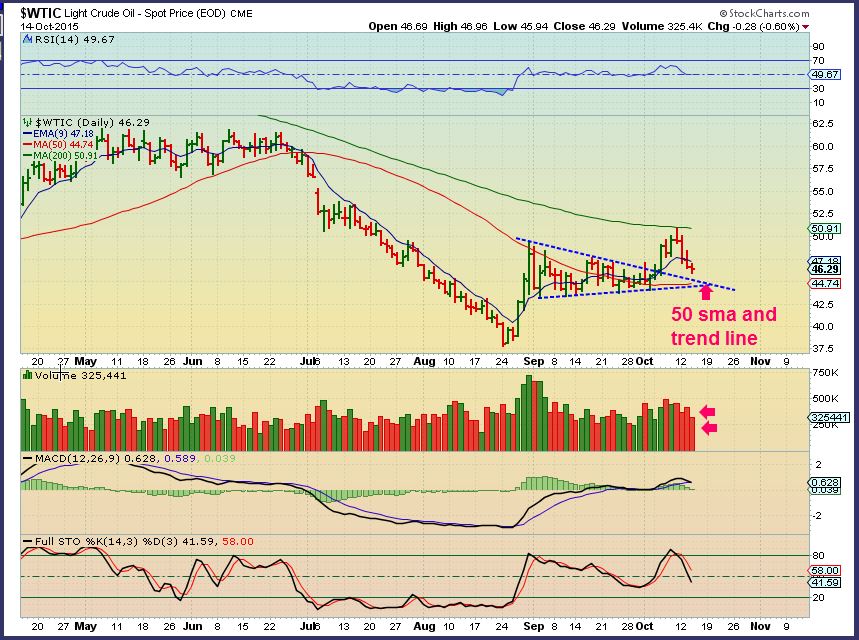
The above chart shows Oil dipping to the $44.75 area, but this is OIL pre-market . $45.50 looks like the low if we drop further, unless it just rides down to the apex. Remember the wedges 🙂
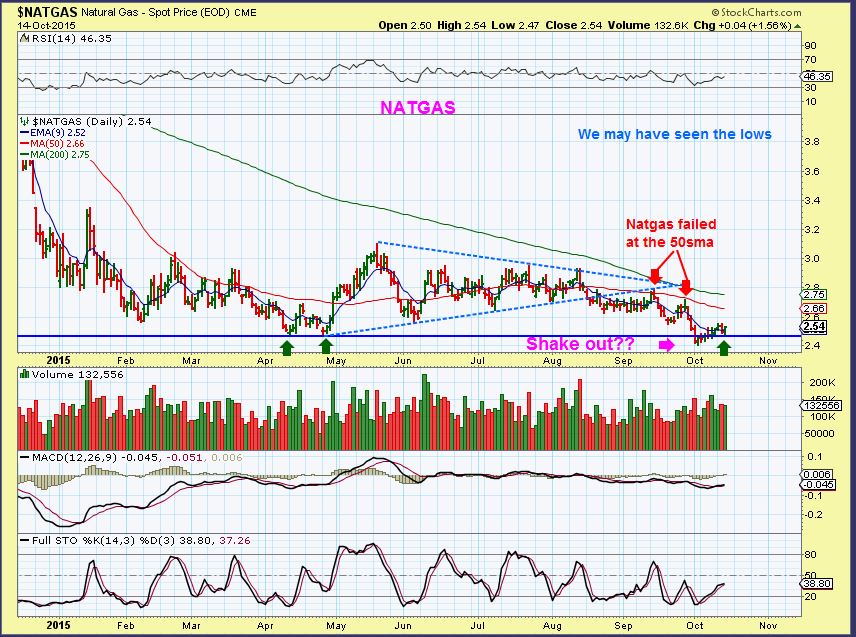
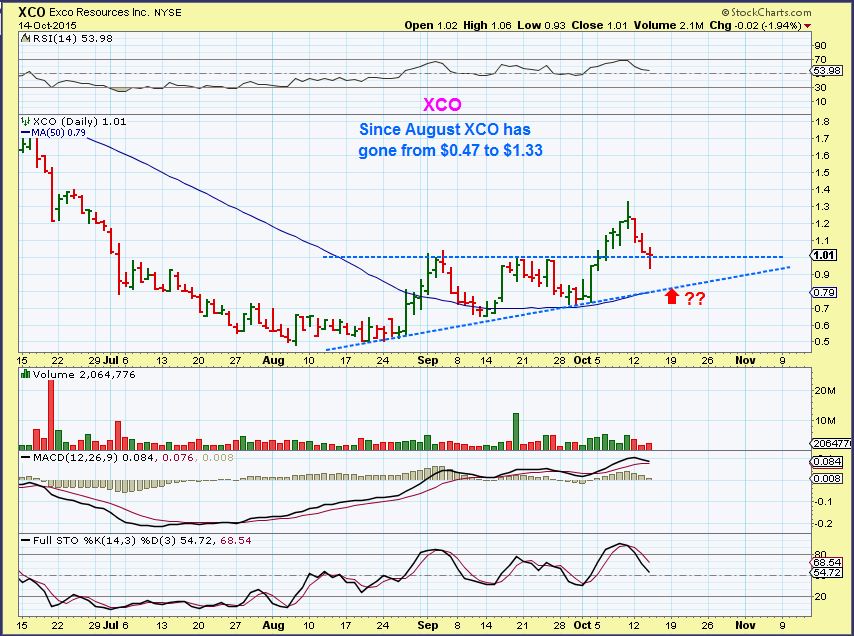
Is NATGAS bottoming? That looks like a possible shakeout. If you can handle bottom fishing, this is a low risk area, your stop is below support. ( Some buy UNG, UGAZ, etc). XCO is a NATGAS stock …
XCO – Possible support here, or that doji may be a 1/2 way point. Watch for a drop to the blue trend line / 50sma.
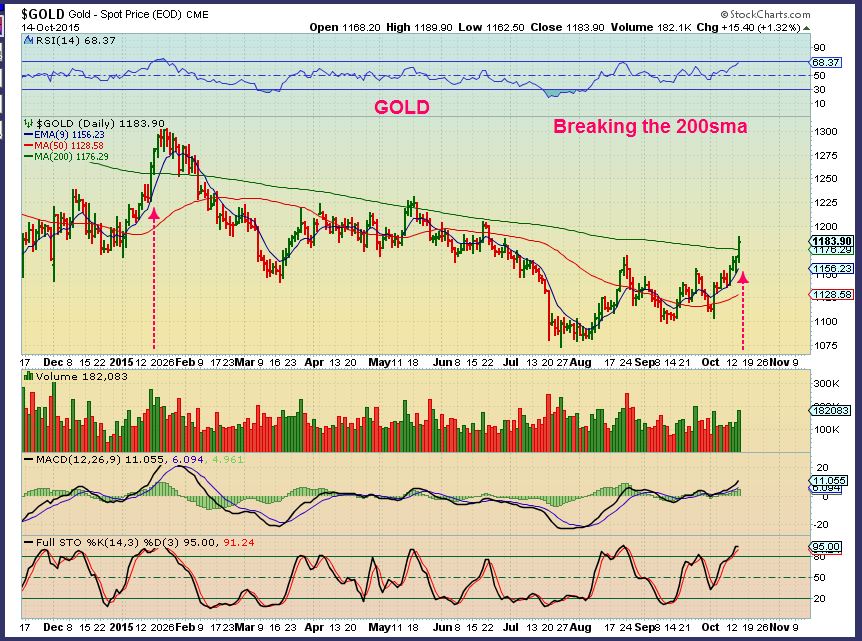
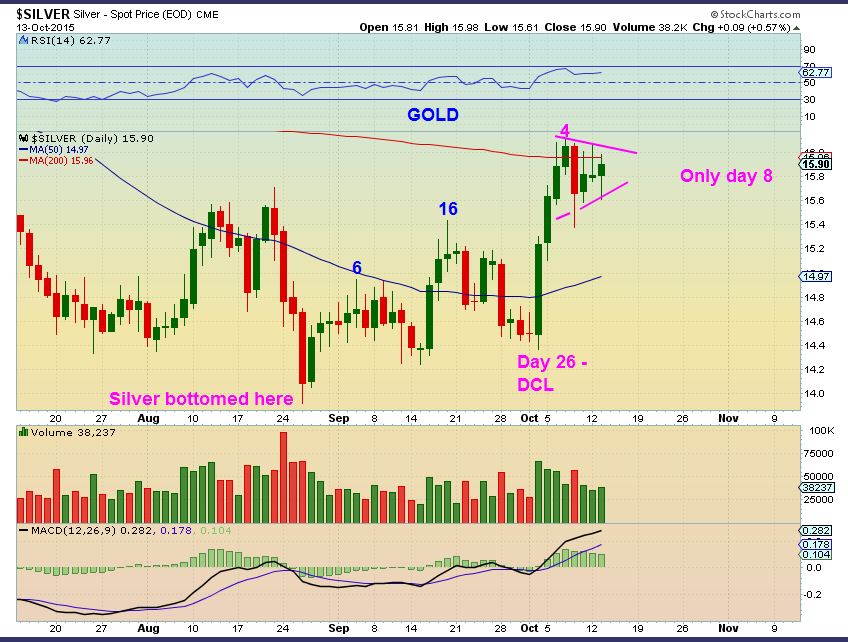
GOLD – Gold broke above the 200sma today.
SILVER – Yesterday I pointed out that Silver was coiling under the 200sma with a bull flag, and it was only day 8. ( I wrote GOLD on the chart – this is obviously SILVER)
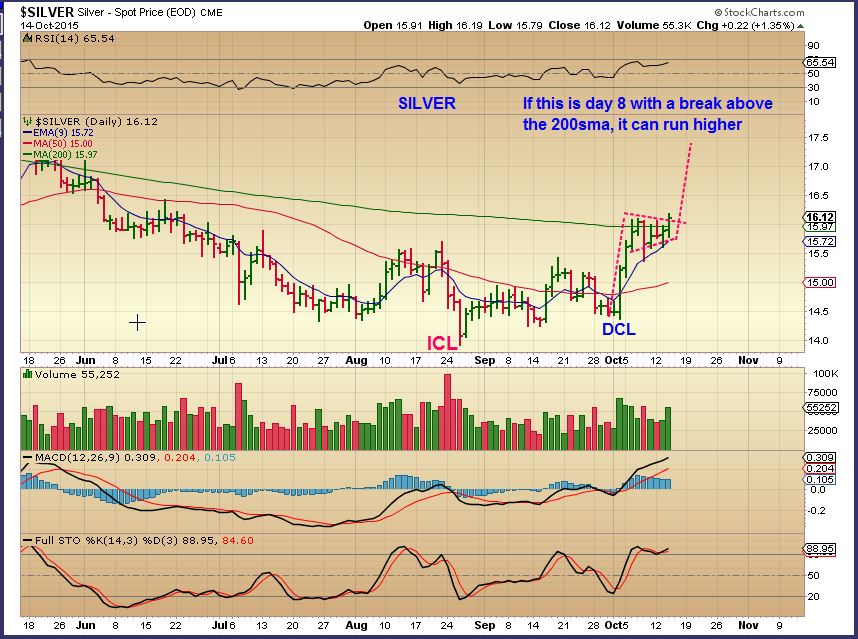
Wednesday Silver is breaking out and the Silver stocks did very nicely. If this was day 8, then I would expect Silver to be able to get up to $17.50 if it can remain above the 200sma, but it may not be a straight up move.
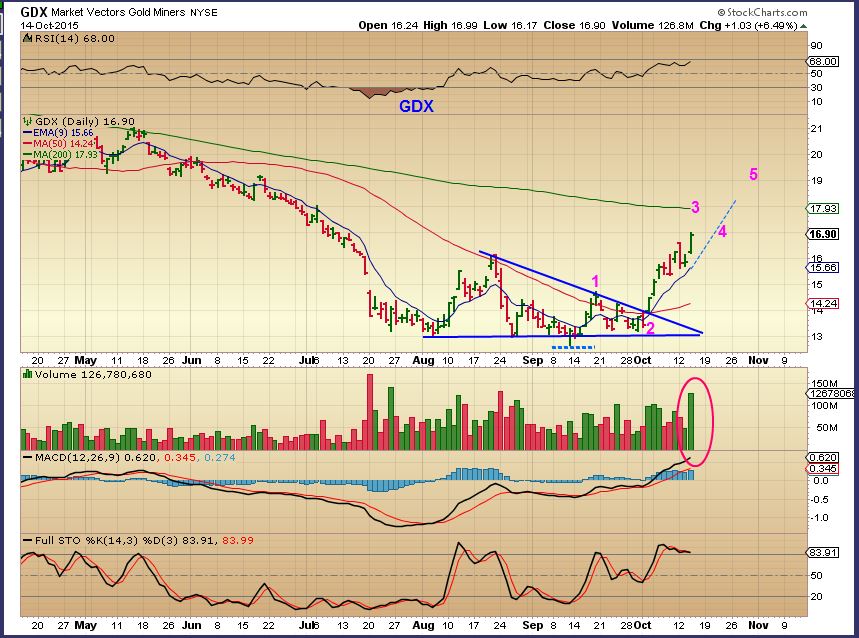
GDX – Very nice 6.5% pop today. Will we get a pullback at the 200sma? Possibly. It may just be a sideways bull flag like Silver just did, but to get a 1-2-3-4-5 move, we could expect a pause at the 200sma.
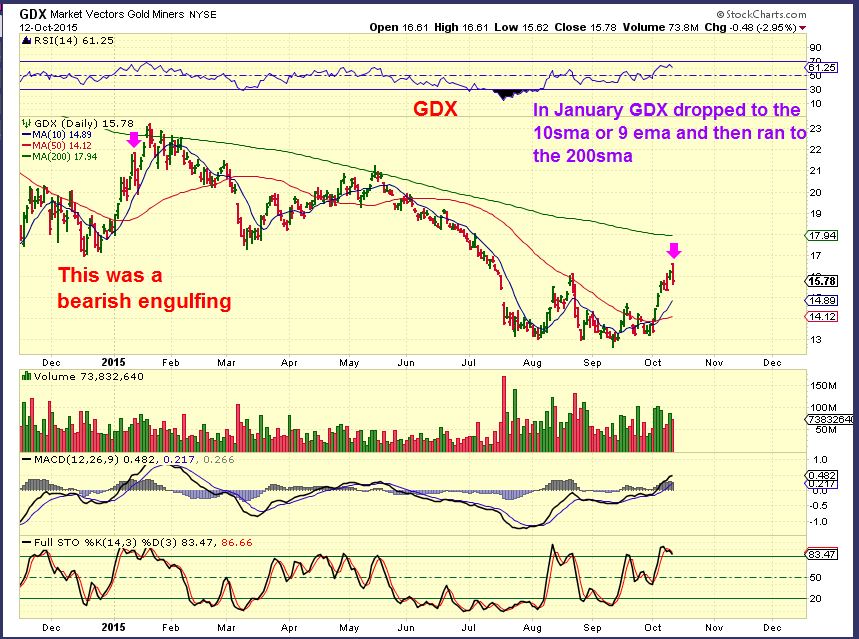
Review: We had a bearish engulfing candle 2 days ago, so most traders would be cautious at that point. I admit that I was, and I sold the NUGT that I bought when they did their reverse split. I held on to my regular Miners in the event of upside. I used this chart to point out that we also had a bearish engulfing in Januarys run higher, so I thought that we still might continued higher after a tag of the 10sma (Magenta arrows)…
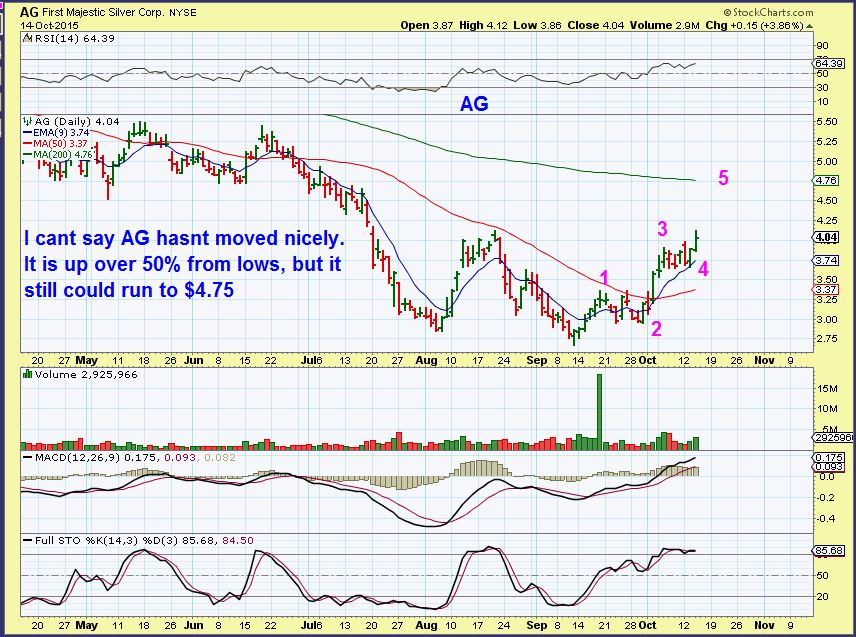
I have had a few traders ask me , “What if I want to buy now? Am I too late?” My answer to that is that the low risk entries are rare at this point in a run. We see stochastics are oversold, RSI are high, and so on, so even though this can run higher, entry is tricky/ risky now. It should be stated that under these conditions, we can see an embedded run higher where those indicators just remained pinned and it can be very bullish.
However, for a trader, I will show what I look at to find stocks that may still move higher. They could have been scooped up today on the break higher, but they may also offer an entry if they pull back Thursday. In time, they can play catch up, even if Gold & Silver go sideways. The problem is – Where do you put your stop? You must decide what you are willing to risk if we get a pullback sooner than later.
AG – I own this and I dont really know if this is still wave 3 continuing, or putting in 5 now, but a run to the 200sma is possible and that is 20% higher. Not a bad trade.
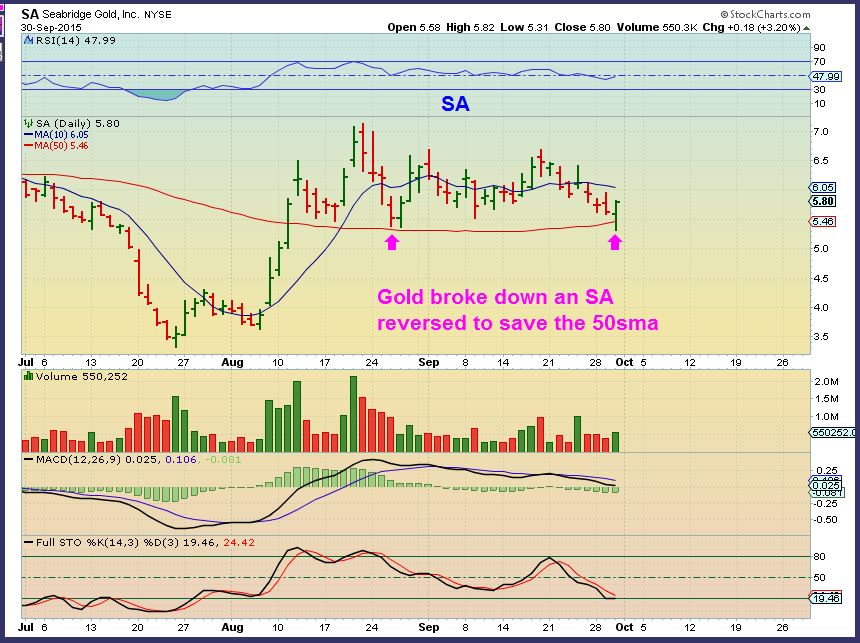
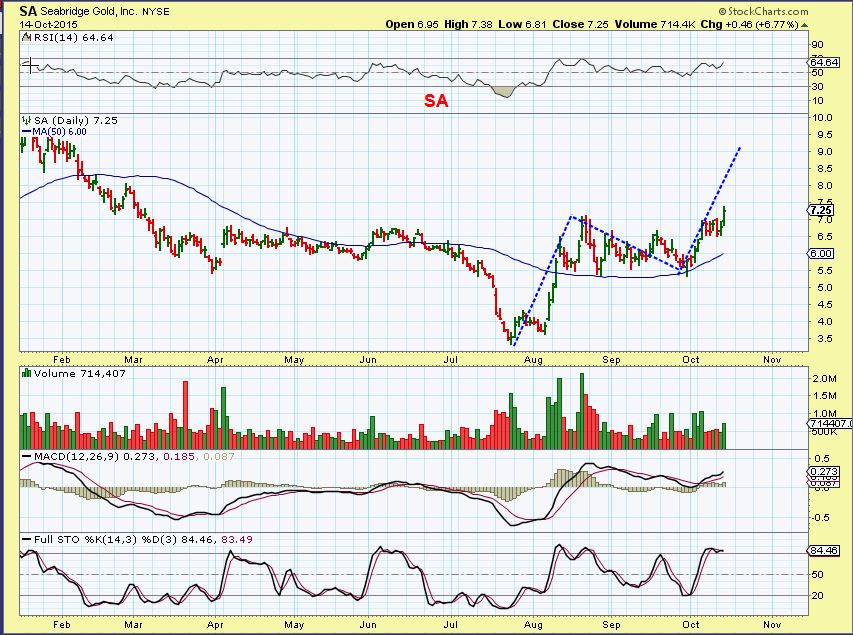
I pointed out SA as a buy with this chart
Today it looks like it may complete that move higher to $9. It also may be a giant inverse H&S.
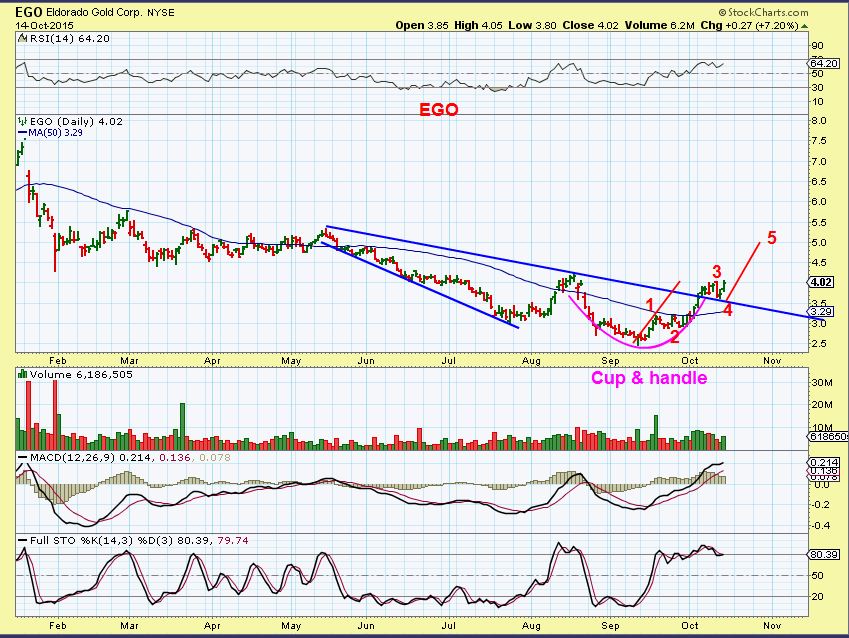
EGO is at a break out point. Was that a mini Cup& Handle?
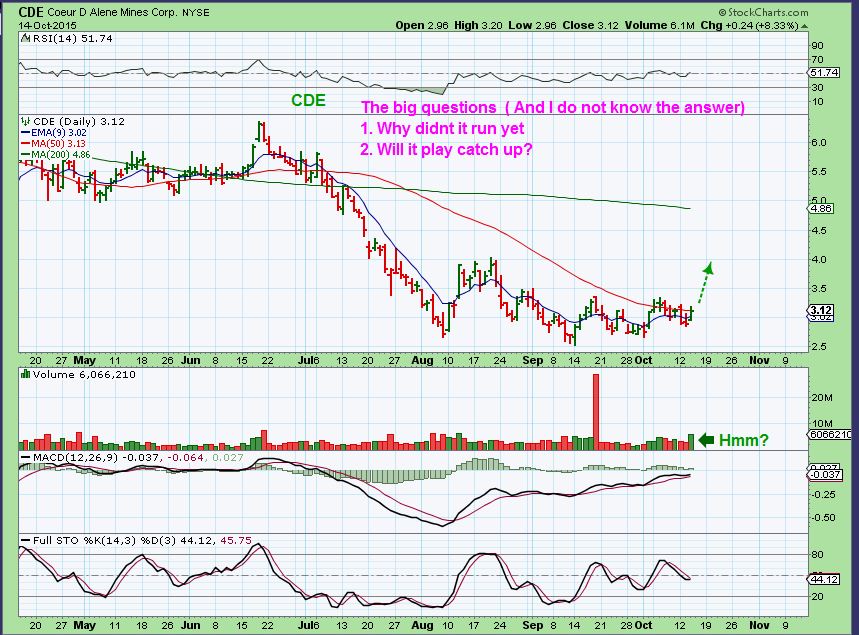
CDE just never joined the run, but has formed a constructive base. IF IF IF it decides too, this is a low risk entry when it gets above the 50sma.
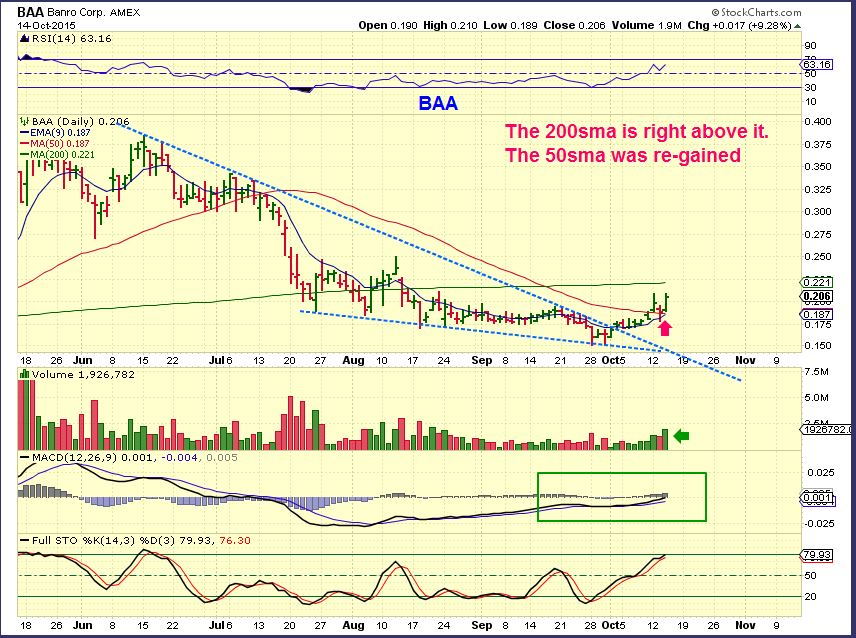
BAA – I hate to even bring this up, but GSS looked excellent today and BAA ‘Might’ Be starting to recover. It has held above the 50sma for 3 days, but the 200sma is right over head. (Watch list worthy?)
Others that I think may be ready now, since they are breaking from bases could be SAND, SA, NG, IAG. Maybe XRA, HMY, PAAS, BTG and look at…
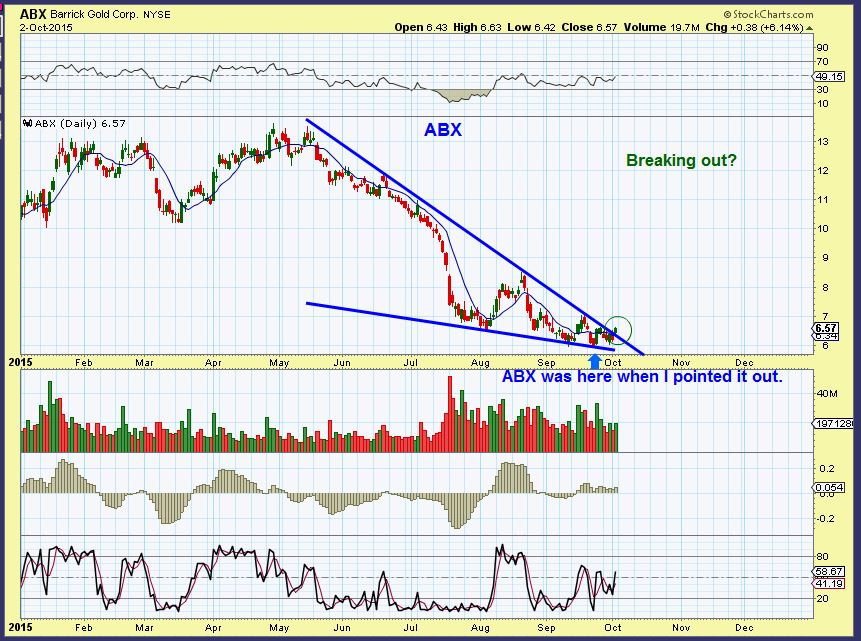
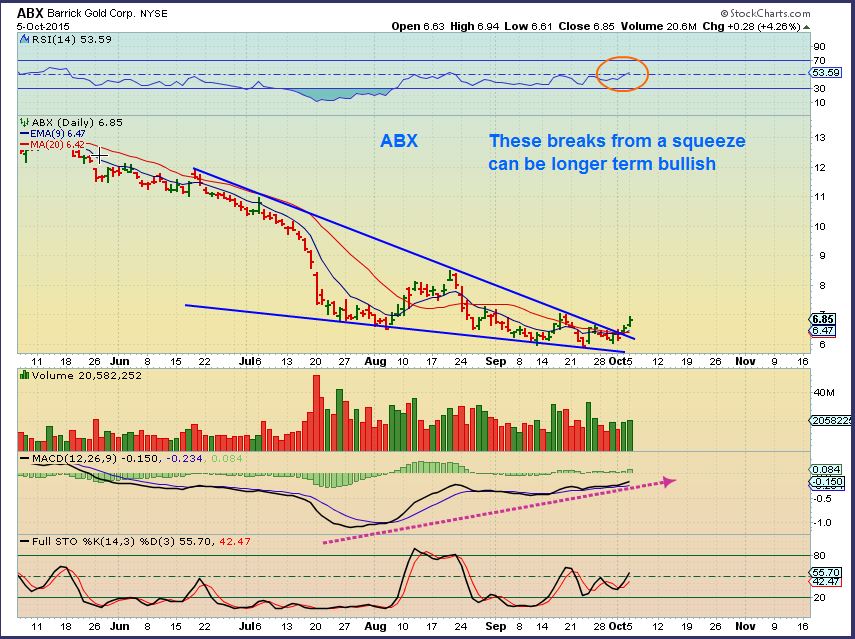
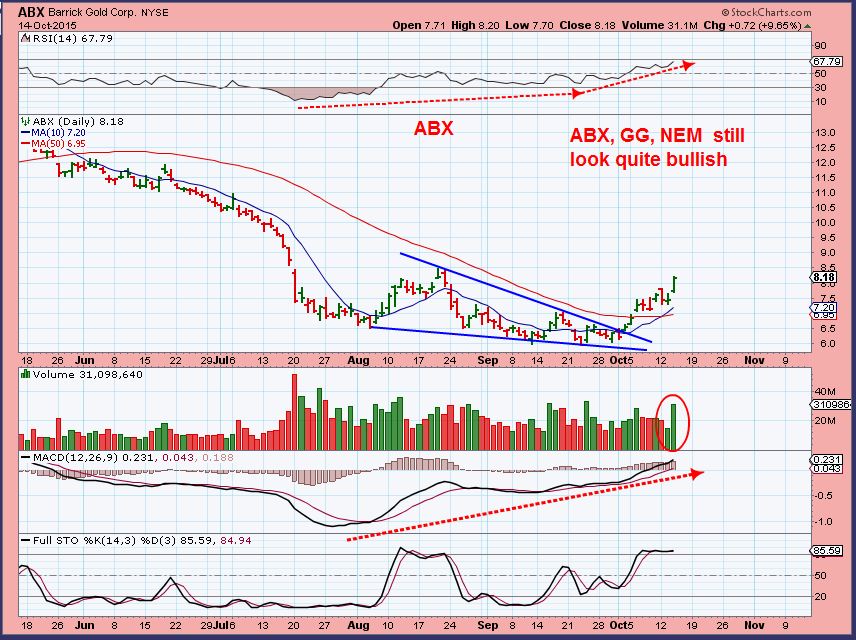
ABX – I had charts of GG, ABX, NEM posted recently, showing their bullish set ups and saying that THAT was the reason that GDX could go higher. Those are main GDX components.
ABX when I pointed it out Oct 2 – Bullish Descending Wedge
OCT 5
OCT 14
Take a look at GPL and HL. The SILVER stocks are really moving nicely. Traders could find one just breaking out of consolidation ( like AG? ) and just enter with a stop and take a chance? As always, the risk is chasing & getting caught in a sell off sooner than later.
Think about this : Miners & Energy ran higher in Aug – Oct . Many really wanted a pull back in Miners before the next leg back. Many are now saying, “I would have bought that pullback.” Well, Oil & Energy stocks are pulling back right now. Are we looking at them to buy the pull back? They may be setting up for another run higher, so lets take a look at a few for ideas of what to look for.
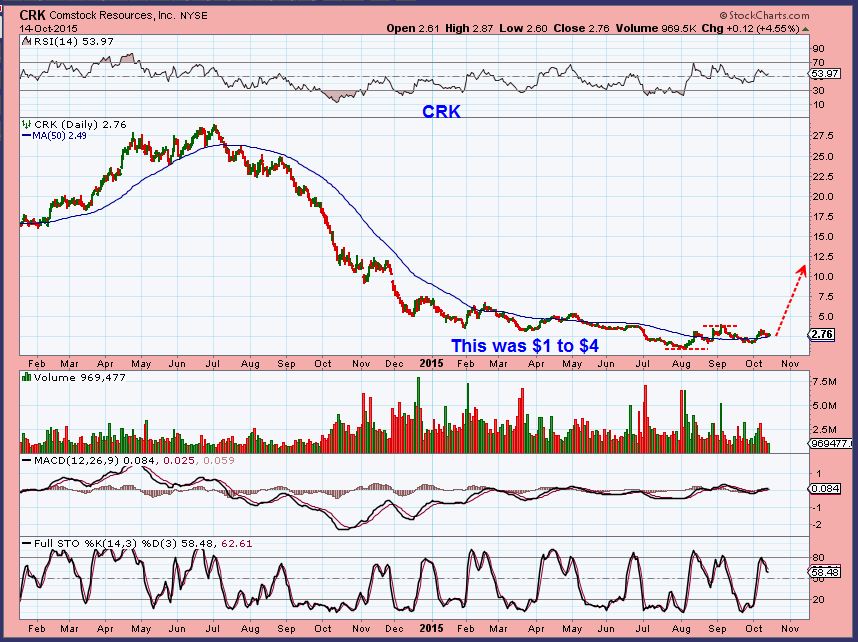
CRK #1 – Everyone wanted to own this from $1 to $4. 00. Is it too expensive at $2.75?
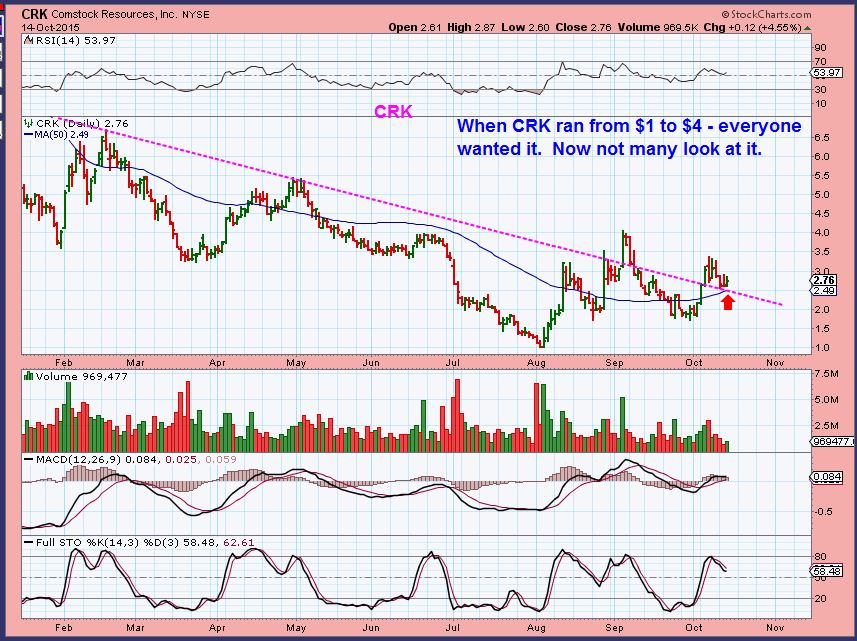
CRK #2 – The potential is enormous if it remains in recovery mode. $1 to $4 looks like nothing on this chart.
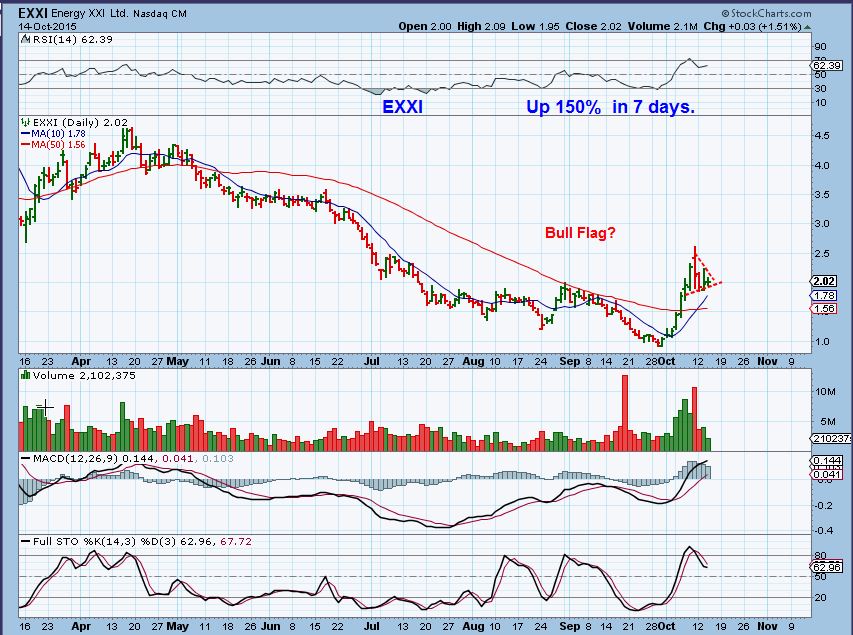
EXXI – Nice run…Bull Flag? Dont buy the flag, buy a break out.
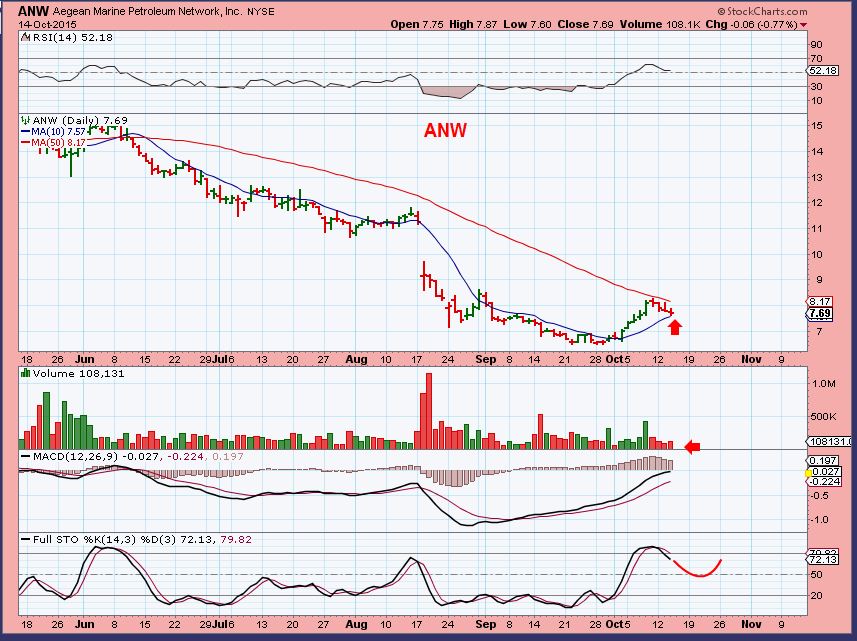
ANW – This support may or may not hold, but I’m watching it. It may form an inverse H&S too.
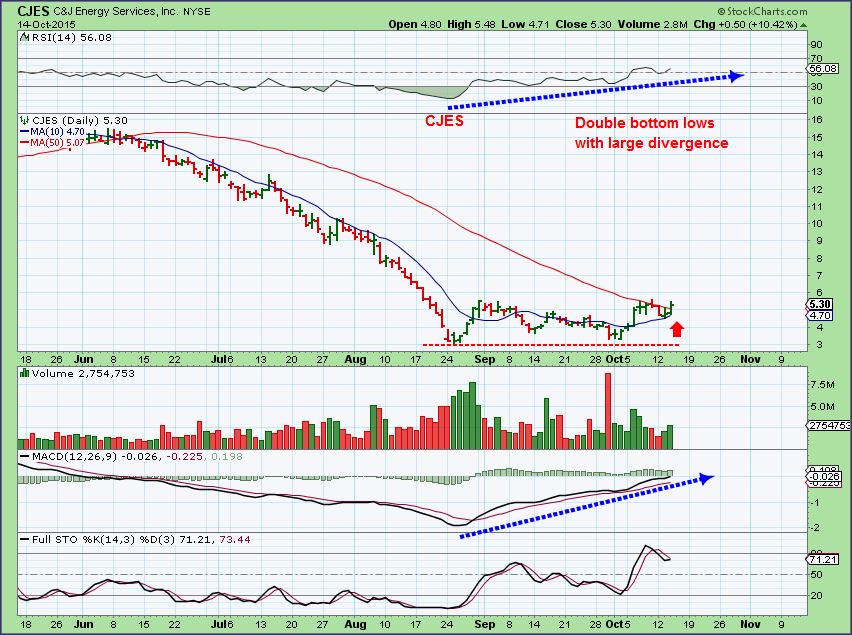
CJES – This base doesn’t look like much, but look closer. CJES was up over 70% in 5 days. Huge potential again, if this recovery has follow through.
Interesting moves in the Semiconductors, Metals, and Energy. Pick your poison and look for pull backs. You may find low risk entries that can form when they find support and then reverse higher to begin the next leg up. We also know that everything that goes up does pullback or go sideways later. A DCL will come later in time and waiting for that can be safer, but I’m not so sure that the next daily cycle will be as strong as the one we are seeing. Energy may be setting up right now. 🙂 Have a great day.
~ALEX
Just A Little Change 
 Whats Up?
Scroll to top

Great report Alex as usual! Things R rosy on the ASX down under, plenty of beaten down commodity stocks with long flat bases showing some life. Here’s to extra spending money for Christmas hey!
Matt
Hey MATT – Nice to hear from you again, hope all is well?
I have been scouting out some bases too, hoping for an upside run. Some nice pullbacks in the US markets in commodities so far .
CENX sits right on support here, for example. (Refresh) . These offer low risk entry with a reversal higher.
Mate – summer weather is here things are great! Plenty of camping, kayaking 4WD-ing wakeboarding all the fun stuff.
Also fun was the tag of that area you said to watch for in WTIC and the nice long tail left behind 🙂 (attached). To a tee mate, Really like the set up in oil right now. sitting pretty on the right side of the 50 DMA as well.
Thanks for all your hard work
Alex, I’m confused on the cycles, Are we on the 2nd daily cycle in GDX and GOLD, or the third? You said day 8 for silver, is gold day 11?
Hey Bill, It’s tricky as I mentioned, because triangle patterns formed and can make the cycle count difficult to monitor.
Looking at the charts we see that : GOLD bottomed with it’s lowest low in July. Silver put in its lowest low in August. Miners had their lowest low in September, so you would assume that the 3 are not in the same cycle count. They bottomed months apart.
With the above information, I tried to make it pretty clear in yesterdays report where each cycle count is. You may want to go back and see it explained with charts there again. It’s easier with those charts than me trying to explain it here again.
I’ll go back and check. Thanks
I dont know if people realize it, but for a quick look back at a prior report – there are arrows to the right and left of each page. Clicking on them will quickly bring you to the last post or the later posts
REFRESH
Thanks Nice button for sure.
Very strong volume on GST – looks like it will break from this base ( disclaimer: I pointed it out as it moved above the 50sma and I do own it, it is energy) .
It has as much volume 20 minutes into the day as it had all day yesterday or Tuesday.
BAA ( From the report, chart above) Ran right to the 200sma. Has pretty strong volume in the first 1/2 hr, it may be trying to break through after putting together a 1 month base.
On the chart, yesterday BAA looked to have increasing volume with 1.9 million for the day. Today BAA has 1 million in the first 1/2 hr. HHMMM
Starting to pop a bit. Volume over 2m. Looks good. FSM got an upgrade a few days ago and has been very strong since.
Yeah, i noticed that FSM really moved up off of those lows, I didnt know about the upgrade.
Alex,
You mentioned SGY in a previous report…..is this a low risk entry now?
thanks
I like SGY for the huge pop & run that it did, but right here it is kind of in no mans land. This is a tough one for me.
I can see some support here on the lft side, but the 50sma is still a bit lower and it is below the 10 & 20sma, so ‘support’ is questionable. Yesterday it lost the 20sma and regained. Today it lost it, but looks like it wants to regain it.
I cant say its ‘low risk’, there is a small risk that it will drop further, but it also may meander sideways to the 50sm and stabilize here too. Its rather unclear.
what happened to UNG/UGAZ?..
was just considering a buy , when it got slammed.
phewee that was close
Today is Thursday and the NATGAS report comes out. I didnt see it today, but that was quite a strong reversal.
Report was bearish. +100bcf vs. consensus +93bcf.
Hi Alex,
Many Thanks yet again for this great service.
CDE :
The big problem for Coeur, however, is costs. To be fair, it’s been working hard to reduce how much it has to spend to get an ounce of metal out of the ground, but it has a long way to go. For example, the company reports all in sustaining costs on a silver equivalent basis. At the end of the second quarter it pegged its all in costs at about $16.60 per ounce of silver. On the one hand that was the lowest level since the company started reporting all in sustaining costs in 2013, on the other hand the spot price for silver is currently around $14.50 an ounce. See the problem?
Needless to say, Coeur is losing money right now. But more important, the price of silver and gold have an exaggerated impact on the company’s business and investors’ perceptions of its prospects. The shares of this miner are simply languishing along with the prices of silver and gold.
Hi Jay,
Thanks. I do understand the Fundamentals are weak for CDE, as they are in many of these Miners. From a charting viewpoint, CDE lagging doesn’t make sense unless there is something else there. Many of these base out & set up for a run higher with forward looking reasons. So when Silver goes from $14 to $16 as it just has, many Miners will just take off as a result of short covering & then buying. Last November CDE went from $3.50 to $7.00 and it had weak fundamentals then too, with Silver trading around $15- $16+.
So we just saw GPL all of a sudden up 100% from Summer lows. AXU is up almost 100% . CDE is up 30% from summer lows, but remains inside of the base. So far the set up is a good base, I am thinking that it will still play catch up, so it’s on my watchlist. If it breaks higher with volume, I’m in 🙂
Thx again for your input.
Jay, Good to know. I remember AUY being one of the lowest cost to produce gold miners. Does anyone have a list?
http://finance.yahoo.com/news/15-lowest-cost-producers-precious-174244518.html
Lowest cost producers listed from Jan 2015
Right, but IF (and only IF) silver were to eventually move out of the bear. All in is $16.60. Silver moves to $18.60 – that’s $2/oz. Silver then moves to $20.60 – that’s just over 10% for silver. But for CDE that goes from $2 to $4, which is double. Just saying. For the future.
http://www.24hgold.com/english/listcompanies.aspx?fundamental=datas&data=company&sort=resources&vc=1&ordre=6&iordre=6&visu=pops
Interesting link on gold miners
Oil markets seems to be bouncing off 50dma
USO looks very good with a reversal at the 50sma
WTI lost 200 4h MA but coming back up and technicals maybe supporting Refresh
NICE JOB JD – I was watching all of my energy stocks and just figured that they were leading the way, like Miners with the metals. That was a nice reversal
yeaaa.. i was a verrrry naughty girl and hopped in uwti … spankings for me … ;o)
I love the way it is up 1%, but you are probably up over 10% because you bought it in the red.
Buy the dips! Thats the way.
yessss daddy…
Go To Your Room!!
… my life story …lol .. my poor dad …;-)
your cha cha cheeeta …. cmcm
Very nice CMCM. It sits on the 9ema pushing against the 50sma. I like it.
I should have added but wasn’t able to at the time. Busy. And scared. Maybe next dip!
I still see oil going to $42. On the daily chart (USOIL) the MACD is crossing over negative and RSI is heading lower. I could be wrong, be careful.
Crude inventories are up!
I think She’s gonna climb that wall of worry
You expect oil to go up with more inventory than expected? Really
Yeah, +7.6 was rough. Though less than the +9.3 that API reported last night. Here is what I find interesting – oil has bearish report, gets rocked and then recovers. Gas has a bearish report, but only lightly bearish compared to crude build, get rocked, then stayed down at crush depth. Not really sure why the extreme divergence, but glad that oil bounced back!! Just say NO! to $42!
BBG is a beautiful low risk set up. It hit $4.36 today, its at $4.84. Nice reversal off of the 50sma. I got it at $4.63
It moves like a 3xETF- so not for the weary.
Update:
BBG was $4.36 this a.m., then $4.80 when I mentioned it, now $5.14. This was perfect at the 50sma. (refresh)
yes… perfect perfect call&setup…chartfreak – tx
wanted to take that trade buttt.. no spare $$ — super clean waves.. this goes on my list to trade.. thx
https://www.tradingview.com/x/QrzAvG0c/
Yes, the waves are quite clean.
You should take a look at SWN too.
The upside potential on these is very healthy.
EDIT: SWN is still in a downtrend, but itis setting up to run soon I.M.O.
Alex, have you looked at old friend EYES?
Not until you just mentioned it.
Nice capitulation and nice volume on the rebound
There goes BAA (from todays report) – popped above the 200sma with very big volume for only 1/2 a trading day so far.
BAA been holding this one since August…. in the money finally 🙂
Tough ride
Good to see that volume too. It may draw in the ones looking for a strong move above the 200sma.Maybe if there is follow through tomorrow, etc.
ERX & XLE turned higher on the 50sma .
Alex, I was wondering how low CENX would have to drop for the setup to have failed. In entered yesterday at 5.60 and want to set a stop at a place that makes sense but is not too tight. Thanks for your insights.
I’m going to guess! $4.26
Thanks for the feedback. I am actually looking for price to hold the 50 dma but want to give it room to go under a bit as it is doing right now. Just not sure how low is a hard break of the 50 dma. I suck at charting.
Looking at AREX, AKS, and some others, I honestly think the selling is going below the 50sma and back just to shake out people. It’s not you being bad at charting, its the markets being bad at playing nice.
Personally I dont like to give back more than 10% , and I only do that if I really have strong conviction on what I am holding.
CENX does look good. $5.00 would be 10% from his buy, but I am thinking that it has pulled back 61% already and should stay near the 50sma reasonably.
I don’t like giving back more than 10% (no one does) but some of these are moving 10-12% per day so the ‘wiggles’ are awfully darn big!
Hi Alan,
Sorry for the delayed answer, I was away.
That is a tough one, because I dont want it to be so loose for you that you take a lot of drawdown and THEN get stopped out, but – this can go under the 50sma and recover. I say that because I am seeing many good looking stocks do that. I think they are stopping people out and then buying it back.
Take a look at AKS and use your 50sma. The past 4 days price has dropped a good amt below the 50sma and then recovers and today looks like the real reversal for a move higher. Its like it has been purged of buyers buying at the 50sma for 3 days with shake outs and now it’s heading higher.
So I am seeing that in some Energy stocks too. AREX has almost stopped me out 2x, but I switched to a mental stop , because I could watch it. Volume is light so I hold on.
My answer, My stop would be about $5.20 & unfortunately thats a 6% loss if you get hit. I’d have to buy back in if it reverses and closes above the 50sma again. I think CENX will be fine, but you have to do what you can to protect yourself. If you get back in above the 50sma, you will probably make your 6% loss back in spades. It can run above $8.
Thanks. I can live with a 6% loss if the stop is hit.
CF, thanks for sharing the advice here. I am using mental stops on a few – example BAS today – lost the 20-day SMA then reversed and finished up at 10-day. If I had a close stop would have stopped out this morning and then been out the reversal. Though I do have to say I was sweating a bit this morning. Decided to just turn it off and concentrate on work. Phew! Starting to learn patience (but it has NOT been easy).
I mentioned GST this morning. It popped and dropped all morning. It now looks like a solid break out . If this runs to the 200sma, it is still almost another 45% from here.
.refresh
.
You recommend buying this here?
It’s so difficult because it could drop tomorrow. I like to only recommend lower risk of drop after entry.
If I was buying it and thinking of adding a good amt, I’d try a starter position and IF it drops tomorrow , I’d add more. I do think this is a legit break out with good volume.
It seems to be selling off a little right here. I dont think its a threat to the projected run, I think some are locking in some gains.
Oil Road Map. IMHO. 🙂
If USO breaks thick blue 2 my count is wrong.
Long USO calls and a basket of junior oil stocks with very low debt. fwiw. 🙂
teehee hee.. N .. I … C .. E …
Ditto…
oh .. hello Kenny ;o)
How is my EW Gal ! 🙂
Are you still giving these guys in here a hard time ? ;). I HOPE SO !!!
.. absolutely… everyday ;o)
I am basically looking at it the same, as far as your 1 and 2 and currently in 3.
Thx Ken and good to see you again ( Do you just hide away during slower times and calculate? I used to do that 🙂
Lol….that’s exactly what my wife says.
It just means my positions are on the correct train. 😉 Then I go outside and Play ! 🙂
Excellent. I love it when we have some trades on and they are just acting correctly. Behaving and no babysitter needed. Then I can get outside too!
All work and no play…
To be honest OIL has Not been an easy trade. I have been adding to my basket of juniors for the last 3 or 4 weeks now with some draw downs but I think this may be an opportunity for a long term hold with Fantastic Returns !
agree
You and Me Maria !!!
If correct then We can all go out and play outside together somewhere warm on a rather large floating vessel in the Bahama’s ! Been there and it is quite relaxing. 🙂
I’m in! 🙂 My report tonight will focus mainly on Energy, because the set ups there now are very good looking.
Friday report. Bonus!!
oooo .. sounds heavenly… :o)
It has. I have had to be really patient. Which has long been a weakness for me. Instead of just keep jumping in just really waiting for the right pullback to come to me. Staying patient but really need this to play out; plenty of time left.
lol …
Ken, thanks for sharing. In on the calls with you. If we hit that 3 (of 3) target above, I’ll cash and re-analyze. That would be Sweet!
WTI , CJES , QEP – etc are a good looking group of set ups here ( SO many Energy stocks are buys right now, but I dont have time to charts them and alert. Tomorrow will be an energy report).
Look at KEG, BBG, QEP, HAL,