
Moment Of Truth Time?
I was a little surprised to see the dollar down and also see the $CRB, $GDX, and $OIL down too. They’ve all had nice moves out of their lows, and now it looks like it may be the moment of truth. Time to see if it was just another bear market rally or could it be the start of something more?
WTIC – From the weekend report. I had been expecting the 200sma to offer resistance and a quick dip lower.
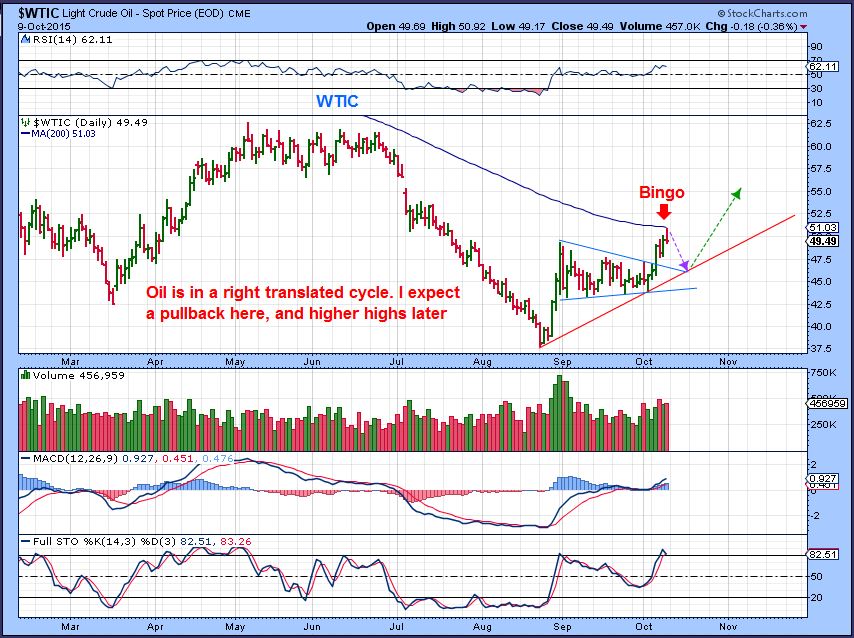
There are a couple of other factors in play that I am watching too at this point.
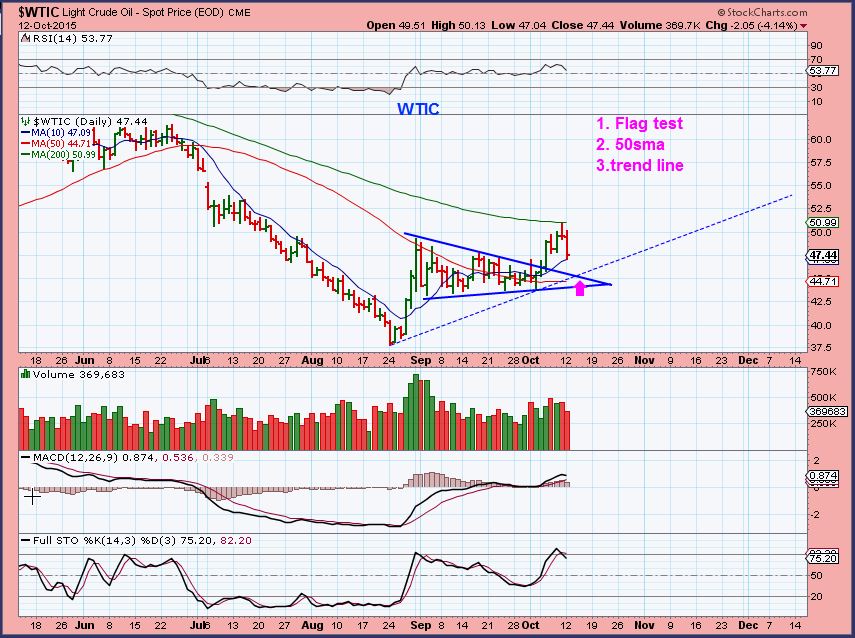
While Oil still looks to be on track here, I’ll be looking to see if these support areas can hold price.
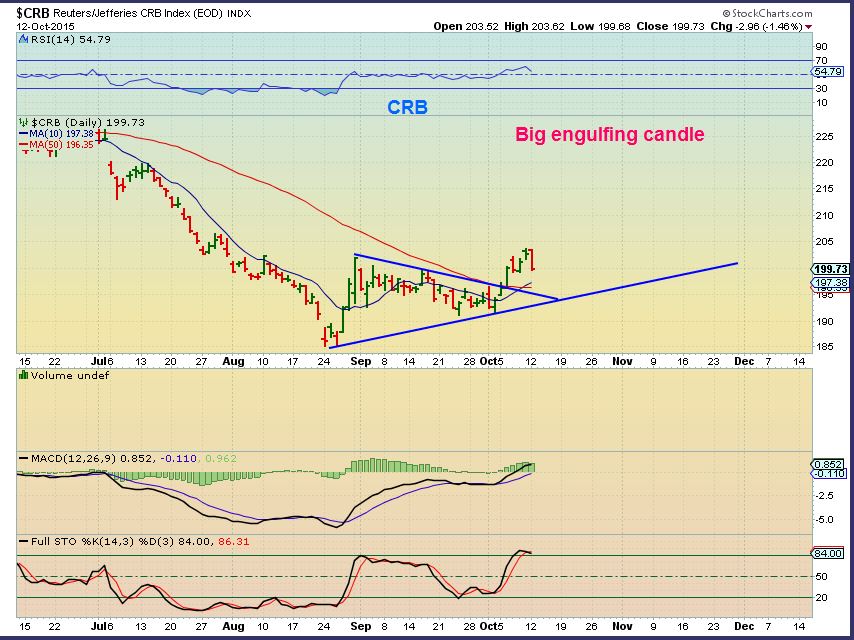
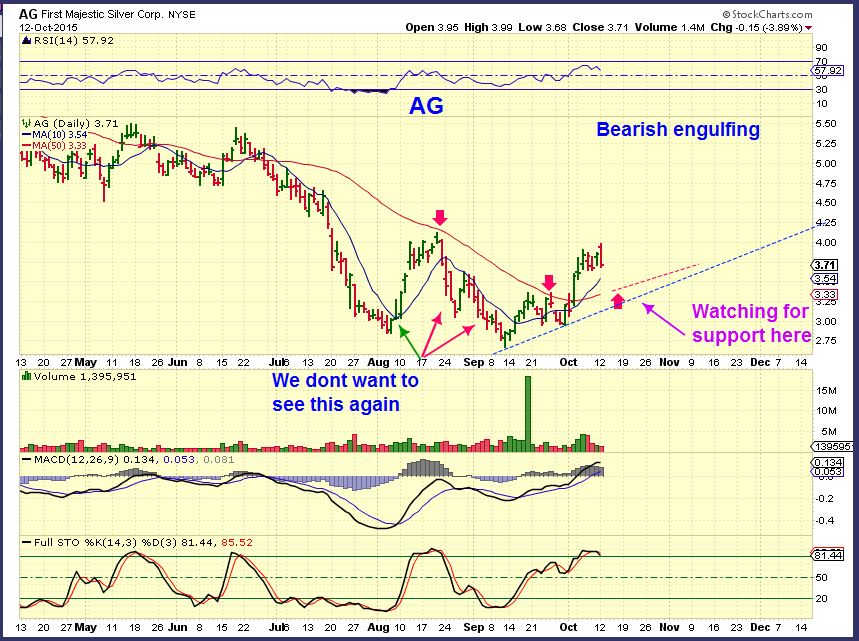
The CRB took a dive with the USD down, and it looks like a bearish engulfing. This is now another area to see keep an eye on to see how the pullback plays out. MTDR and FCX pulled back slowly Monday, while CENX and VALE were a tad sharper, for example.
GOLD – Continued higher Monday, but resistance is right overhead.
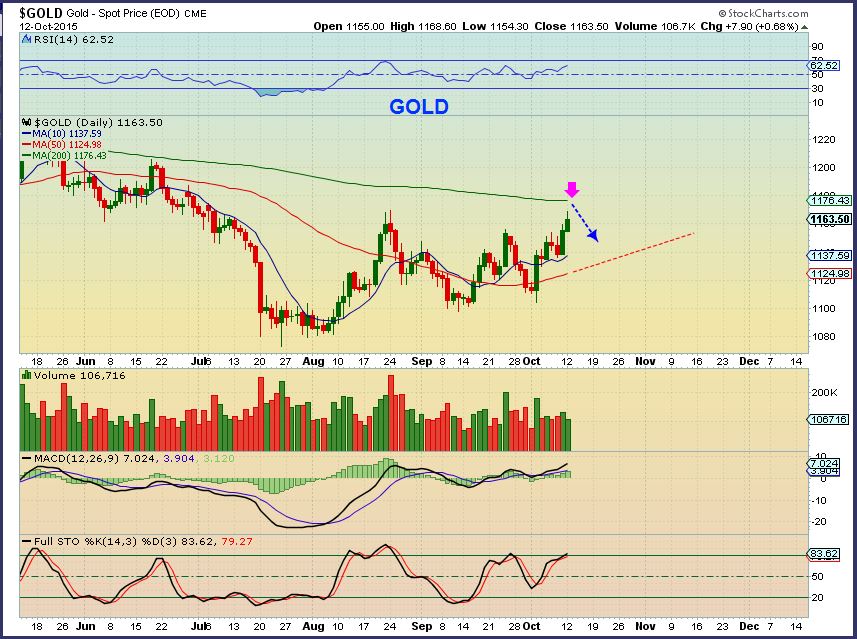
.
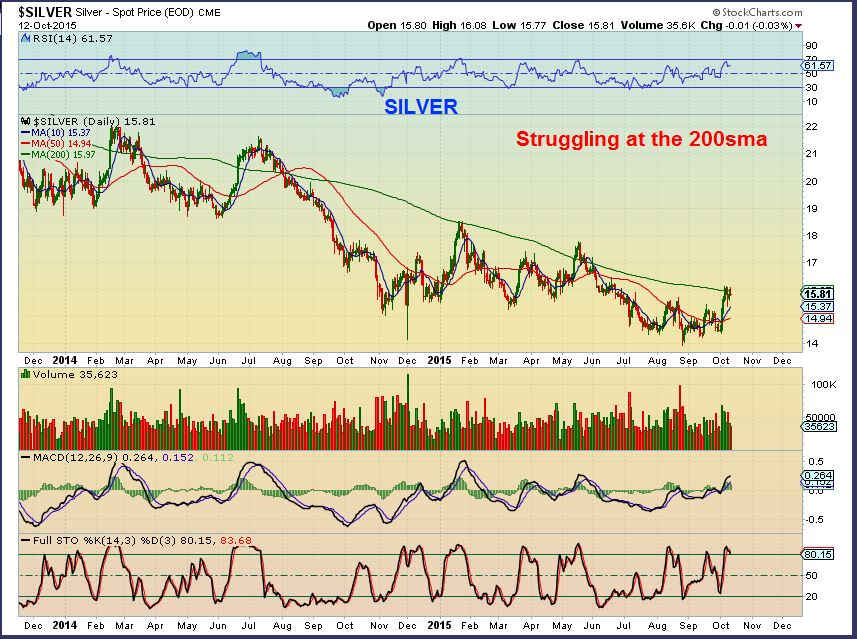
SILVER – Silver continues to struggle at the 200sma, but was only down 1 penny.
.
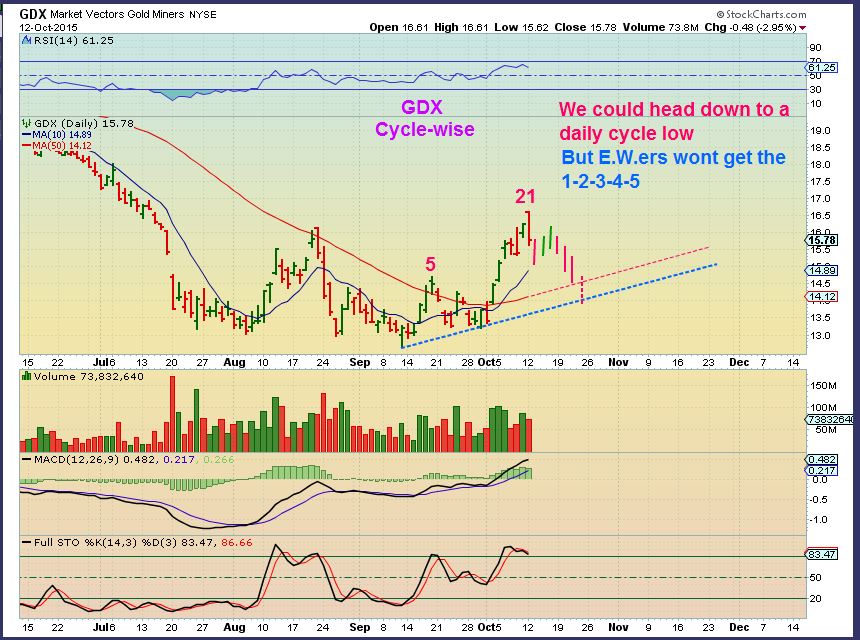
GDX – GDX had a bearish engulfing on day 21 and may be dropping down to a DCL. Using CYCLES, we may be on day 21, and this would then be a right translated cycle. This is just an idea of how it could use up time. This is not a prediction, just 1 of many possibilities.I always keep in mind that a drop to a DCL goes deeper than expected, it often changes sentiment and scare people away.
.
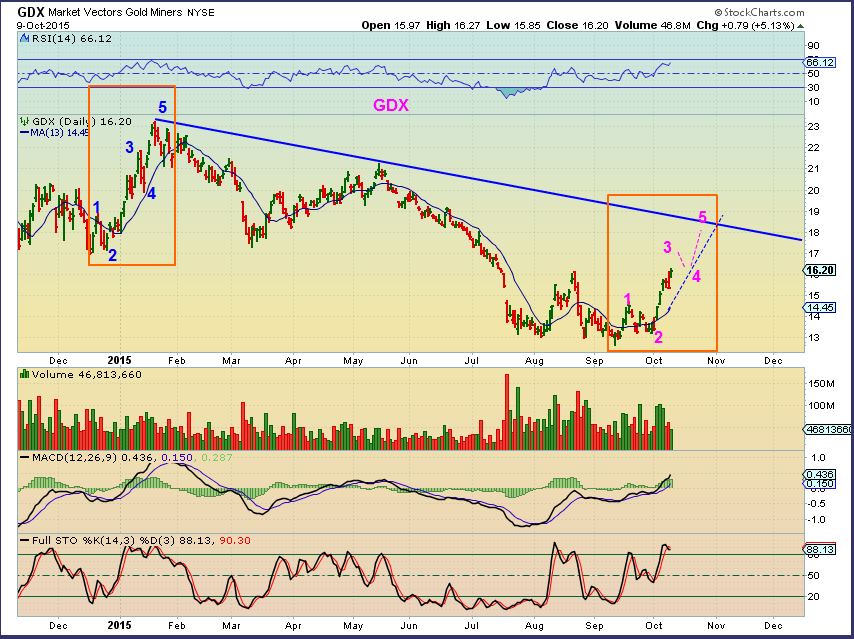
That engulfing candle today in GDX is bearish, but I want to point out why this GDX call from the weekend report still could play out.
.
We had the same bearish engulfing back in January and it only dropped for 2 days to the 10sma, and then 1 quick run to the top. ( Magenta arrow). After it peaked, look at the drop to the DCL/ ICL in March. Gradual while topping, but then it dropped steeply and almost to Dec lows again.
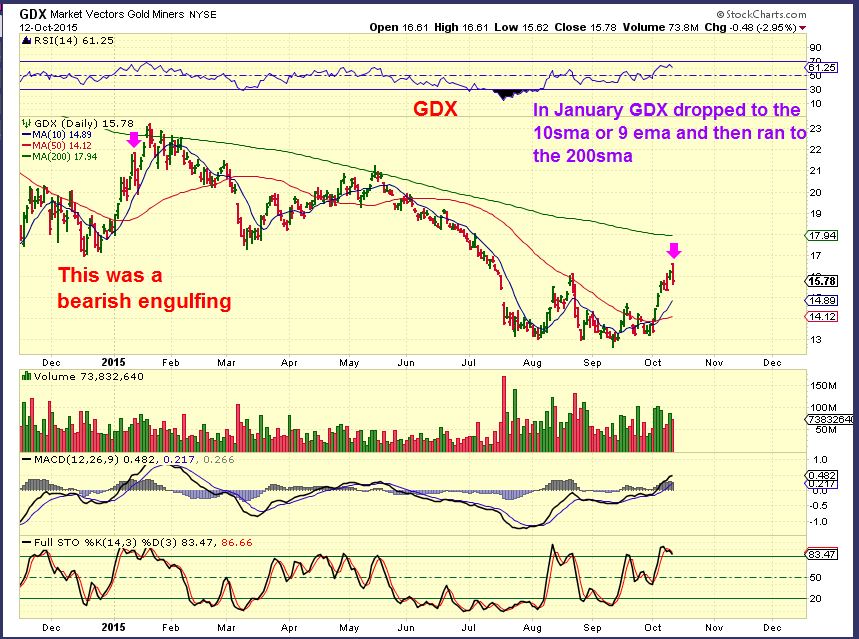
So you can see that we may be at a critical point. I expected a bit more upside in many areas, but Bearish Engulfing Candles ( with the dollar down) must be noted and watched. To close this report I am just going to post several random Energy or Miners charts and show how I would watch the pullback. I am looking at areas of possible support to see if they hold up, or will we get another prolonged drop. In other words, we may be heading for some buying opportunities or we may see break downs. The following charts will show you what I look for.
.
SGY –
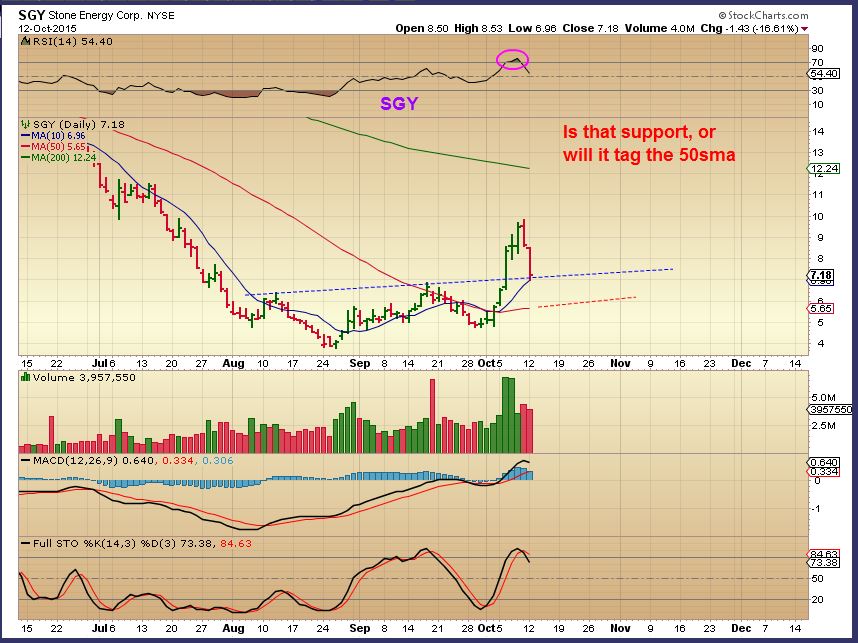
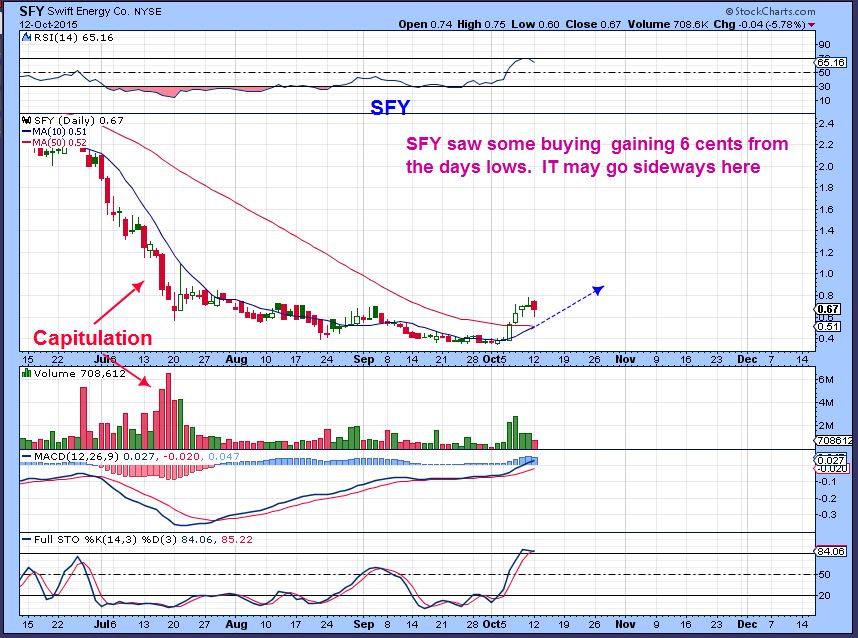

I’m looking at some of the above stocks and recall myself saying, ” I wish I had taken a position in that little rocket ship.” Think about WG, CRK, SA, maybe even KEG & SFY. So if we pull back lightly and reverse on support we may be getting a higher low and a low risk entry. We can buy near support and put a stop closely underneath. If we plunge down through support, obviously something else is going on here and we need to be patient and keep evaluating. So I am NOT saying that the buy is Tuesday. Be patient, often these pullbacks can take their time & just bounce around support too. Look at NG or SA with the 50sma , for example. They may be waiting for the next DCL before taking off higher.


I’m watching the dollar. It looks like it’s forming a left translated daily cycle and may not bottom until the FOMC meeting at the end of the month.
Also wathcing silver. It’s consolidating right under the 200 DMA. That’s a change of character from what we’ve seen in the past. In the past it has just busted right through the 200 to get everyone bullish in a hurry and then rolled over to head back down.
This looks more like a bull market climbing a wall of worry than a bear market rally trying to sucker in longs for another take down.
Hi Gary. I personally also like the way silver is unwinding a short term overbought situation (4 hr charts) by simply consolidating above the breakout level of a 3 month base pattern with the breakout level around 15.52. That smacks of strength to me and an underlying bullish tone.
The metals are starting to act more like a bull market climbing a wall of worry than the typical bear market rally that rocket launches during the second daily cycle. Slow and steady with corrections at every resistance level is what I want to see. And if gold can make a higher high next week then we will have our first right translated intermediate cycle in 3 years.
I like the sound of that. Slow and steady wins the race in my book and as a longer term trader/investor I would rather see things build in a nice solid way rather than rocket rides up followed by gut wrenching moves back down, even if only a temporary correction. It’s much easier on the nerves!! 🙂
I’m with you on this. I still feel we will move higher after another day or so to near the end of the month.. I’m targetin GDX 17-18 or so. Then a more substantial correction back to the moving averages.
I think you are spot on with the ‘PATIENCE’ advice today Alex. On my cotinuous oil 1 hour chart I now have five waves down from the Friday peak around 50.9. This has now hit the 62% retracement at 45.63 and is close the a potential back-test of the wedge consolidation. There is also bullish divergence on momentm indicators. So in the very short term this would suggest some kind of bounce after 5 small waves down. BUT…IF…this is a correction within a bigger upmove a completed correction in EW terms cannot be 5 waves. A simple zig zag for instance would be 5 down, 3 back up and then 5 more down to complete the correction. BUT there are something like 13 different correction patterns, so may get a lot more complex than that! So even under a bullish scenario the 1 hour patterns would suggest more backing and filling yet. Under a more bearish scenario we had 5 waves up out of the wedge which could have been a very stunted C wave form the 24 Aug lows to complete an A-B-C correction pattern. If that is the case then we have more work to do on the downside to finish off this bear market in oil. AND we have just made the first 5 waves down which just MIGHT…MIGHT..be the first leg down in a larger five wave pattern. Just trying to say how wise I think your advice is today for being PATIENT and if you do take a position then to heed your advice regardng stops. On my reading, the short term situation still looks very messy and complicated and you could currently argue both a bull and a bear case. Which one proves correct will only come with time and more price action IMHO. Just hope that might help in some way. 🙂
Well, There are many types of traders. Some experienced , others not so much. I know that some bought the top of yesterdays Gold pop at the open and the GDX gap open and then rode it down and sold it later for a loss. If traders do that too many times, it really affects their view of the markets. Normal ups and downs start to look like head fakes to them. The daily charts look fine as shown above, but trading emotionally buying pops and selling drops, instead of buying dips and riding it ( or selling pops) takes its toll.
It takes time, experience, and maybe even just watching how the markets move in both directions can make it less emotional.
Absolutely Alex. I’ve learnt at least some of those lessons the hard way!! It’s definitely very important to find the time frames and styles that suit YOU best as a trader. As you say many different types and many different styles but what’s important is finding the style that suits you and your own personality best. And that is no small challenge!! I feel like I’m getting there after quite a considerable period of time but never stop learning, so always tweaking things along the way. And being here on your site is adding another layer to my ongoing education, that’s for sure. 🙂
Thanks for the good info, CF
Fwiw, the GDX rally of January was a bear market rally; so if THE bottom is indeed in place, maybe that change of character would dictate following your scenario of dropping to the 14-15 area before the next leg up. That would likely shake the recent bulls off before taking off again
I only bring it up so we are all prepared in case it happens!
I have some individual miners I strongly want to add, but if the January comparable happens, it will likely leave this bull behind
The problem that I have in my head is that I think Gold may have put in an early (Very early & quite Bullish) DCL on that huge reversal day Oct 2.
That would be quite Bullish and we’d be very early in the cycle count too – room to run higher
Thanks for that. I was just considering my last comment about “this bull being left behind” – your scenario would leave many bulls behind, just what Mr. Market usually accomplishes.
Yeah, that possibility makes this very much more difficult to trade this. Tough spot
I was going to mention this possibility in todays report. It puts us very early in the next daily cycle and makes the last one only 15 days….but with the engulfing candle at the top it was too risky to mention and have people jumping in with an engulfing candle at the top.
I will mention more when I write the report tonight .
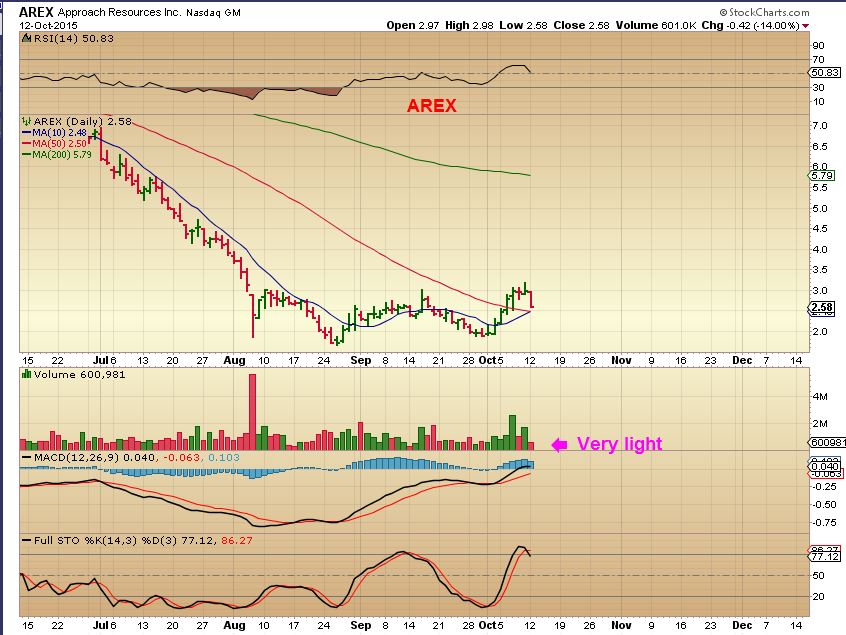
Some energy stocks gapped down and are moving higher. They MIGHT just be filling that gap from this morning and then could continue down later, but some (Like AREX shown here – refresh) ‘Might’ be doing a stop run/ reversal.
I’m just basically talking out loud here – Just pointing out things I look for intraday.
.
It also looks like a double top short term.
.
tee hee.. ditto .. cept i c …abc .. boooinggggg … (so far)
call me cray cray.. but i still think we are just finishing “4” – (was an abc) and now “5” is on deck…. guys????? (or gals are most welcome 2 comment as well.. come on out from the shadows… lol )
https://www.tradingview.com/x/0yp5GGDU/
“5” would complete “3 or C” ….
Y?
I’m with you on this. I think we move higher in a day or two to near the end of the month. Then we’ll get a more substantial correction back to the moving averages. I’m still targeting GDX 17-18 on this move. We’ll see.
$54 or bust, little lady. $54 or bust!
EXXI – reversal and up 17% : )
CRK, SFY, QEP, – nice.
For a low proiced stock I like KEG tagging the 50sma & moving higher too. (Bull Flag possible)
38.2% to 50% retrace on most of them. Good buy spot.
And now we have the wrong kind or reversal. 🙁 🙁 🙁
many 4hour MACDs look like they are in mood to correct.
DUST & DWTI look like they are ready to run a while
…although having said that oil may be close to complete an ABC correction?
I hope so!! I know we talk about ‘don’t watch all of the wiggles’ but when “wiggles” are 10-12% – Holy Crap! You can’t not watch that when you are in a position.
Can anyone else see OIL (USOIL) going to $42?
If this rally from 24 Aug lows does turn out to be only an A-B-C type move then that would make it an upward correction in what is still a longer term bear market and would strongly suggest there was one final leg down to come in the oil bear market. I do have a long term count where that does look possible but didn’t have it as my main count. But if we do still have one leg to go in the bear then $42 and likely lower is very doable in my opinion. But as I said earlier today I’m seeing this as a patience situation and waiting to see how things pan out. IF…IF… the bear market lows aren’t in yet I do believe they will be with the next leg down. And once we have a confirmed bear market low I also believe the potential longer term upside could be HUGE, so if I miss the start it personally doesn’t bother me.
Another alternative is that we have made an initial first leg up (an EW wave 1) in a new bull market from the 24 Aug lows and are currently going through a really complex correction for wave 2…there are something like 13 different correction patterns, some of which are hugely complex!!…so that would require more time and could see lower prices yet. For me there are number of possibilities and it will take more time and price action to reveal the bigger picture. But I am looking at things from a longer term perspective and Alex is the expert for how to handle and deal with shorter term trading scenarios and offered some solid advice as usual in todays report.
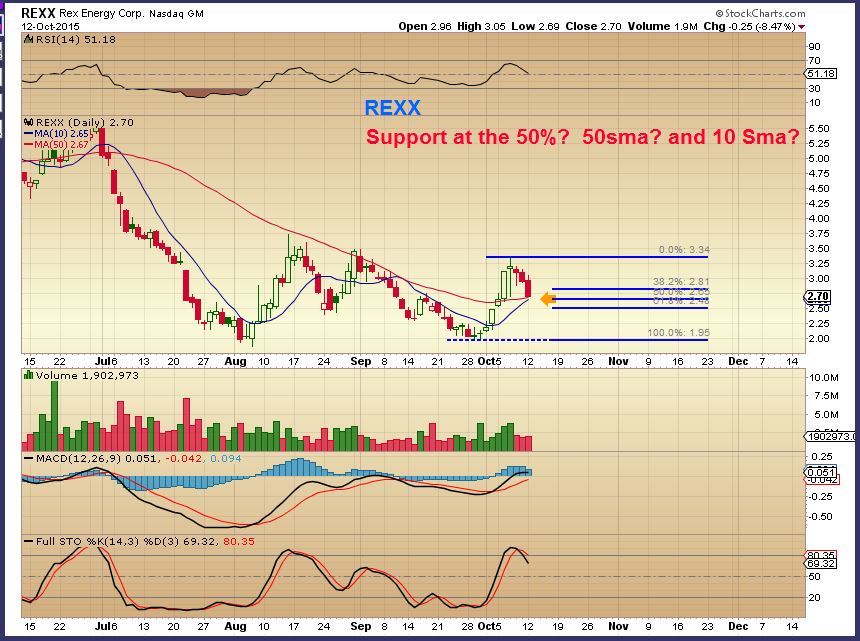
Would you buy this stock?refresh for daily chart
Likely (just looking at chart) though I would like to go back further in time to see longer term support levels. The moving avgs curling absolutely straight down at price gives me pause until I see how that plays out. Again, that is without any additional information.
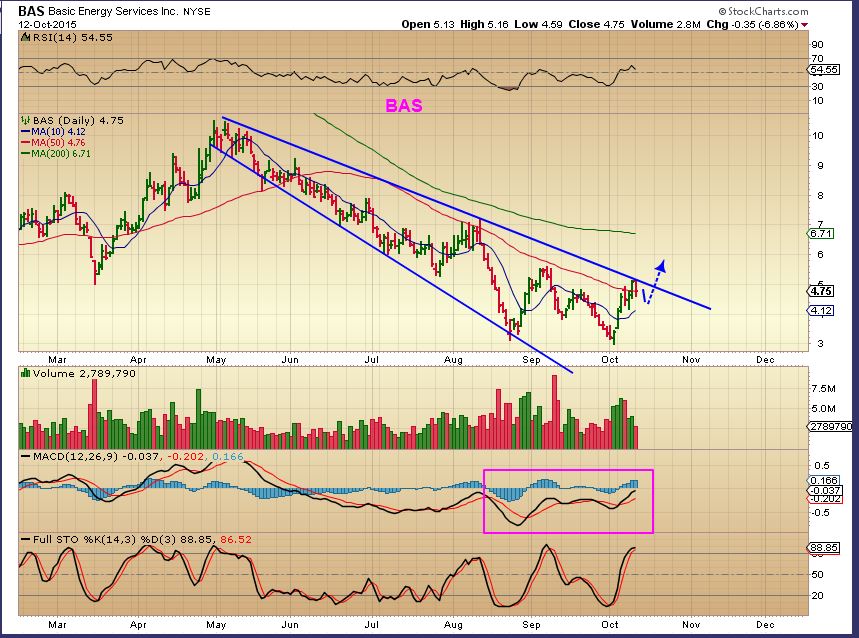
Kind of all over the map this afternoon – some energies holding up ok though morning advance wiped out, others on the cusp of complete breakdowns (I’m talking to you BAS). Baffled by miners turning down with market with gold up and dollar down, thought they would have either continued yesterday’s correction or shot out of it, not play ping pong.
Alex, what do you think – buy, sell, hold? Is this a viable spot to pay less for energy names or are we too vulnerable and need more info? I’m leaning towards staying pat for now.
Do want through out a ‘Thank You’ to the clowns at the IEA that ruined my perfectly good technical bounce with their stoopid forecast.
Does anyone know the reason behind the variance between GDX and GDXJ or NUGT and JNUG today. Juniors seem weaker. Don’t know why.
Not exactly. I did see a reminder that Canadian markets were closed Monday – many of the GDXJ components have HQs there, maybe they were reacting to two days of trading in one – especially today when market gapped lower, filled in, oil got rolled, and then markets fell to close on the lows.
I did notice (just from my little watchlist) that the results were pretty random – FSM was up 5%, AUY up 4%. CDE closed down only 1% but gave up a big early gain. Energy- BAS and SGY lost 9-10% but EXXI and SFY ended the day in the green. Some lost their 10 and 50 days, some are still well above. Random!
Alex, I hope you’ll take a look at the miners Tonight. I see GDX rolling over on the 4hr chart and shorter time frames. Divergence on MACD and RSI don’t look positive. I could see a draw down to $15 possible, that would be a 38.2% retrace. Looking for your thoughts.
Bill, I know it’s early (in relation to Wed trading) but gold popping in the Asian session. I would put money on us meeting that 200-day tomorrow. Were miners foretelling that? Of course, yesterday’s reversal in miners told us gold would be down today. And it was at 6AM. It’s up $20/oz. from 6AM to 9PM Eastern. That would have been a rough short!
So, yes, all think there could be a drawdown soon. I’m not putting money in here until we see a clear trend versus the bounce around at a top concept (think June-July 2014).
Thinking there might be more excitement here tonite at least among the EW crowd with $1174.999 pog.
Thank you Alex, for encouraging my patience with your diligence.
Just for general information – the Oil Inventory report is on Thursday this week, not tomorrow due to the Columbus Day holiday. API will report Wed after the bell, EIA on Thurs at 1030 Eastern. I would assume gas inv will also roll to Friday but I have not confirmed that one.
CF .. do u think this could be possible with GDX ? i havnt been trading/looking at it since my last box). .. but i skimmed profit today in some of my miners as it ‘felt’ like an ABC not a 123 .. sooo i flipped through some old charts and i found this one.. but – if 5=1 then that would send gdx to mid 11s … do u see that as a possibility .. (no laughing) ;o)
http://charts.stocktwits.com/production/original_2912478.png?1444794262