
Mixed Reviews
Mondays show opened up to mixed reviews.
SPX – SO far we have seen a nice move up from the double bottom lows, but there is some resistance slightly overhead.
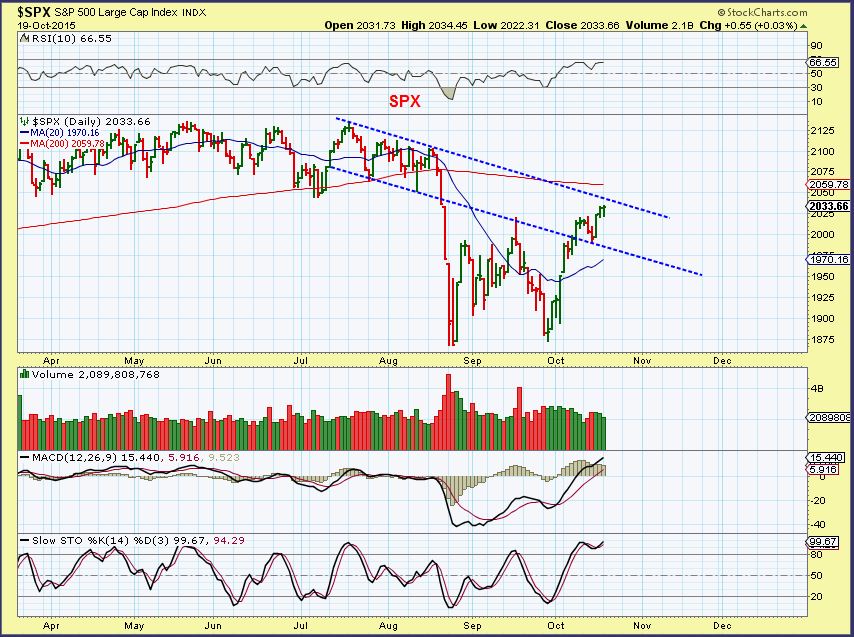
So here is where the reviews get a bit mixed…
I really like some of the individual set ups that I am seeing in the markets, but I feel like the overhead resistance is noteworthy. This is the same thing that is happening with the Energy & Miners. Many set ups looked great last week, but one day later they are getting mixed reviews. Let me show you what I mean.
.
NASDAQ – This looks like it is at resistance and could not power through it. It is overbought on the stochastics ( that bothers me less, markets can stay overbought), volume was not all that great.
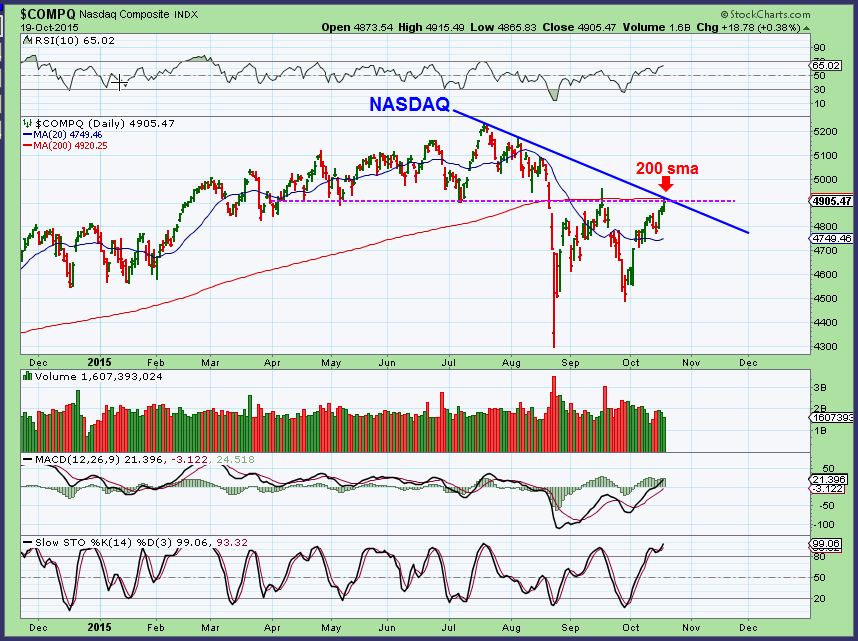
Then I looked at some of the Tech stocks that I liked and they look great.
GPRO _ Remember this from last week?
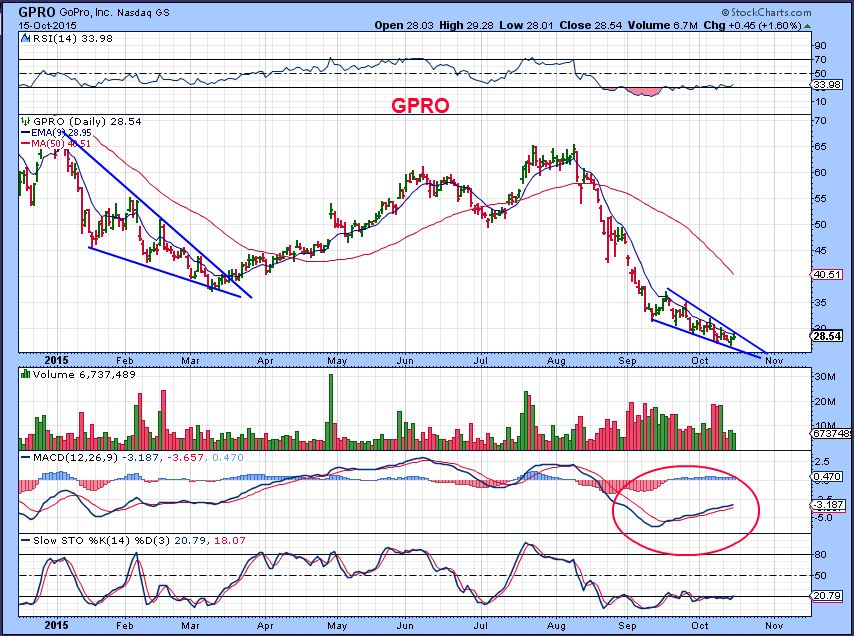
Today it broke out and should continue higher.
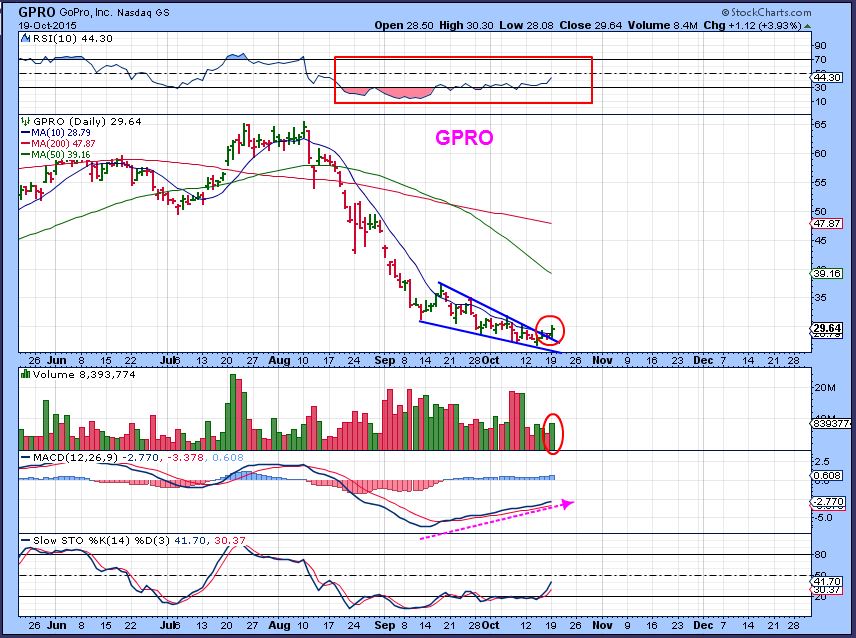
Look up KNDI, RMBS (EDIT: RMBS down 15% after hrs. See how quickly that can happen ), SNDK, FLEX, CY, ( The SOX) , etc and these look like good set ups and nice moves, but again the NASDAQ chart is up against resistance. I get mixed reviews.
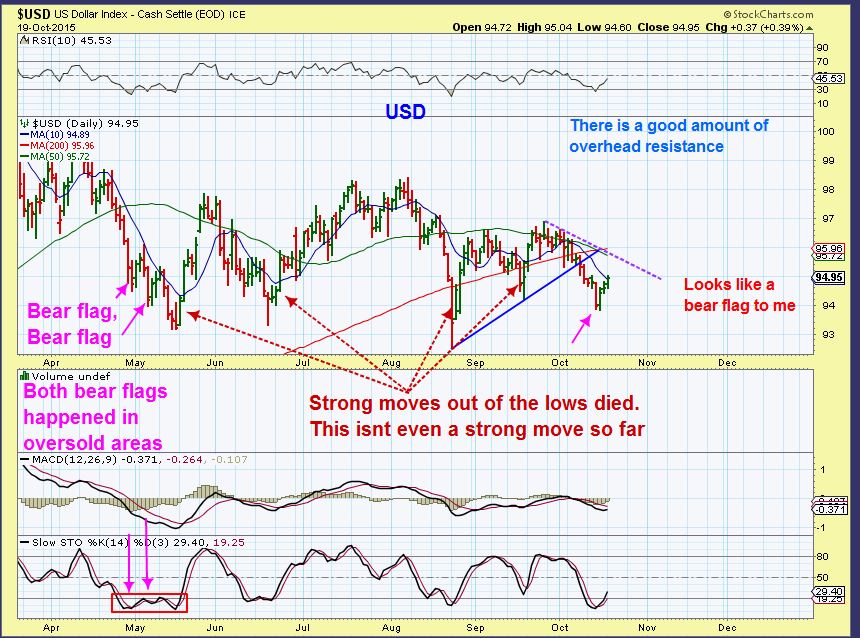
THE USD – If this is a daily cycle low that has formed, I do not expect it to move beyond 96.50. The last daily cycle topped on day 5 and gradually rolled over Left translated. I expect this one to fail too. If this is a DCL, A run higher here could bring GOLD into its next dcl.
Side note: Look at the Bear Flags on the left. This current low MIGHT be a new Daily Cycle low, but it looks like a bear flag to me. Most of the prior DCL’s had a swift move up out of the lows. so if this is just a bear flag, the dollar would drop 1 more time into a DCL and then GOLD/ GDX could top on 1 more pop higher. ( Mixed reviews without more time).
$WTIC – I saw this record high volume in OIL and commented that this has to be wrong. USO & UCO had lightish volume, and high volume like this would not be healthy. I mentioned last week that it is possible that OIL could drop to the 50sma and again on the triangle as a 2nd back test, and I think we may be seeing that.
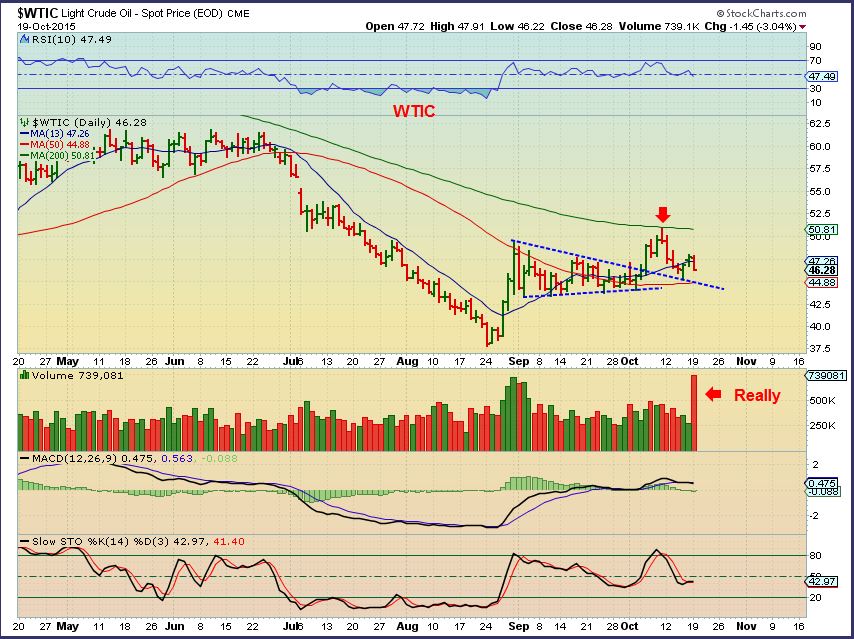
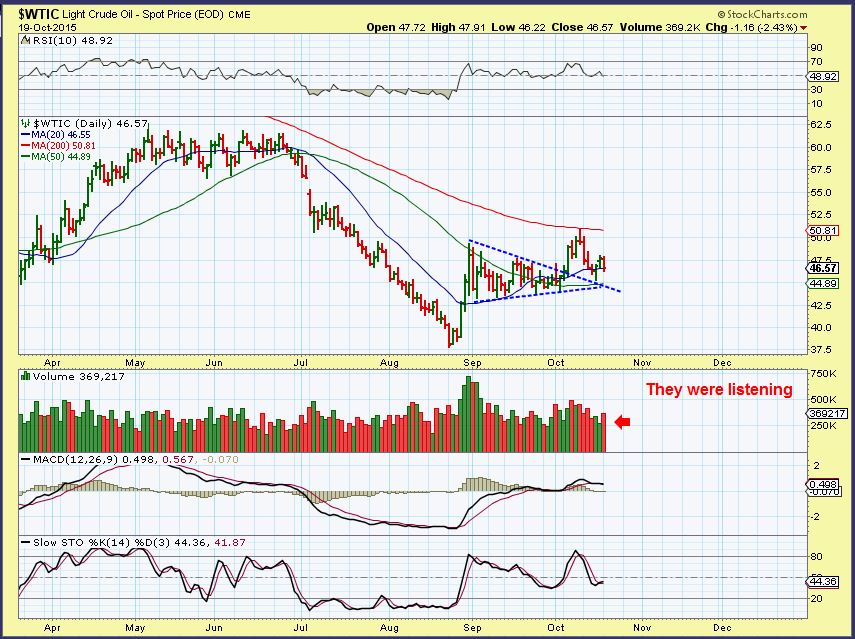
WTIC – 3 hrs later and stockcharts must have corrected the mistake with the volume. They cut it in half. 🙂
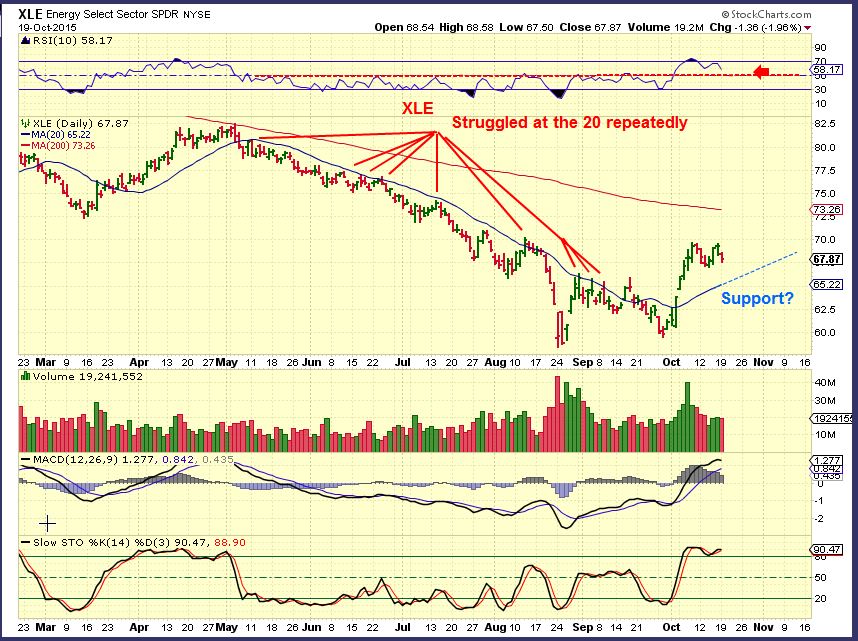
XLE – Still holding up at the highs even though OIL dropped last week. Since the XLE struggled at the 20sma on its sell off, it may find support there. So far it is just flagging here rather bullishly. Some Energy stocks look fine, others are weaker.
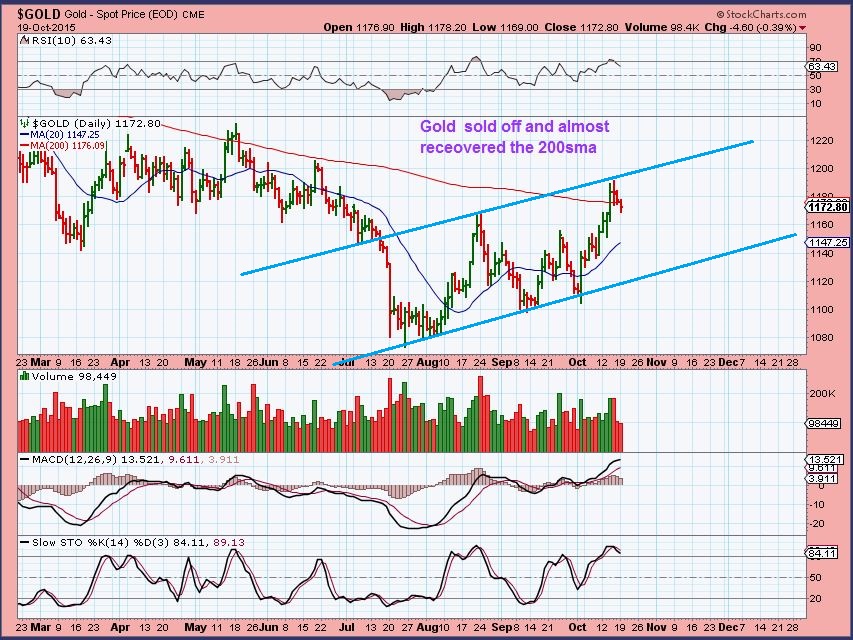
GOLD – Mixed message, this may be a temporary top.
– If the dollar is bear flagging and going to drop 1 more time, then this could be a bull flag with 1 last pop.
– If the DCL is in with the USD, The dollar could run higher for several more days and Gold will continue down. SILVER looks the same as Gold, and both lost the 200sma. When that happened in May, that cycle topped and it dropped for 2 months.
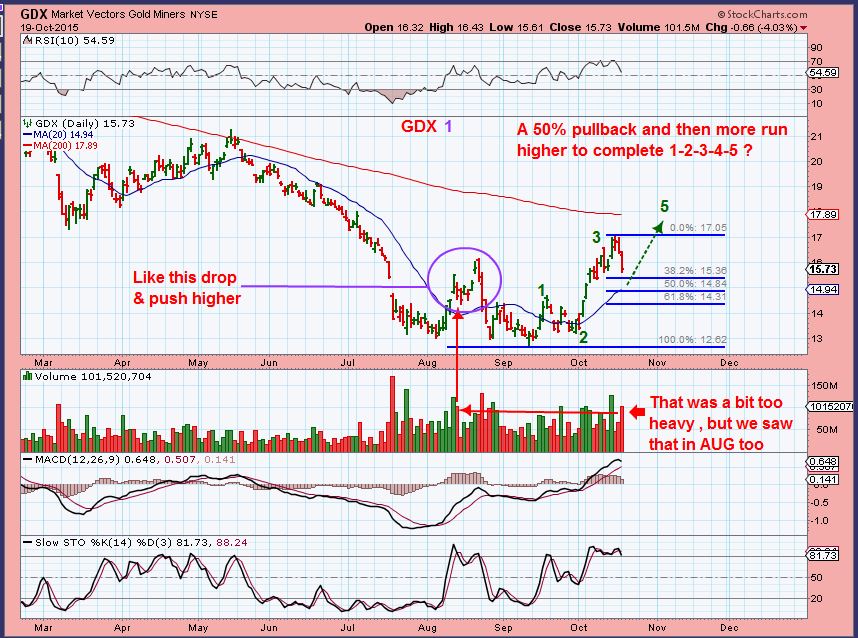
GDX – Also mixed possibilities, right? It depends on the Dollar and GOLD & SILVER. So 2 charts, one for each scenario.
This is what I basically originally thought we would see. A 1-2-3-4-5 type move higher to the 200sma. THIS could still happen if that is a bear flag on the USD and the dollar has 1 more drop. Even under those conditions, GDX is not considered a ‘buy’ for one last gasp i.m.h.o. , but if you are holding a Miner position, it is a chance to sell if GDX pops higher then and possibly buy it back lower.
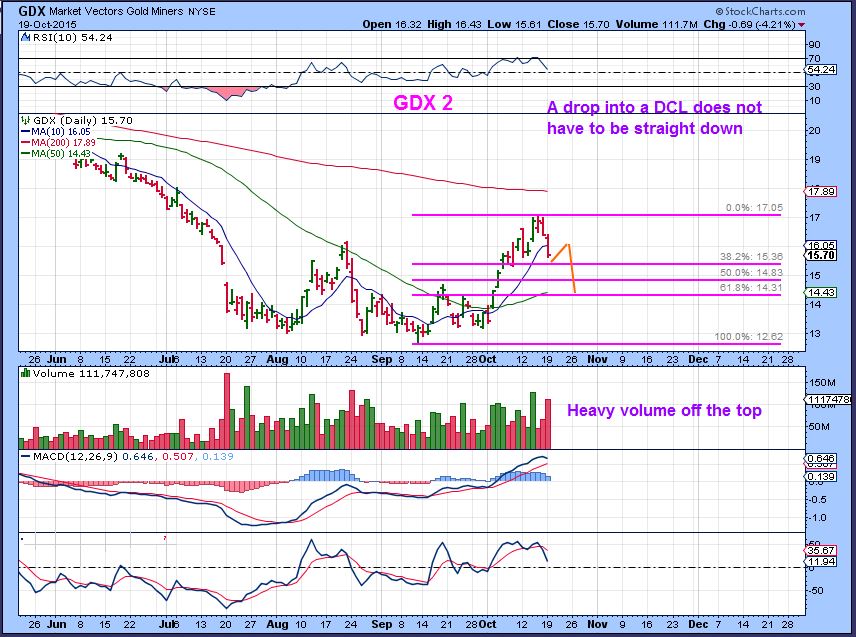
GDX – If the USD has put in its DCL, then it will rise further and Miners will drop further. I’m not sure if it will look like this or not, its just an idea of Fib levels and the 50sma, etc. We all know that when Miners want to drop, they can really drop. I do not like heavy volume off of the top.
In conclusion, the picture is a bit mixed, but it is leaning more toward the idea that the cycle for GOLD, SILVER, & the MINERS may be topping and thus dropping to a DCL. That is definitely the case if the USD has put in a DCL . Todays drop in Energy & Miners was not what I expected with last weeks set up. I thought we had a bear flag in the dollar. I also own a few Silver stocks that dropped a bit more than I would have expected (AG and PAAS). HL had a deeper drop than I would have expected too, so it does make me wonder if the dollar has put in a dcl that will keep drifting higher and dropping Metals and miners for the next several days. Honor stops.


I didnt receive an email alert for the weekend report ( Which was released Sunday night) or last nights report. We are looking into it. The auto alerts do still go out on Twitter.
Thanks. Was going to ask you about that.
Energy Recovery (ERII) up almost 200% pre-market after signing a licensing deal . I do not own it : (
SA has turned into a beautiful Miners chart
Close to a 50sma crossing above the 200sma
Why ALEX…. Listen to this link!!!
http://secure.stansberryresearch.com/our-video-update-from-seabridges-ksm-project/
Yes, they have good reserves (Not taking it out of the ground yet). I have wondered if they’d be a buy out target by Newmont or GG. Right now they cannot remove the gold ( not in production), but they own it.
You are right, I’ve heard GG will buy out one day.
Thanks for responding Alex.
Not sure what to make of things Today. I liked the daily chart of DUST. I was ready to get in, then GOLD shoots up? I thought we were just starting a new DC for the USD? If so, GOLD should drop into its next DCL. Could be just one of those days……
GDP making its move?
Breaking above that 50sma again.
Just out of interest, with Bill saying yesterday, ‘that cash is a position too’.. here is a 20day % comparison chart for gold/miners/oil/S&P/$$$/£££, to see where you might want to have been be positioned … including you too, Cas 😛
SOG, that’s great. In hindsight miners was the place to be on OCT 2nd and on. However, If your timing is off you can suffer a large draw down.
I must say, for the record, most of my assets have been languishing at the bottom, in $$$.. getting caught out cold on OCT 2nd…
$$$ were actually doing best up to that point ◔◔
Still, chin up, stiff upper lip.. always another day!
I had several posts around OCT 2
This may look familiar- OCT 2 , pointing out that ABX, NEM, and GG look ready to go higher, so GDX should go higher, and my sell signal never triggered for GDX.
https://www.chartfreak.com/2015/10/abnormal-cycles-part-2/
Think i got spooked by the previous breakout on 24th Sept.. on good volume, that just died back.. and i was expecting some further drop.
should’ve paid more attention to my indicators, which said all was still good
Understandable S.O.G., because at bottoms and lows, things get ‘untrustworthy’ in miners.
Seriously though, if we get back to the bull market, GOLD & MINERS work like clock work. They trade with much more predictable entries and we will all do great on the stairways higher. ICL’s are milder and moves higher can be very strong.
I’d like to go ahead and order one of those. Thanks.
In another note, GDP didn’t suck today. Yeah!
I remember it distinctly, I don’t even have to check your post. I remember Getting beat down day after day after day. I couldn’t understand why you were saying you didn’t get a sell signal. I think I had NUGT at $3.30 and watched it slowly go down to $2.76? Yup, I sold low.
Yes, and the report was showing wedge pattern after wedge pattern, like the one in ABX that finally broke out. ( Which would be lower lows until the break higher). And of course, with a 3x etf…Its a larger cut.
Check the post? I’ll remember every detail of this years from now. Same as Bill, just with JNUG. I guess I should have been looser with that last stop, but if this hadn’t worked out…
I have been looser with the GDP stop recently. Today I would have been stopped for the 3rd time (this is all mental) on my hard stop, instead it ends the day up 6%. Smaller position and no leverage allows a little more room than Nuggy does.
I would highly recommend buying the tops of each of these asset classes then waiting until you are sure a low is in. Then sell.
Excellent Report Alex !!!
Thanks Ken,
I released it last night and it wasn’t easy, because what I was seeing wasn’t matching what happened yesterday at all. I still had to point out the dollar looked weak and that could help a final run in Metals, but it didnt ‘feel’ that way last night. Especially owning Miners like AG and PAAS – some silver stocks took a good dive. 🙂
Agree. This morning’s pop higher in PM’s cleared it up for me to some extent though. 😉
FWIW:
Harvesting 3/4 profits on my GDX Calls with a stop below yesterday’s lows for the remainder.
GDX and Gold for that matter is in either a wave 4 abc correction down or in a final wave 5 top of 3.
Not sure at this point so I am letting the Market tell me. 🙂
“Harvesting profits” … Nice.
If oil doesn’t get it’s behind in gear I am going to be ‘realizing losses’ instead of ‘harvesting profits’…
Silver/SLV .. bear flagging? (see 30min chart)
We are working on the problem with auto email alerts, so if you just got one for todays report – it means they are likely solving the issue.
Yeah, mine finally came in about 11AM Eastern just to let you know.
SA up ???
http://secure.stansberryresearch.com/our-video-update-from-seabridges-ksm-project/
Alex,
After this morning’s action do you have a bias to one senario more than the other. i.e 5 wave up or drop to DCL in the metals?
thx
Not really , since it is only mid day. GDX could still just roll over and drop into the close and change everything.
Currently I dont see the drop in the USD that a normal bear flag can bring about. Often you see a bear flag meander higher for a couple of days and then suddenly a quick drop for the first down day ( See the past 2 bear flags in my USD chart). Today’s drop is contained and doesn’t look like the panic out of a bear flag.
That would mean maybe we only see GOLD / GDX double top tomorrow ? Then the dollar rises and Metals dip down into a DCL by the fed Wed event?
Again, it is still too early to tell conclusively .
I bought NUGT just before the close yesterday as I posted. I said I’d buy a pullback if we got one. Took long enough. Today’s report scared me straight that we didn’t necessarily have a date with the 200-day so I took the $$ and ran this afternoon. I was going to trail the stop but I was up almost 15% from entry, no reason to risk it all on one trade…
Technicals on GLD and SLV and GDXJ seem positive to me. Good MACD and RSI dailies.
I don’t see it! These items look like they are getting weaker, IMHO
I think we’re likely in the B of an ABC correction at the moment.
The up-leg channel, active since OCT2nd, was broken on Friday in GDX and yesterday in GLD/GDXJ.
A correction has to leave that channel.
We’ve had a zig, so we now wait for the zag
Chart please
hold on to your hats… chart coming up …
This for GDXJ.. you can apply same principle to GLD & GDX
Thanks for Sharing. I can see that happening.
But the $64,000,000 question is… will such a downthrust penetrate Maria’s Box?
With all the ups&downs since then, i can’t remember where the hell that was…. on GDX i think though, wasnt it?
Maria’s box was on GDX. I don’t remember exactly where. If we get such a thrust, I’m sure we’ll hear her scream.
LoLoL
perhaps it could be celebrated with an animated GIF of some sort
very quiet today.
where is she?
WORKING… lol
soon to finish?
ohhh myy .. did someone say thrust?
I made some decent money with Maria’s box today!
awesome… it is affectionately know as ‘the moneymaker’
Sorry I couldn’t stay longer – CF spooked me with the report so I jetted.
Alex.. how does this tie in with DCLs & suchlike… any correlation?
It would fit, but it may drop deeper than you have drawn ( H&S) and the 50sma may be broken as a shake out.
Many possibilities, but it could fit .
is that to equate with 4 of 5 or A-B-C completes the correction and we start over on 1 of the next count?
with all this chopping about for recent months, it really is hard to say what the overall count is.
its probably best to speak in generalities, and say that if we are still headed up, then its likely there will be another wave down beforehand (c, as shown on chart).
but if we are headed back lower, then that a & b, are more probably the 1 & 2 start of a (5,3,3) or (3,3,3) wave down to the lower trendline of the main channel.
Anybody following WTW lately?
Yes, by default …that’s all I hear in the news the past 2 days. The Oprah affect
Shocked with WMT as well. No bottom in site.
And IBM – not what it used to be anymore
WMT getting close to the 200ma on the monthly chart
Yep signing bonus of many many options. Hope she sucks it up as much as i had to to receive my options.
🙂
many charts began the 5th wave (of 1) today… ended at highs so hoping for continuation tomorrow….
5th of one? So you see these charts going much much higher! We talking GDX, GDXJ, and GOLD
here is SA .. it’s hard to tell whether it’s abc or 1-5 so here is an example of how both counts could work.
a “C” wave is equal to a 3 wave – as it has 5 waves..
https://www.tradingview.com/x/Wy33djeC/
Isn’t ABC contrarian to the previous 12345 move?
nope… since we are presumably coming off a GIANT “C” wave down- which would give us the 1-5 (bull count) impulse up
or .. if not (alternate bear count) would mean this is just an ABC correction … and we continue down.. down down down … woo hoo.. (eyes rolling)
Charts are so much easier to see. .
that looks like its on wave 3.iii
oh goodie.. i saw that once .. in another chart.. hmmm… (i sometimes don’t believe what i see)
which would meannn… it IS a 3 wave then?? (me squealing.. trying not to get toooo excited…)
well lookin at that…
1 ended circa 20th aug
2 ended circa 30th sept
3.i ended where you labelled 3
3.ii ended where you labelled 4
so now 3.iii….(which is showing much momo!)?
and obviously..
what im calling 1,2,3… could of course be just plain ol’ ABC
as you have suggested 🙂
so .. u mean like this??
https://www.tradingview.com/x/Li5aJZWA/
c’est exactement quelle i mean
teehee
channeling Xavier frenchie
so .. then you have the same/similar structure for oil/energy?
Quick glance suggests we’re in 3.ii.c
… if you know what i mean?
if its going up, that is.
if its coming down for a bottom retest, then maybe the high on OCT 9th was the end of an ABC correction… and now we are in a 3.x back to the lows
curious how your ‘c’ charted below, fits into maria’s proposition
i’m thinking the ‘c’ charted below is part of a wave 4 in the PMs , unless we are headed down.
which proposition of M’s are you referring to?
I like the look of the weekly WTI but man, the fundamentals are horribly bearish, poor seasonality based on US consumption and refining cycle.
API – crude sotcks +7.05M Barrels (OUCH!!). Consensus- +3.5M. Energy Dept stats out tomorrow at 1030 AM Eastern.
Also, OPEC mtg tomorrow but expected to be non-event. Argentina asking Saudi to stop pumping so darn much oil. Good grief, I hope they listen!!