
Gusher
The Oil and Energy Stocks were leading the way with their recent bullish activity. As pointed out yesterday, the XLE broke out from a downtrend and was probably signaling that OIL was about to follow. Quite a few of the stocks were up 20 – 30% in 1 day yesterday! We’ll discuss more about the potential here in a moment, but first lets review the rest of the market action.
SPX– Resistance is overhead. A pause below the 50 sma may be building energy to break higher, and a break above could see buyers rush in and push it higher.
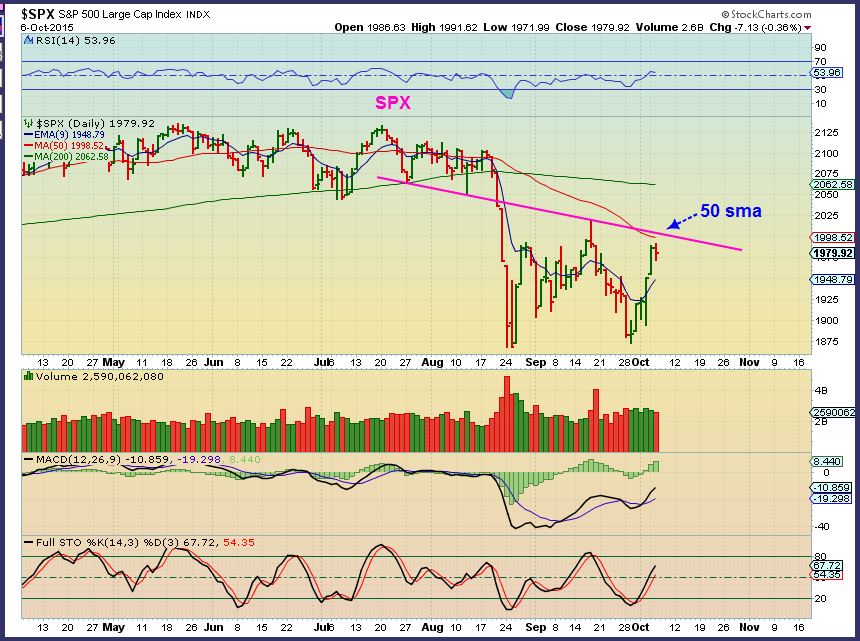
Why is it possible that this resistance wont hold it back?…
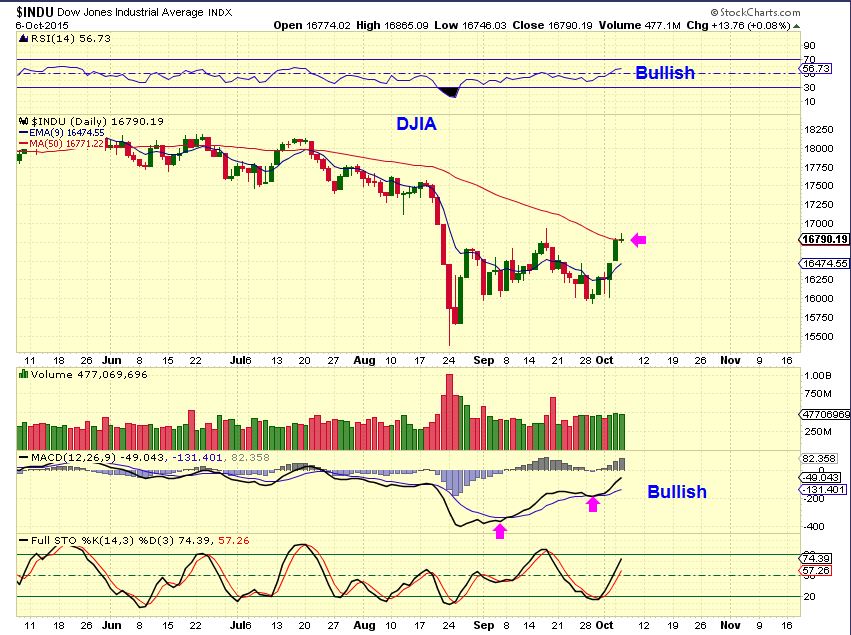
The Dow is already pushing through the 50sma and has a bullish chart set up. No weakness is seen.
NASDAQ – This seems a little slower on the uptake and has a lot of resistance over head, but the MACD is bullishly aligned too.
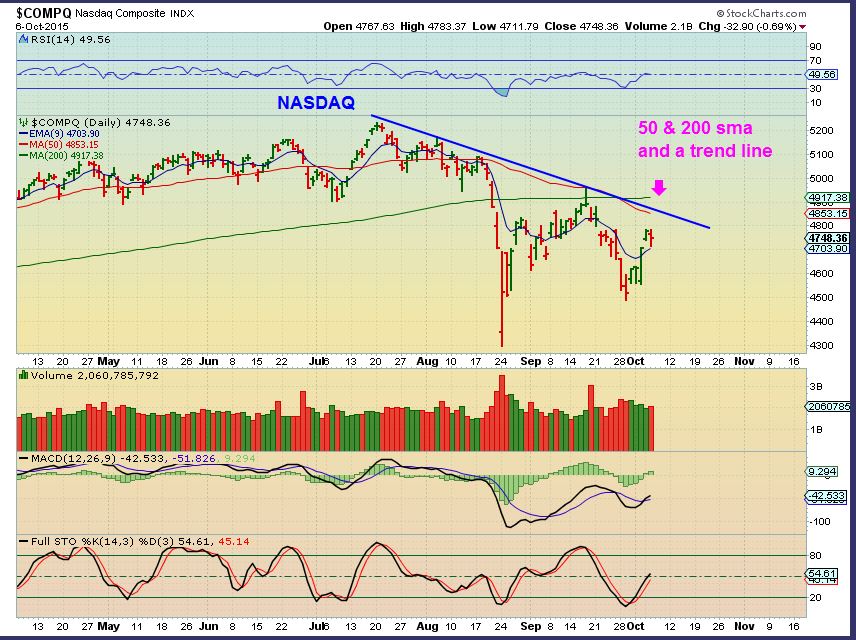
So the above charts call for caution if anyone is contemplating going short at resistance. These charts look as though they want higher price.
.
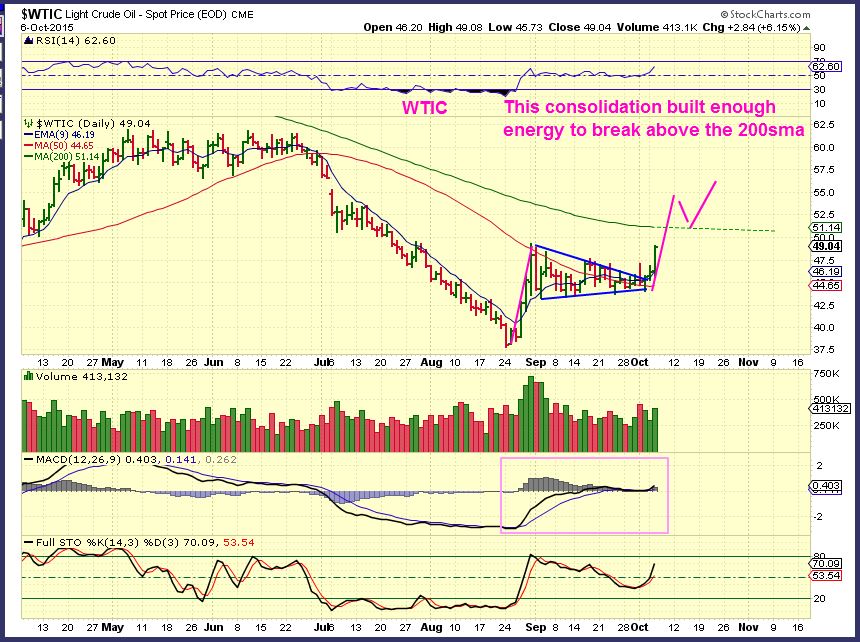
$WTIC – Oil finally broke out from that flag pattern and I believe that it has built energy to break higher, even above the 200sma. The measured move is shown.
I will discuss energy stocks again a bit more after looking at Precious Metals. Yesterday I posted charts and gave you a list that did very well.
GOLD, SILVER, & MINERS
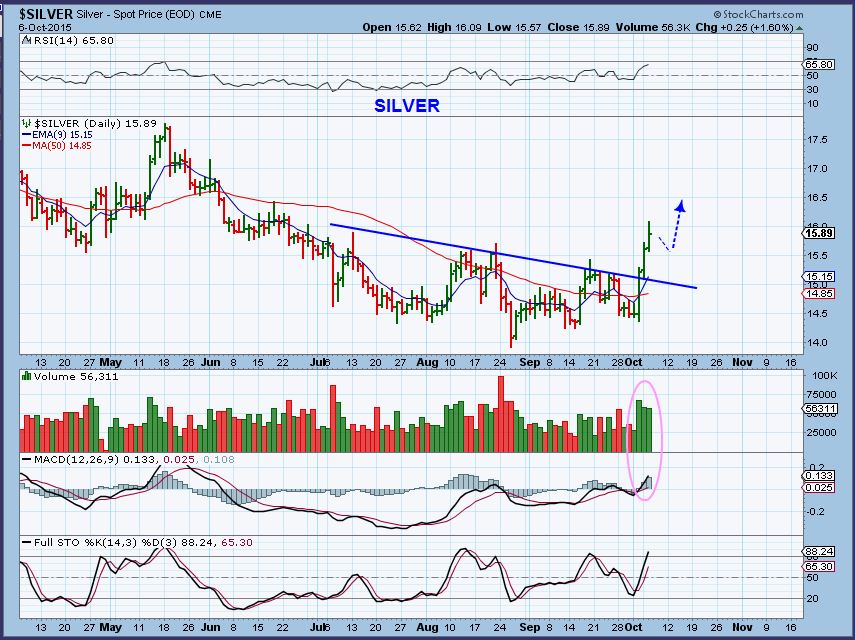
I always start with Gold, but today I want to point out something else. Many times you’ll hear that Silver & Miners lead Gold. So lets start with Silver.
SILVER – Nice break out & follow through.
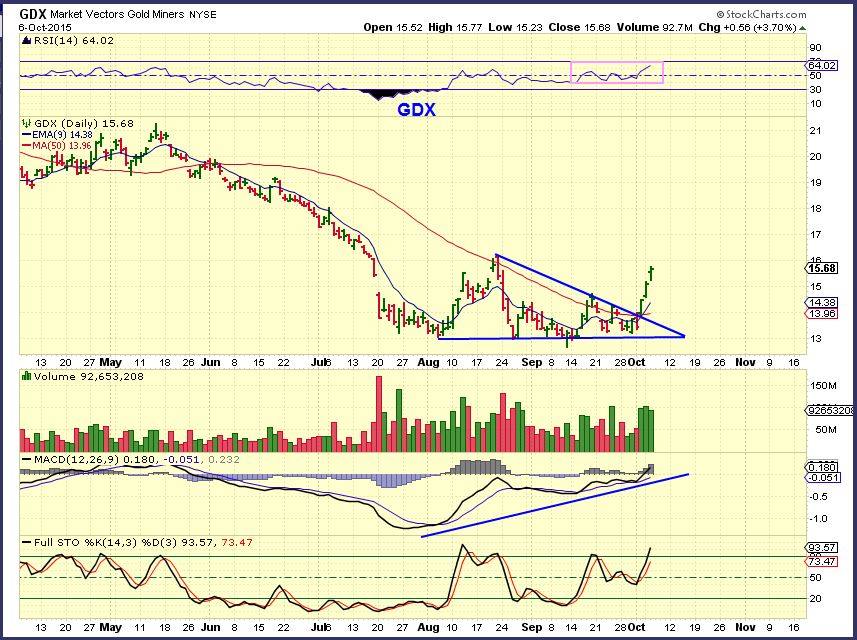
GDX – GDX broke from a triangle type base and has excellent follow through.
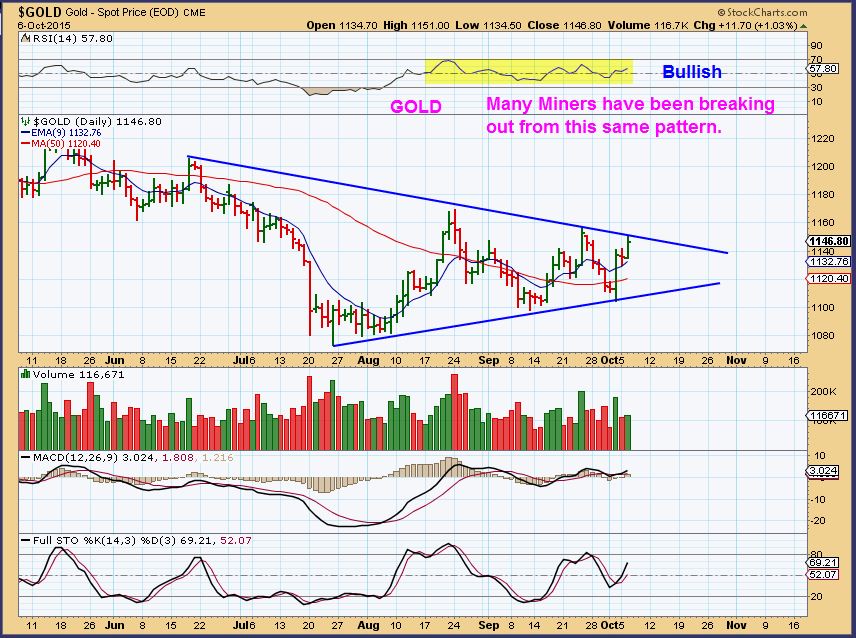
So if SILVER & MINERS (And OIL) broke out, I would expect that Gold can and will. This is a resistance area, so it needs watching.
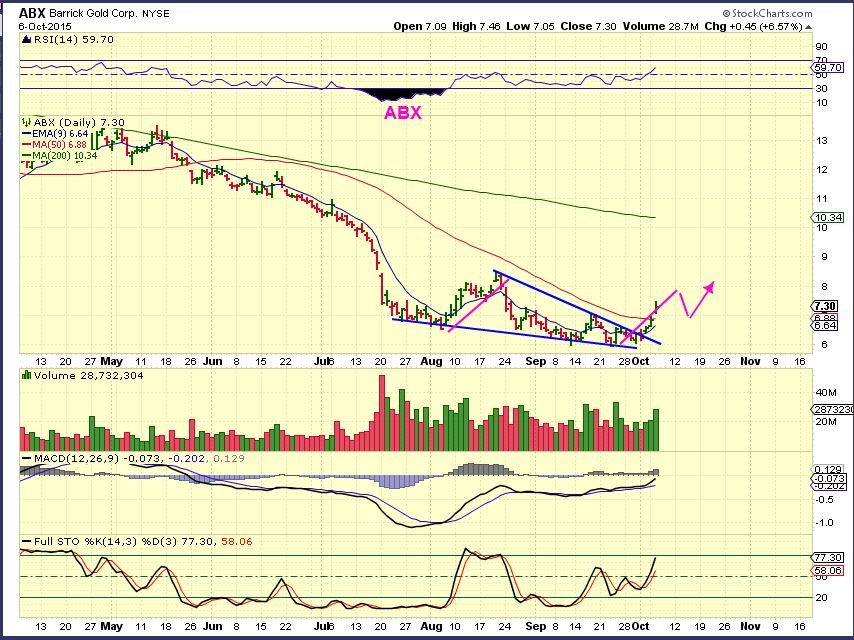
So I have pointed out many triangle type bases breaking out. Often they run the length of their starting point, as shown by the magenta lines in ABX. They can extend and run further if short covering and buying increase. If we are in a Bullish run – you would expect a pause, or pullback to test the 50sma, and then higher prices. That remains to be seen.
I mention the above because various people/traders differ when it comes to selling. Different people like to sell at different points. Some just want to scalp 5% and get out & enter another trade- repeat/repeat/repeat. Others watch price hit the B.B. and exit. Others want a target measured out. Still others just set up a trailing stop & let it remove them from the trade. I tend to give our traders here a low risk entry point and a stop below that should not get taken out- and have them sell based on experience.
Here is a guide that I use. I look at past rallies and often they run higher and along the way they pull back to the 9ema. See an example here.
2013 GDX run – I also do not sell just because price is above the B.B., because I have seen price push those limits in stronger gains. They also may just go sideways. In a 2nd daily cycle, I tend to try to at least keep riding some positions. I may start heavy & sell partially – and have a running stop a bit below the 9EMA or 10 SMA.
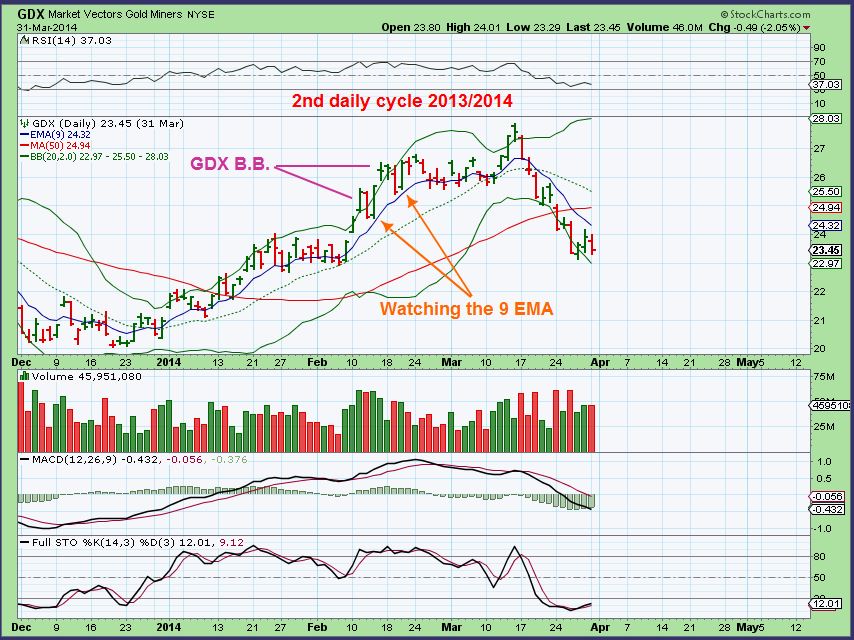
Selling is NOT easy, because we all want to sell the top tick. THAT hardly ever happens and when it does, it wasn’t skill unless your measured move ticked exactly where it should have & you got out.
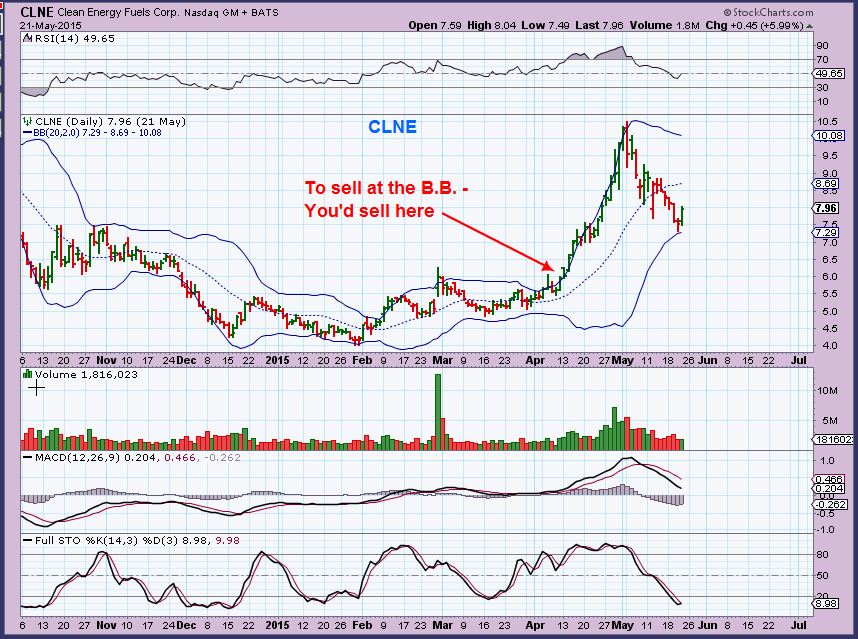
This is why I dont sell simply because price is at the B.B. – Strong moves ride the B.B. A trailing stop was best for this run.
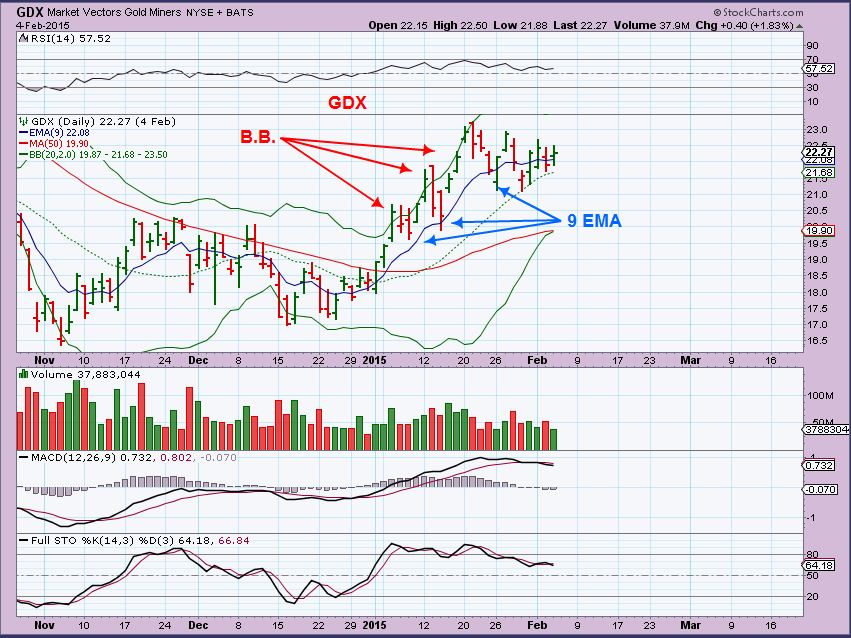
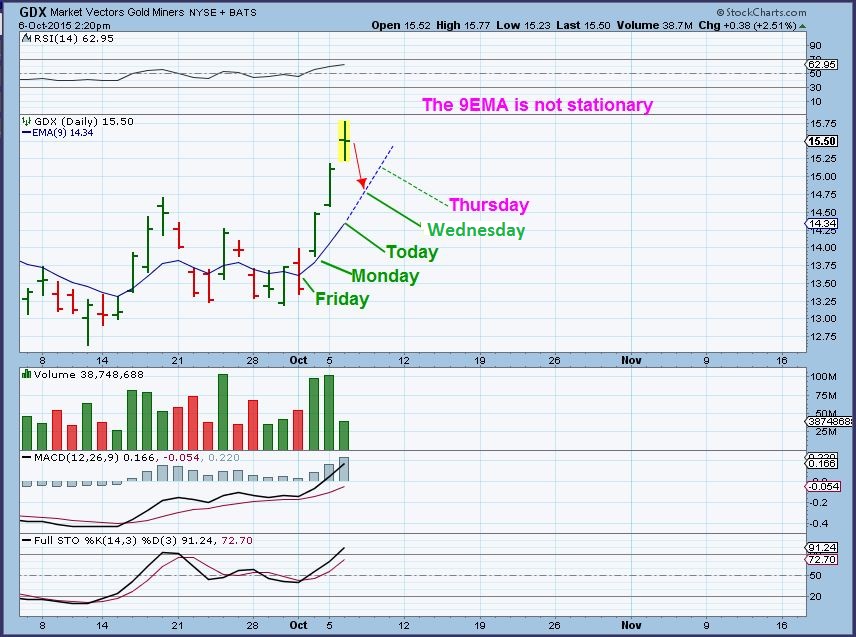
Notice that GDX in 2014 hit the B.B. and dropped back to the 9EMA area, then went higher and did it again and again. Why am I pointing this out?
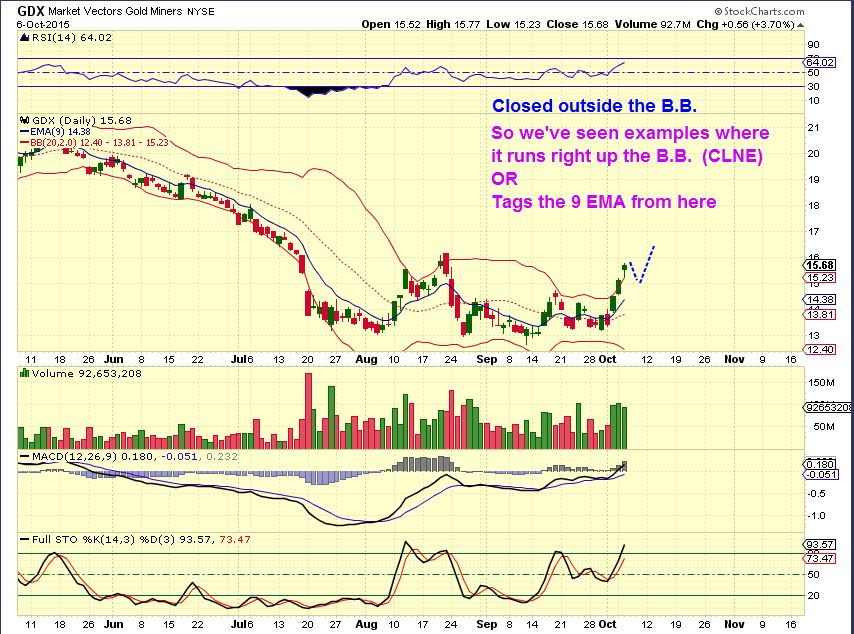
GDX is currently outside of the B.B. and some on Stocktwits were shorting Miners because it was at the B.B. If GOLD breaks out, there is that chance that the Miners run up the B.B. like we saw with CLNE.
Also I noted something in the comments yesterday and wanted to point it out here. When I say that I use the 9 EMA, someone said that it was way below price as though it is too low. It climbs every day. It will follow price higher as seen in this chart. Each day it has been jumping roughly 40 cents. When GDX pulls back, the 9 EMA will be higher.
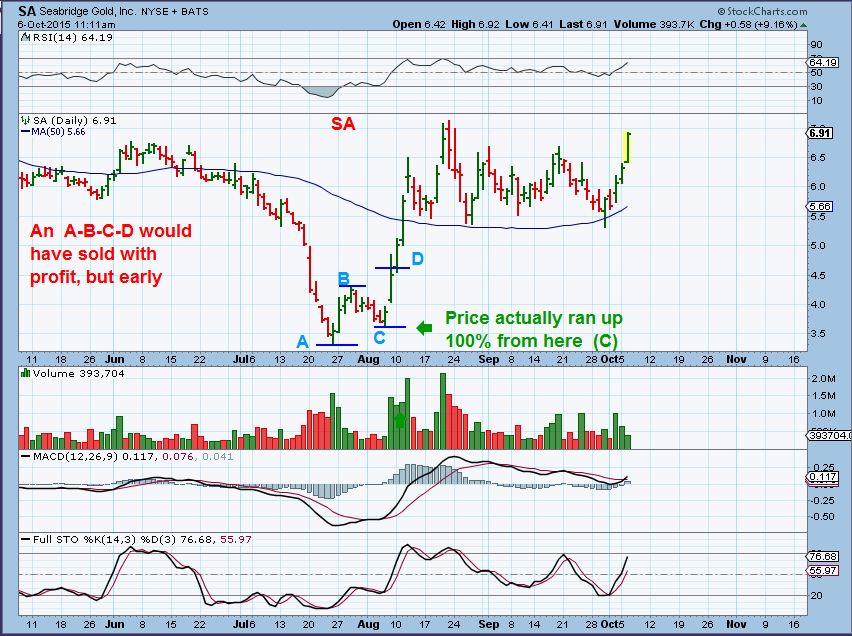
A last note on selling option. I do use measured moves to sell at times. A-B-C-D targets. You will lock in profit that way, and that is good, but in strong runs out of solid bases or sling shot type short covering rallies , you might miss the meat of a move. Shown here in the last SA run. Selling at “D” was fine, but that price had never been seen again. ( SA looks ready to break higher here too- measured move to around $8.50 – $9).
If you just want to lock in some gains? Buy the proper set up and sell the break out. Buy the next proper set up, sell the pop. You will miss the meat of many trades, but you wont give any back either.
.
So Miners and Energy stocks are running strongly. They are breaking from nice solid bases and nice set ups. Lets take a look at the action.
SGY Oct 5 – yesterday I posted this set up
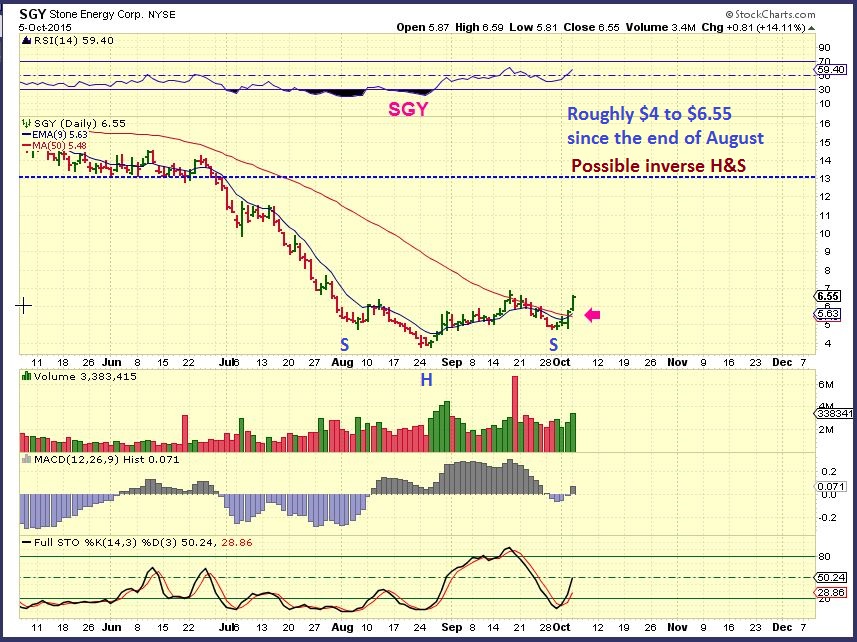
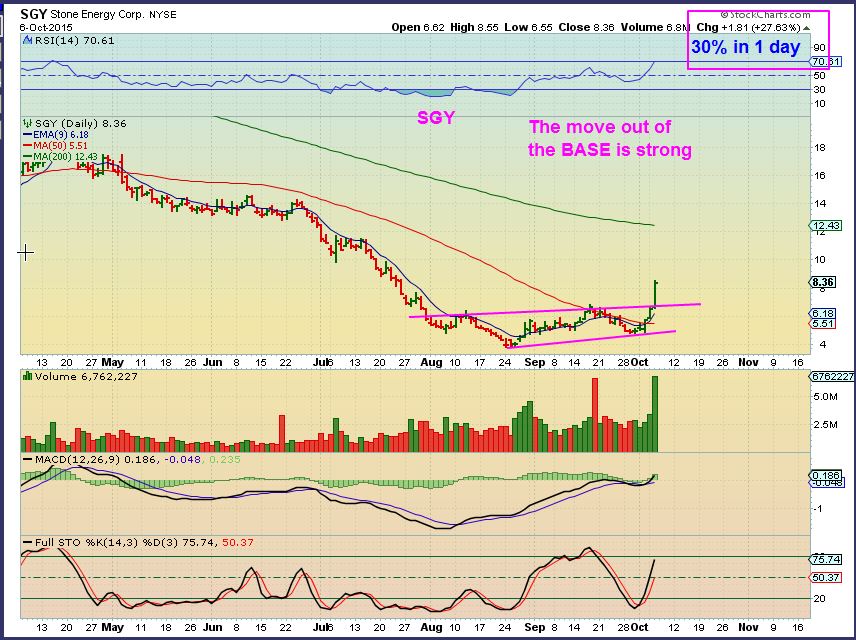
SGY Oct 6 – Pop up 30% out of that base
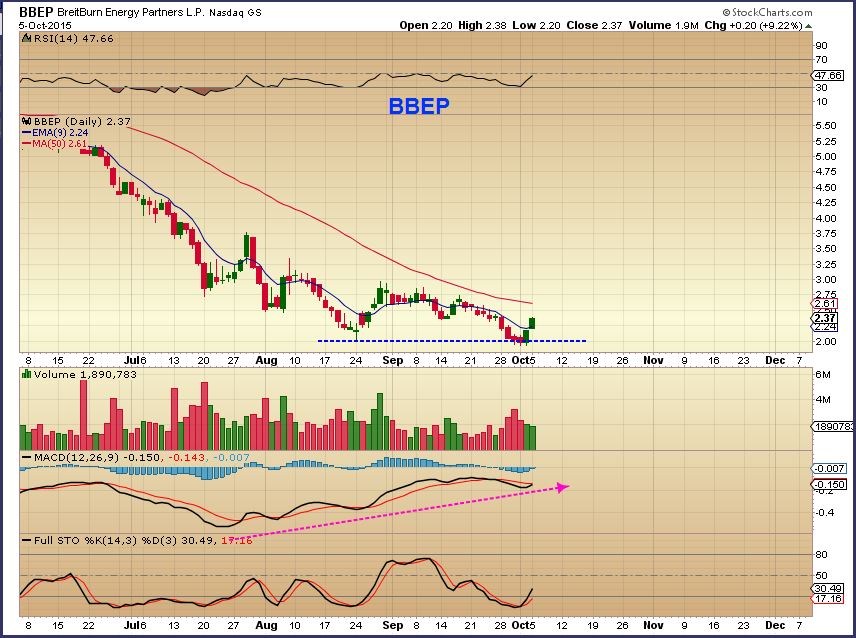
BBEP Oct 5- Double Bottom Base posted here yesterday
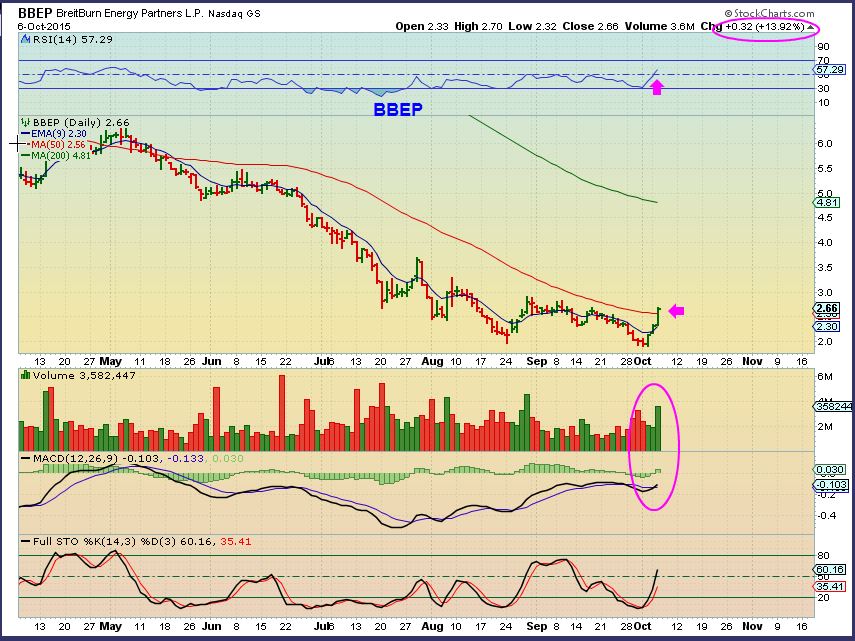
BBEP Oct 6 – Breaking out and has further to go in my opinion.
So we see these Bases breaking out sharply. We need to find stocks inside those bases with good set ups.
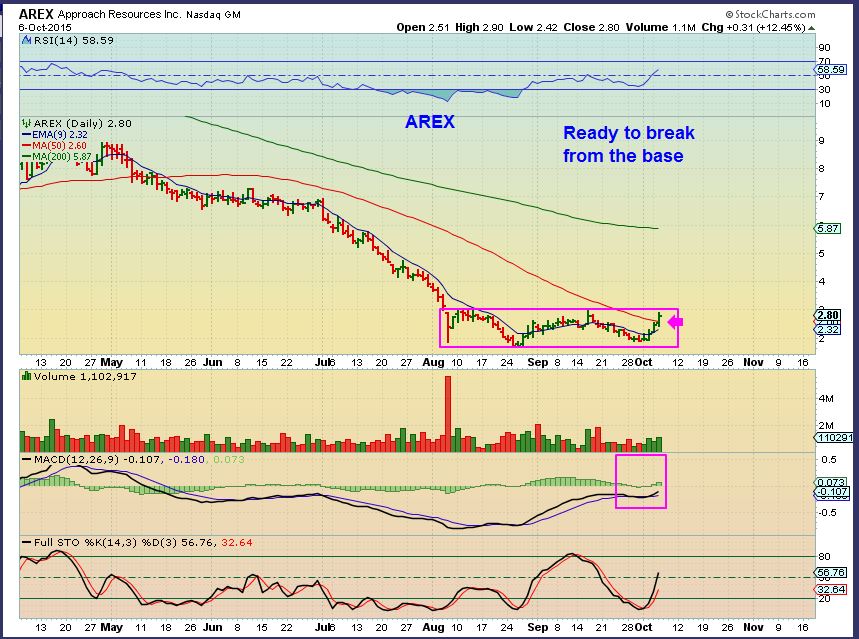
Another one that I posted yesterday is AREX, and I bought it. It didn’t POP 30%, but it did pop 12% and is still inside of it’s base, so this is currently a buy in my opinion. It broke above the 50sma.
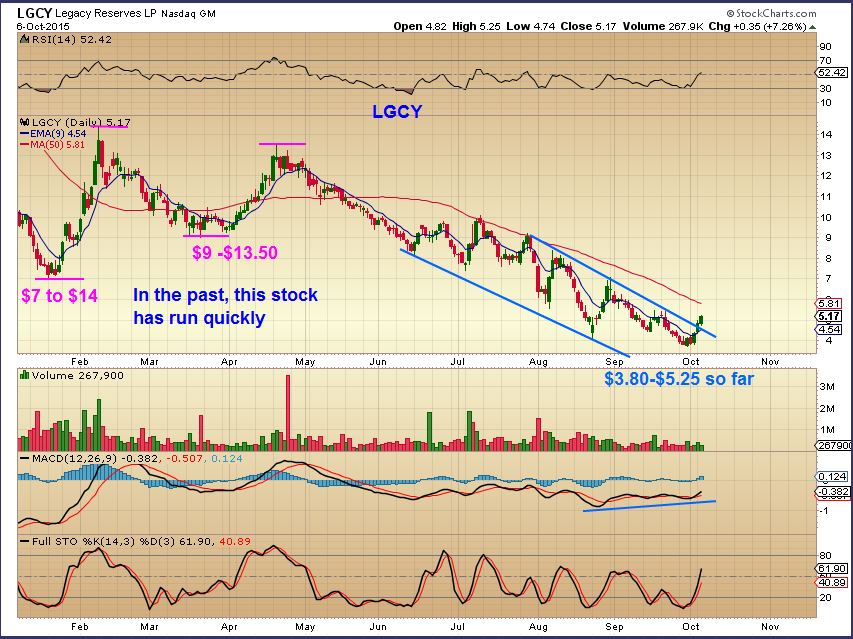
LGCY – This stock has not really taken off yet. In the past it has put in some nice runs, so I am thinking that it may play catch up. Right now I see it approaching the 50sma.
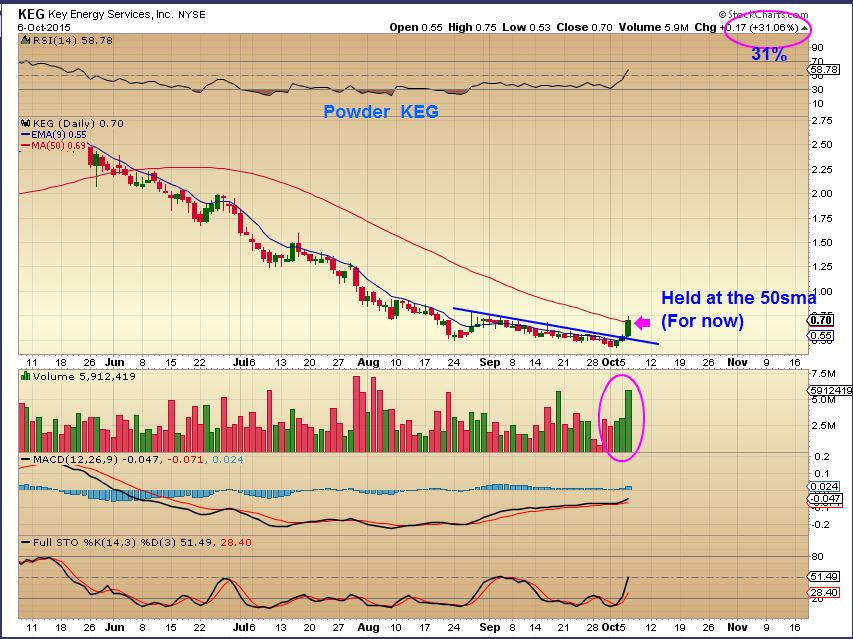
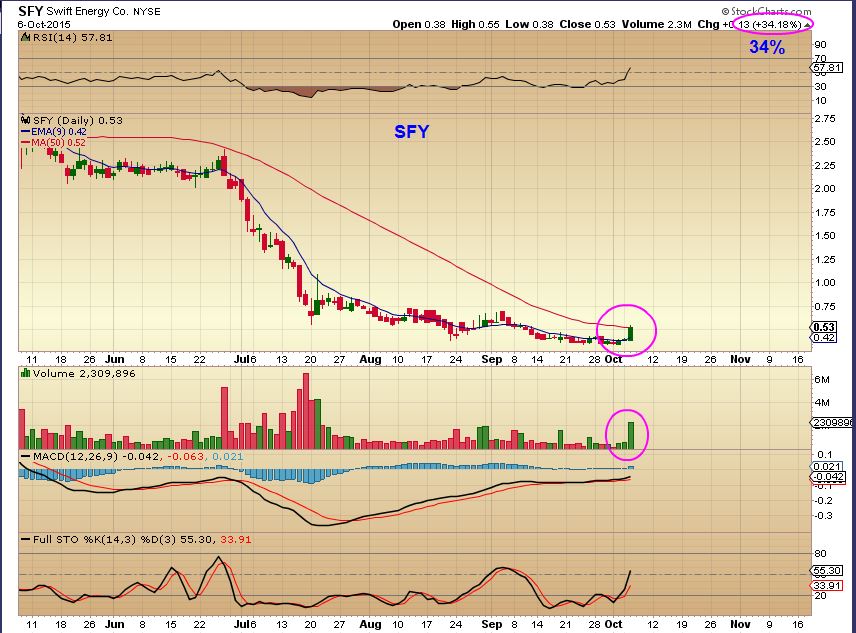
I also wanted to point out a couple of smaller, low priced stocks in this area. Look at what KEG and SFY did yesterday.Both popped over 30%.
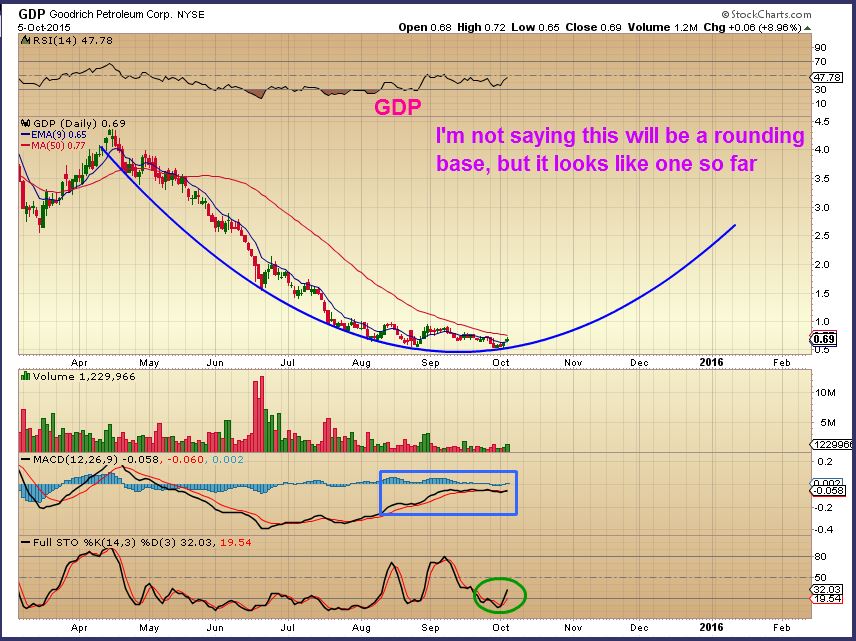
So could GDP be the next big POP? It was up 8% yesterday and the set up inside of a base and under the 50sma is there.
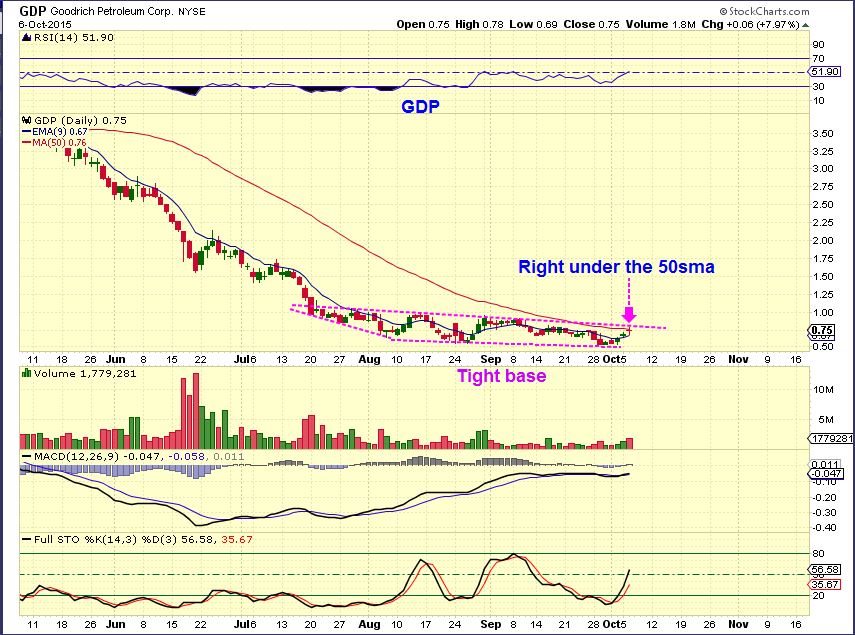
Reminder: These are LOW price stocks and must be treated as risky. Yes, I posted this as a recovery possibility story, but there is risk here too. I mention RISK as a possibility too, so we are not piling all in hoping for a home-run. That approach can be dangerous.
So let me close by adding a list of stocks that you can look up. I cannot possibly post every good set up that I see. I posted this list yesterday, and these traded very well. I will add a few more to it. Search for low risk set ups in these charts, the time is right.
WPX, CHK, XCO, LGCY, CRK ( Great move) , WG ( Huge pop) RES, CPG, KEG ( Huge pop, just starting?) , HK, EXXI ( huge pop) , REXX ( breaking out) ,AXAS, PACD, WG, GDP, QEP, CRK, SD, PQ ( ready now?) , UPL, WTI ( ready now?) , CHK ( ready now?) , AREX ( Ready now?) , SDRL (in a base,but popping now), etc
Yesterdays report is still valid, I mentioned some miners and energy stocks there and I thought that yesterdays action was proof positive.
.
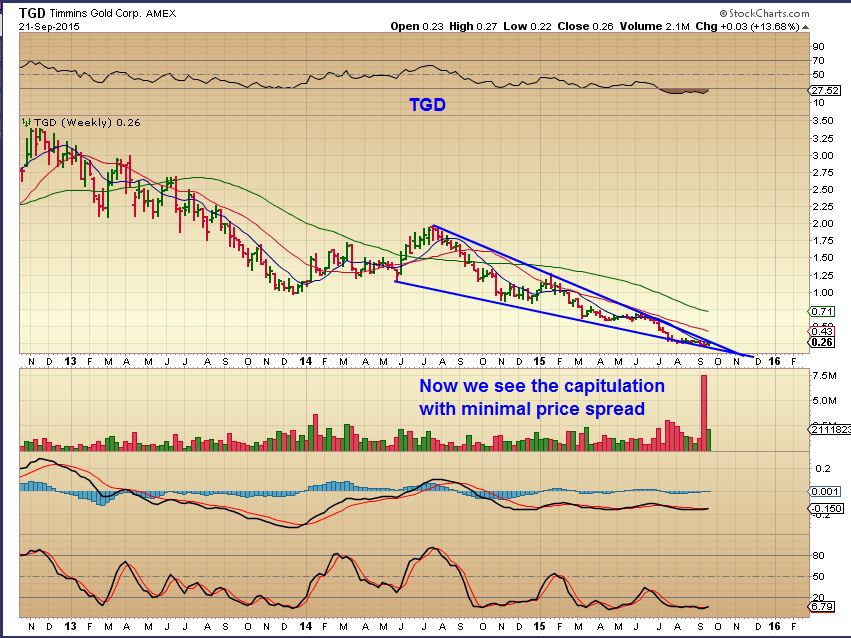
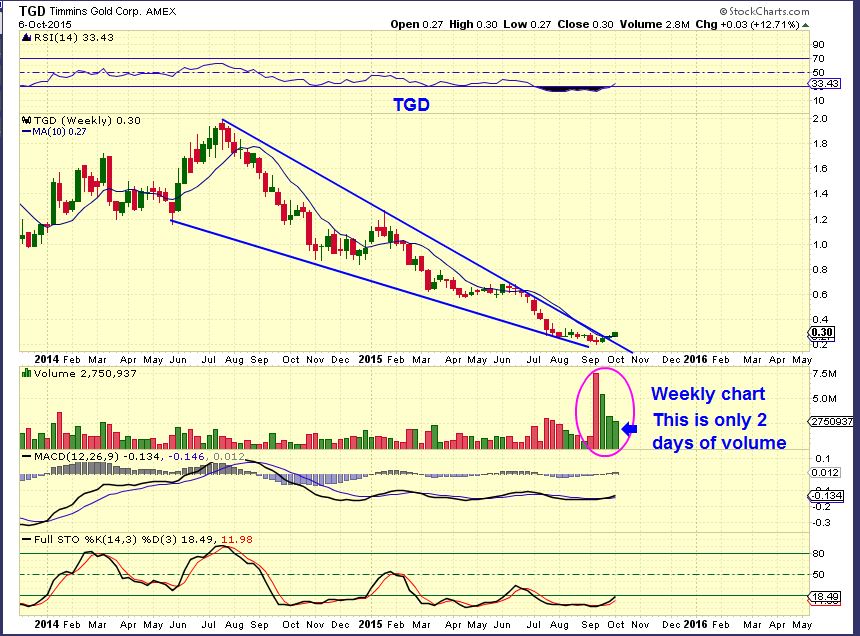
I want to close with 1 interesting development. Some call these a lottery ticket, in other words, a gamble . I pointed out the wedges in a past report, showing how they can lead to great moves over time. These descending wedges can squeeze into an apex and build up pressure to explode higher. They dont ALWAYS run & run & run, but they can. Let me show you an example.
So I also pointed out TGD Descending Wedge on the weekly chart. Huge capitulation type volume occurred , but price hardly dropped. I buy that because to me they cant seem break it down further.


Gold is right at that upper triangle trendline now and has pulled back just a bit twice overnight. Moment of truth (yet another 🙂 Of course it could also pull back one more time inside this triangle; there’s room.
Yes, and Day 18 means that it ‘could’ run out of time for a strong move.
.
I dont rule out a strong pop.. Possible scenario would be hypothetically, lets just say Gold runs higher on days 19,20,21,22,23…and then a drop into a DCL that tags that trend line later on day 32 – if we were going to see an impressive 2nd daily cycle in Gold.
EDIT: Or it just fails 🙂
I have to say I’m not ‘loving’ seeing gold apparently stuck in the mud right at TL resistance as well as the 111 ema especially with silver running hard towards the targets I have around 1650/1700. As you say Alex it could still pop and once again it highlights how tricky everything is in real time rather than with the benefit of hindsight. One thing I’m keeping a very close eye on is the 10 period ema on my silver 4 hr chart. In prior strong runs it has held this in the final rally to the top. With the 4 hr MACD now showing signs of turning over at very extended levels (same level as the big peak in May ’15) on the silver chart I would like to see that pop in gold sooner rather than later!!
Maybe some are looking at GOLDS trend line & going short.
Want some hope under that scenario? I dont want to give you false hope, but GDX just did exactly what you explained at the trend line and 50sma. Worse, it just died.
.
Refresh
.
Then the next few days said bye bye to those who went short.
An excellent point very well made Alex and if shorts were being put on at this point they would obviously be scrambling to cover if gold then ‘popped’ as GDX did! That would certainly get it fired up and likely get it playing ‘cacth up’ in double quick time!! I suspect we will know pretty soon one way or the other!!
Exactly… Its still a possible fail at this point, but there is hope that it does what GDX did with that head fake drop 🙂
Personally I’ll give it the benefit of the doubt on this particular rally while silver holds above that 10 period ema on my 4 hr chart. But once it lost that in the May and Aug rallies at least, silver quickly fell hard again. So if gold hasn’t ‘popped’ by then I expect we will be waiting for the next cycle, which would be frustrating but a feeling I suspect we all know well now!! Lol
The dollar is quietly slipping lower; now below the 200 DMA again with the 50 DMA sloping down. .
Alex, thanks a tonne!! I was going to ask you to put in a blurb about selling and you beat me to it. Awesome work!
Thanks – Selling can be tough, because various people have varying methods. All the ones that I mentioned work well, so the more people experience different methods , the better they’ll feel about their own style.
I also sell differently depending on differing environments. Using Cycles, I often sell early in a really string run, but it saves riding a sharp drop that often comes in Miners later too..
Opinions? Where’s the buy point on GDX? I think we go much higher eventually, but where to buy in now. I’m thinking around 15.00, gap fill
Bill, there’s also an unfilled gap at $14.50
I’m just following the moving 9EMA. If it doesn’t hit, I don’t buy.
anyone watching UNG?
gapped up to & paused at its hour 50sma
also SUNE gapped up on a breakout..
but looks like it may pulback here?
SDRL – Gapped well over the 50sma and dropped down to tag it.
Oil got it. Sad Face.
AREX just dropped right back down to the 50sma. I was looking to add on some back tests of the 50sma, but…
LGCY popped with a 50sma break out today, but it gave it up so far.
KEG gave it up today
BAS giving it up.
SFY, BBEP, REXX, EXXI ok so far-
SO , I am hoping that AREX holds here. I own it from yesterday.
I will have to stop out below the 10Sma or 9 Ema
I “owned” AREX today to but not any more. I’ll wait to see where it settles. Only small position but boy did it do a 180 quickly! will you be looking at price/vol or both for the buy??
Yes, the chart still looks fine, it is remaining in its base. I’m looking at these moving averages for support.
Refresh –
I also await Maria, who will come on and say …
“It looks like its still in wave 3 higher with a minor a-b-c corrective move on my 5 minute chart. Then I expect the break out of the 50sma on the continuation of wave 3 on the daily chart.” “Oh, and I’m just learning” – And then she is right.
What ever happened to KEN? He used to comment a lot on E.W. and just disappeared.
LOL! Thx for the feedback…and Maria’s thoughts as well. 🙂
Still here. 🙂
YAY KEN!!
lol chartfreak….. ohhhhh the things i would do to you if ever I saw you in person ….
wait.. that didnt sound right.. did it? LOL .. LOL ohhh Maria .. whatever will we do with you…
Well it all depends what exactly you had in mind!!! 😉 Lol
ha ha ha.. Chrissssssssss …. uBaD!
I meant smack him…
hopefully that doesnt mean anything bad like the last time.. lmao
Well it could do!! Apparently some people are into that ‘sort of thing’!! Lol
lol.. and you’re speaking from experience, naturally …. 😉
Nooo!! Definitely not my thing. Lol But apparently it works for some! I prefer more pleasant forms of entertainment! 😉 Hahahah.
Surely…based on your ‘smack’ comments shouldn’t that have been the costumed ‘cat woman’ with whip in hand!!!? 😉 LMAO
ha! i only bring her on on ‘special’ occasions… she’s a wild one.. ;o)
She looked it!!! Maybe too much for Alex to handle!! Lol 😉
… of this I have no doubt .. 😉
Hahahah 😉 😉
What the hell happened to AREX?!?!? Went to put a buy order in at 2.60 at 350p and next thing I know it’s trading at 2.85!! Was that the mother of all shakeouts or what!
When I drew the chart above for our conversation it was down 9%. I was going to add, but didnt. I was in & out all day and just got back from splitting and stacking some wood and its Green? Up 6.5%?
Wow. I wish I had added more now.
Following the fundamentals, I expected a bearish inventory report today for crude. I liked the BAS chart from today. Hit the 50 and oil got hit – gonna watch the 9EMA, currently at 4.06 below. I have a limit in to buy if we hit that will be updated nightly. I think I learned something this week…
Chillax mon… GDX APPPEARS to be just what it should be doing … in a 4 correction (If my count is right… IM JUST LEARNING) 😉
https://www.tradingview.com/x/wNCnhnOn/
Concur Maria.
Oil also in a corrective wave. IMHO.
KENNNNN :o)
yes.. annnnnnd I concur with you on oil ….
🙂
Ken, I thought you were ignoring us 🙂
NIce to have you back!
Which wave, 2 or 4? Deep or shallow
Hey Bill,
Do you feel Aug.24 was an ICL?
Hi Ken. On GDX I have the price low on 11 Sep, which differs from GDXJ I believe, which doesnt help! But wouldn’t that mean that the ICL for GDX would have to be the price low on 11 Sep? I’m not ‘up’ on cycles so not sure what if any rules would apply.
Hi Chris,
Sorry to confuse, I was referring to OIL.
Ah sorry Ken. My mistake. Ooops!
What Chris said!
Where is the OIL chart Missy Ew
(in a robotic voice) … MissyEW is busy crunching 3yrs of data for SummerSession 2016 Call for Courses … please leave a message at the tone .. beep”
Though .. here is my chart from last month.. pretty damn close if i do say so myself.. lol
https://www.tradingview.com/x/EfFuS5Ti/
That was good work. Very close on the move towards $16 and then the drop.
Heading to 16 now
why thank u CF… that actually means a lot to me… (don’t ask me why) 😉
honestly at this stage of the game, I’m seriously happy if I have the correct direction let alone taking a stab at projecting price points… i am thankful I have this forum to ‘practice’ and learn in…
Hi Maria. Wondering if your wave count also could apply to GDXJ? It didn’t make a higher high though so maybe not. Sold it yesterday and stalking a good re-entry price 🙂
Hi Alan
I will have 2 look at that tonite..I’m not trading that one..remind me though in case I forget :-/ 😡
Pennant on GDX 30 min chart. Could be getting ready to move higher.
its a risky buy here Bill.. hourly momentum is all pointy down
yeah… i still think it’s headed for my box
…the one i drew on my chart Chris.. (for “4”) …. get your mind out of the gutter… HA!
I have no idea what you mean Maria!!! 😉 lol
speaking of freaky … ;o)
look at this price action…. to the TEE … unreal .. all i did was take an exact replica of the previous 5 wave and paste it into place… unreal
https://www.tradingview.com/x/O51R4boe/
It’s crude on a 4hr chart… in case anyone is wondering..
I can’t see the top…it goes off the page..!! 🙂
spooky-ooky-kooky
Now that is freaky!! 🙂
my mind may be in the gutter,… but im looking up at the charts
i may buy if hour MACD histo crosses centre
I could be totally wrong…and probably am!…but on my 1 hour chart I see GDX in what is possibly a minror 4th wave triangle of a potentially larger 3rd wave. If that is correct then we are in the final small leg down of the triangle before a 5th minor wave up to complete that larger wave 3. Then we would be looking at a larger wave 4 correction before a final 5th up to complete a much larger wave 1 and lkely produce an intermediate top before a sizeable and longer lasting correction. Under a less bullish scenario we are not in a large impulse wave but an A-B-C which means that when that larger wave 3 is complete this particular rally phase would be over for the time being. I have silver already approaching the lower part of my target area but gold has still yet to catch a ‘bid’ and break free from that falling TL on the daily charts and the 111 ema highlighted recently. So all in all I feel a little torn on the current price action. Still hoping for that ‘pop’ in gold but feel it needs to do it sooner rather than later.
Chris, care to put all that on a chart?
Give me a few minutes. I’ll have to create one on my other system as the one I have it on I can’t work out how to post here!!
A bit of a dashed effort but hope this helps show what I’ve treid to describe above Bill?
Chris, you see us going up to 17 before a pullback. That’s a little different than Maria’s
Sorry Bill that wasn’t a price prediction but just to show my EW labeling. However, based on my daily charts and normal TA the prior peak at 16.1 must be an obvious level and if that can be surpassed I have a VERY heavy cluster of potential resistance in the 17.0/17.40 area. That would be a very attractive target for a first full blown 5 wave impulse wave up IMHO and would look to be a prime spot for a first intermediate top and larger correction phase. But that’s just me looking at a chart and speculating.
i like your labeling Chris … particularly “1 or A” etc. since we cannot tell yet if it will be an ABC or 5 wave — I just kept two charts up w/ the alternative counts… I like yours better.. much simpler. Tx ;o)
Thank you Maria. 🙂 Praise indeed coming from one of our resident EW ‘experts’! And if it’s given you an idea for your own charts even better. This is a great place for helping each other and learning from each other. 🙂 Obvioulsy like everyone else I’m sure, I really do hope it does develop into an obvious 5 wave move as it will then be a strong indication that major bear market lows could be in place. How good would that be!! If it ends up only as an A-B-C then that would be only a corrective wave up and suggest the larger trend was still down. I think we would all hate that! I have a juicy loooking target area around 17.00/17.40 and would absolutely love to see a full 5 waves develop up to there to make the first larger wave 1 up from potential bear market lows. Then watch for a larger wave 2 correction and ‘back up the truck’ to load up with some longer term investments for the start of a new long term bull market. At least that’s my hope and plan as things currently stand!! 🙂
absolutely… either way I’m happy now as a “C” is a giant 3 wave anyway…vroom vroooom!! after that, we find another to ride… yowza! (insert one of CFs bike, except I’m doing a wheelie with one hand tied behind my back.. HA!!
You’re clearly enjoying it whatever happens!! Lol I would especially love it if we have finally started a new long term bull market as I would feel comfortable then commiting some major investment capital for the longer term and sit back and relax a little!! I’m definitely more of a longer term trader/investor than short term, so tend to sit on my hands a lot while many of you seem to be jumping in and out! I can only take so much excitement!! Lol
That’s really the big deal to me now. I missed most of this (as I have stated way too many times) but confirmation of a bull trend followed by the wave 2 pullback would allow me to go in more freely than this horridly confusing bottom we recently had.
I couldn’t agree with you more Cason. But still not clear yet in the much bogger picture so more patience still required. One thing’s for sure. If/when we get more solid confirmation of major bear market lows missing the start won’t matter as the really significant longer term moves will be yet to come. 🙂
I was actually able to follow the paragraph above without the chart. Now, that’s freaky.
Only thing I could say, is most of us were considering late July as the ICL versus end of Sep, gold didn’t set a new low, but GDX undercut by about 40 cents. Would adding the 1st daily cycle into this greatly change how you had labeled?
Cason, I’m even less experienced with cycles than I am with EW! But in my simplistic approach wherever the cycles may or may not have bottomed it wouldn’t change my EW count. So I’m personally just waiting to see what develops this month and whether an ABC (still bearish medium term) or into a first larger wave 1 composed of five smaller subwaves. This would potentially be the start of the much more bullish longer term scenario we are all hoping/looking for. But ultimately the price action will dictate, so I’m just watching and waiting and if we get the five waves up, will then look to commit significant long term capital on the correction that should follow to make the larger wave 2. But that is almost certainly weeks if not months away yet. So patience is the order of the day for this specific longer term investment strategy.
Just in case this proves useful for you ‘oil riders’ I was expecting a very similar ‘impulsive’ move in oil to the bull leg to thatof 24-31 Aug once it broke free from the wedge consolidation. However, in that first bull leg we only broke back below the 30 ema on this one hour chart for a single hour on 31 Aug. This time we have dropped back below it now for getting on for 4 hours so far, so this leg is proving differnt in character. I am far from convinced about my EW labelling of the current bull leg so take that with a pinch of salt. It is possible we are just ging to retest the wedge breakout before really taking off to the upside and getting to a measured target around 55. Ideally the MACD should not cross back below 0 to keep it looking nicely bullish although a slight undercut would not be a massive issue. But maybe worth keeping a close eye on to see if support kicks back in above 46.60/46.80 and more ideally above 47.40
I hope it holds up. I started a position in crude today at afternoon lows. I am trying to be more patient. I rushed the last couple looking for instant pop; I’m giving this one more time (as I learned from miners last month 😛
I’ll post you an updated chart after Alex’s report today Cason, which hopefully might prove useful. So it will be on the next comments page rather than this one.
cup & handle forming on SUNE? .. (see 15min chart)
Keep an eye on GURE. Looks to be just starting.
AREX – Down 9% earlier, and now up over 6% with sweet volume as it starts to leave the base.
That was fun (not really)
Alex–not fun! not even close!! Also got caught in that nasty 350p buying spree just as I pressed send! 10% ramp up in a blink of an eye–litterally. Arghghh!
I know Deshy,
I bought it yesterday and I was going to add on a tag of the 9EMA or 10 SMA – and cut everything if it broke below by 15 cents or so. It almost tagged the 9 EMA and then just took off higher. I was outside when it happened, I left when it was down 9%. CRAZY
TWTR made a good move today -Thanks Alex:)
Nice move off of that 50sma…happy for you Ash!
Wow, crazy day. I bought some BBEP and GDP on their surge this morning but they gave most of it up. Some like AREX rebounded so it will be interesting if these two rebound tomorrow. I did sell 1/2 of my EOX on that weird ramp at $3.46 which was nice. 🙂
I’m looking to add some of these on any further pullback. I stayed away this morning until after the inventory report.
In other news, looked like NatGas was going to get going but the bearish oil numbers undercut it’s mojo. That was disappointing.
Fed minutes tomorrow at 2PM Eastern.
Dunno what just happened with silver taking a dump. Just games I guess. The boys must be getting desperate
Silver getting Rocked AH. Fed minutes 2PM. Might get out 9 EMA touch tomorrow on miner indexes…
A big fund must have liquidated their position for some reason.
I thought some of it might have been it breaking 16. US jumping in now also. Probably expecting hawkish minutes. Knew it would come back in, this is a bit harsh and fast.