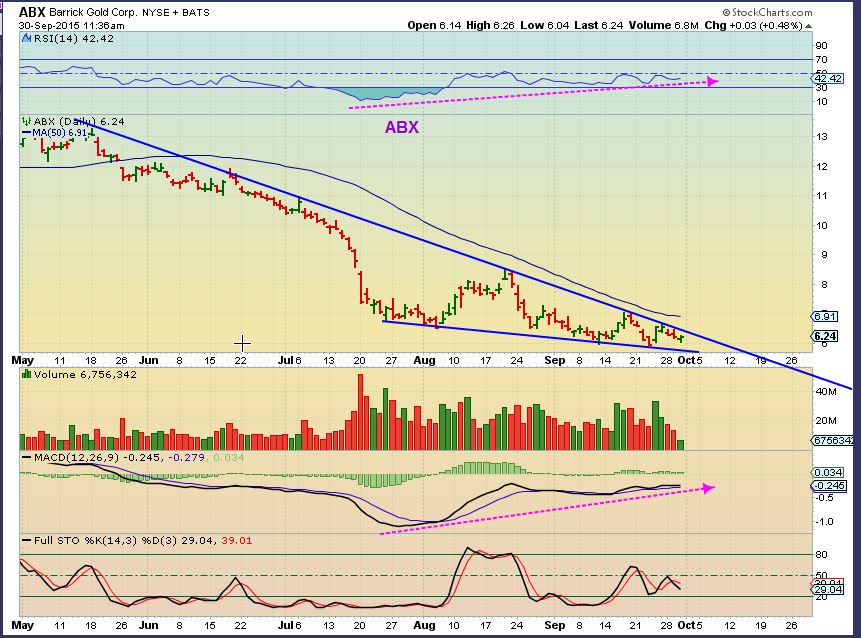
Part 2 of this mornings Gold report. I’ll start with 2 charts that I pointed out recently in premium reports and in the public post yesterday, indicating some bullishness in the miners…
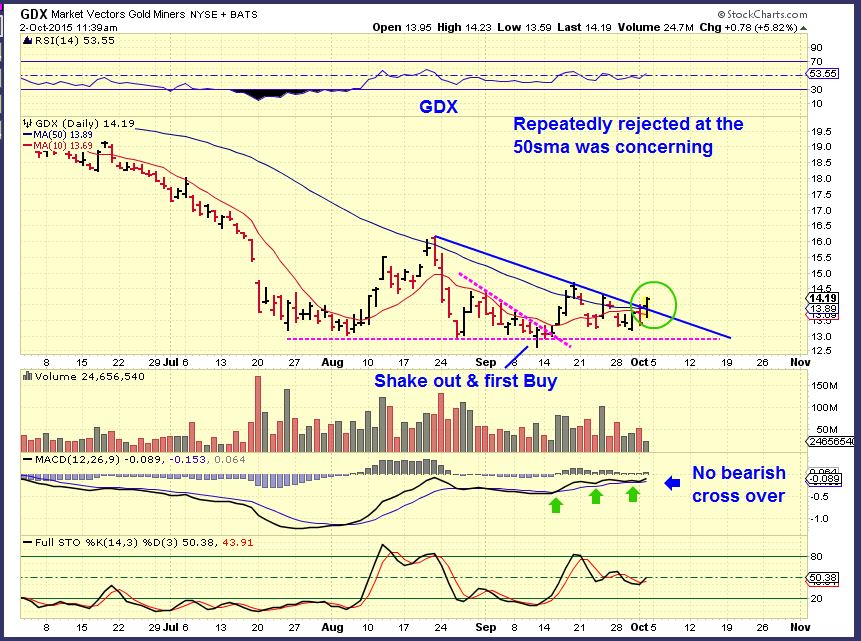
Sept 30 – GDX buy above the blue line and confirmation above the green dotted line . We are currently seeing that today ( we need to close that way)
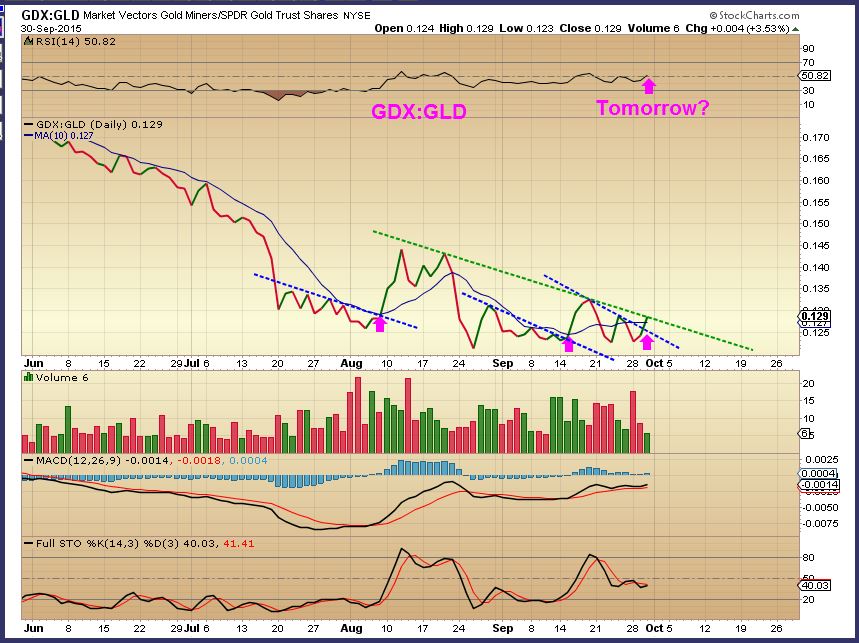
Why was this important? Using only Cycles, the volatile movement in Gold and the Miners was causing concern and looked ready to fail. While using some of the indicators that I have developed to monitor internals at the lows, I was still seeing bullishness in a number of ways and technical analysis was also leaning toward bullishness, as seen above. I dug a little deeper to try to reconcile the differences and came up with this…
As mentioned in a prior report ( and for newer members) , I did NOT get a sell signal in a very reliable indicator, even when GDX dropped to new lows. It seemed to be saying that the new lows were just a stop run.
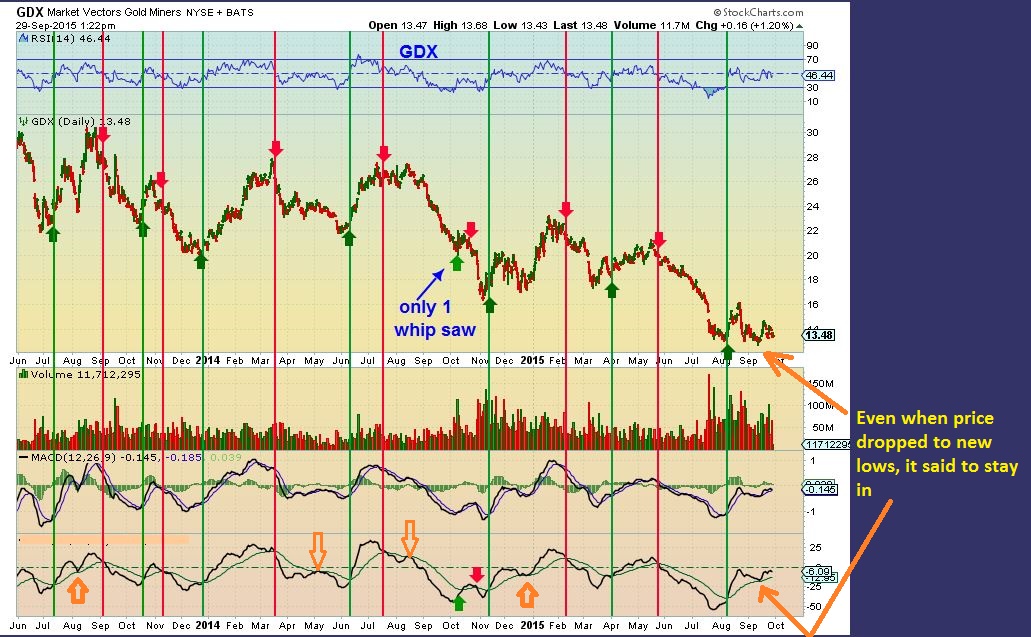
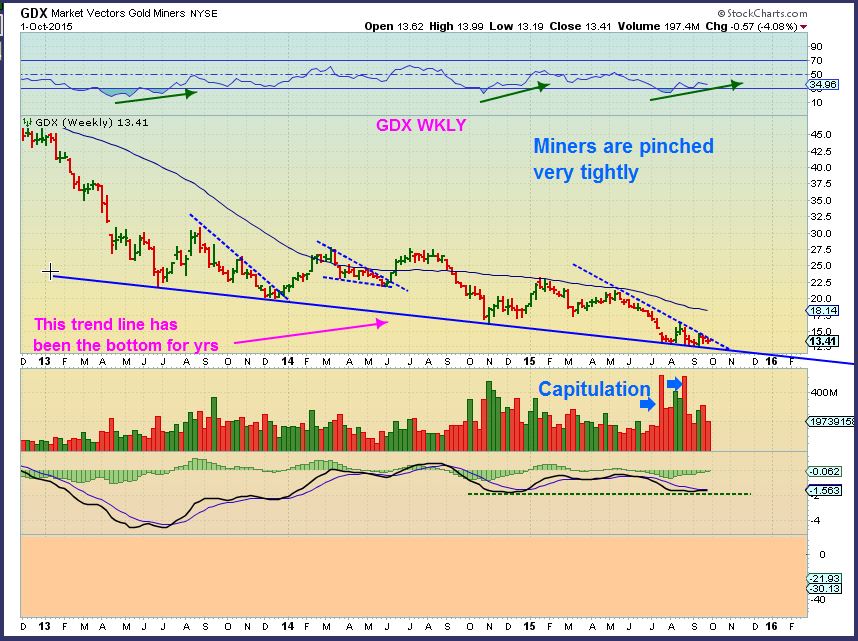
Miners were so close to the ICL support line, downside seemed limited unless we get more upside first ( or outright crash). Then I noticed that we already had strong flush type capitulation and now we are pinched tightly. That is Bullish.
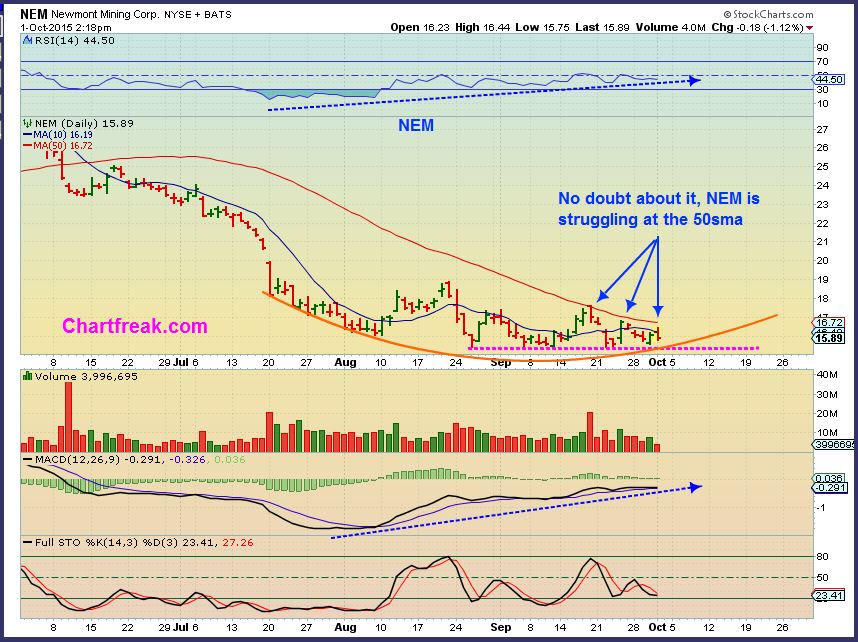
Add pieces to the puzzle: Individual Miners that make up a big part of GDX have bullish patterns too. Though failing to gain the 50sma, they did not look bearish. AEM and AU have nice set ups after consolidating, I’m watching for follow through.
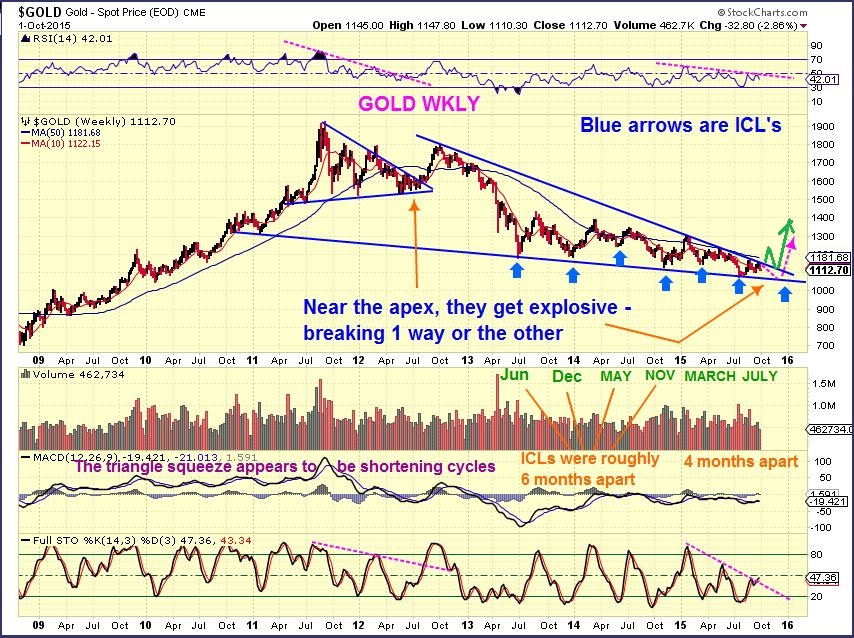
Observing Gold Cycles, I have noted in the past that Cycles seem to be getting shorter. They were consistently 6 months apart from Low to Low ( 4 daily cycles). We have seen 4 month spreads between ICLs lately, see Nov to March, March to July below. I stepped back and I draw the conclusion that this may be due to Gold being squeezed too. It is running out of room to run.
Gold could break out right here and back test on the next ICL or head to the Apex in the next ICL. If we only have a 4 month spread, Nov would be the next ICL. This may end the bear market if we break out from the wedge.
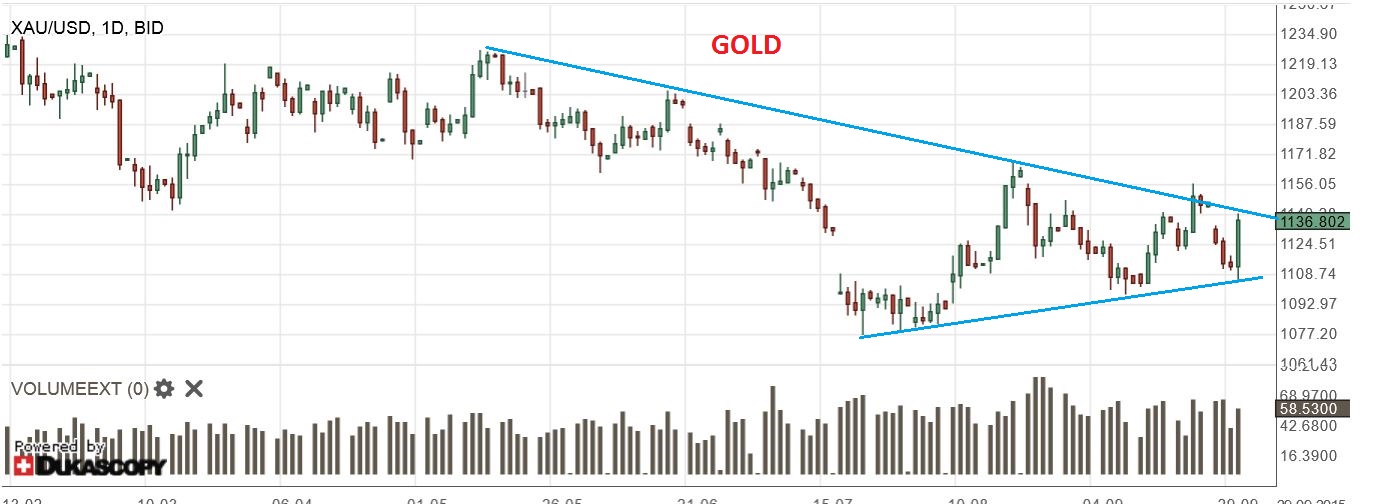
Gold currently looks strong in a smaller time frame. I am watching for a break out next week. Gold could pause for a day or two to scare out new buyers, but should break higher. It may just run strong and fast. Many are now on the sidelines with recent action.
GDX today. This is mid day. Looks like a break out and has solid volume. This could run higher quickly too, with most buyers sidelined.
This has been difficult and frustrating for all, with all of the Gaps higher and Gaps down in the A.M. With that, I am still Bullish with the action that I see in Gold and Miners. I have had buy signals in various indicators, but cycle counts are causing concern- I think they may be squeezed. The above chart in GDX is by no means broken, but because it hangs at the lows ( in a base), timing is the concern when we think of cycles. Limited time to break to new highs. Look again at the above chart. GDX could run above the Aug highs in 1 week, we know that, right? But…
Is it too late in the daily cycle at day 15? No, with a possible 33 day daily cycle expected, we could run up for 5 to 10 days and then drop into the daily cycle low. No guarantee, but the charts remain bullish looking. I have seen this before and will explain further in the weekend report. I need to end this report here, so I will further addressed abnormal cycles in our weekend report. The idea is that the cycles are usually very accurate and smooth under normal conditions, but being squeezed into the wedge and triangle patterns that I am seeing seems to be causing lack of follow through immediately. If we break higher, they could run quickly. Many are staying away from Miners due to the recent volatility. Understandable, and if these are final bear market lasting lows, you will have plenty of opportunity in the future.
GDX is again above the 50sma and so is Gold. Volume is supportive and solid, and I think GDX will close with near 100 Million in volume. I believe most have been shaken out or stopped out and will not want to re-enter, therefore we could continue running higher next week. Thats how it often works near lows. The weekend report will discuss things more in depth. Thanks for your patience with the 2 part report. I had a lot to do today and have been juggling a lot. I still recommend honoring stops if you are in, but lately the ‘gaps’ have been the difficult part to control. Maybe a partial position today and if we gap down Monday, it may be a chance to add?
Best wishes and have a great weekend.
~ALEX
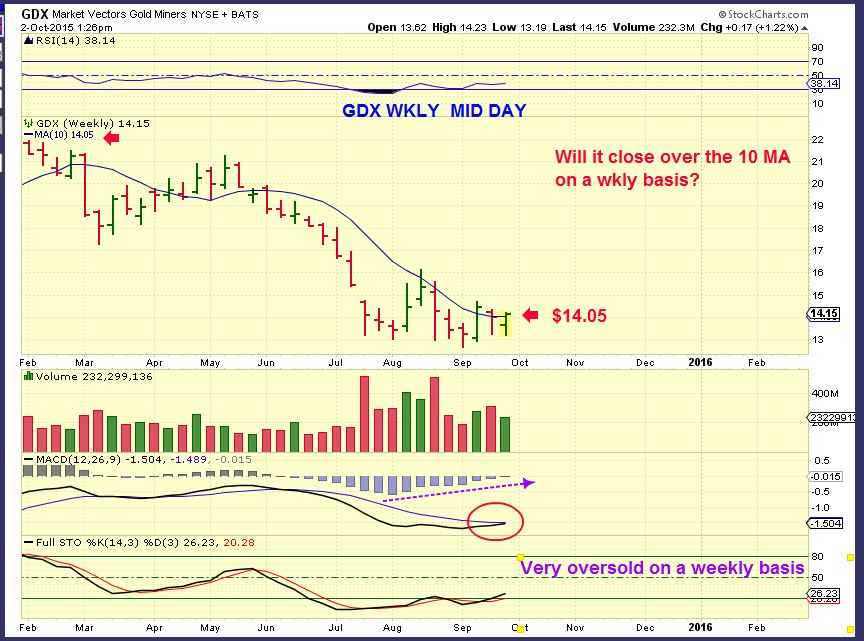
P.S. look at this weekly chart of GDX and look at your MACD. It’s a HMMM moment for me.
Abnormal Cycles 
 The Real Deal?
Scroll to top
I’ve been watching this weekly chart. The miners haven’t fallen away from the average like one would expect if they were ready to head down. The pattern looks like they are trying to build energy to break above that resistance. A close above the 10 WMA would be bullish, and a buy at the end of the day I think.
yes, thats the last chart that I put in the above report.
You’ll notice that it closed over the 10 MA 2 weeks ago and last week did a reversal that almost did too..so it’s going to take more than this chart to get people back in. They will argue “been there, done that”.
Sure is!
EGO nice today.
(refresh for chart)
Yes, Picked some up this morning at the 50 DMA
Manny – Welcome aboard and nice to have you here (in case you dint see that I wrote that earlier) . 🙂
Nice wheels, small diameter nimble.
Wondering if you might touch on silver this weekend as well. I notice how often pog seems capped, gdx responding reflectively, whereas silver can be more impulsive at worst but maybe more representative of pm sentiment, as less ‘capped’ ?
wonderful observation of IC’s since 2013. Its my focus. There is an argument, besed on world currency pricing pog that our last icl was week of aug1 making last two ic’s total of 9 monthss, leaving 2 weeks of IC time to rise to ICH out of aug 1 low.
Yes, it’s a very nimble bike – lol
And yes, I was planning on discussing Silver in the wkend report. SLV is looking great today, and I did mention in a prior report that Silver usually does VERY WELL in 2nd daily cycles, so we may see a nice move next week.
And the RSI & MACD pos divs on the monthly GDX chart are interesting as well. MACD crossed positive early last year and barely stayed there last month.
That Gold weekly chart was a masterpiece!
XOM massive Nov calls volume. Buy BUY BUY
You did not mention NGD once today…I was shocked 😉
XOM does look pretty good here.
:0))))) that’s funny.
I mentioned getting long NGD again on Thursday. (for a nice pop yesterday)
Holy crap was that a reversal. And something really strange happened. My positions all turned green for once (it has been awhile!). Too bad I missed the move in miners but simply burned too often to put my hand back on the stove right now.
Alex, maybe energy is getting fired up again? Check out the reversal in BAS, stop run to new 52 week lows then closed up 6.5%. GDP and REXX up 13%+. Remeber S&P was down 30 points and oil opened lower as well. Any thoughts that may gas could have put in lows today as well? Not a very glamorous reversal but didn’t make new low. I got around to reading yest inventory report, actually wasn’t bearish but gas was punished none the less. Have a good weekend, and make sure you get your tires fixed before you go for a ride!
The square tires represented a bumpy ride on the cycles ( I loved that bike picture 🙂
Energy looks good again, I watched some of the stocks reverse too like REXX, LGCY and check out XLE, we can look for follow through in OIL next week to see if the stocks are leading. Oil remained neutral.
It sure was a bumpy ride!! I keep falling off the bike. Energy ready for a spin?
( :-o) Thank you alex for keeping me along with so many others thinking.
Thx Beek,
For being here at chartfreak
NGD, one of our favorite junior miners!!!
(refresh for chart)