
Pulling The Trigger
Many times we hear about buying the pullback, but when the pullback comes, it may be too intimidating to pull the trigger. Did you do any buying yesterday? Lets review the market action and also discuss “Pulling The Trigger”.
.
SPX – The Spx has turned back down at resistance and has been rejected at the 10sma too. Wednesday the markets reversed back up to the 10 sma. This time it may be able to push higher.
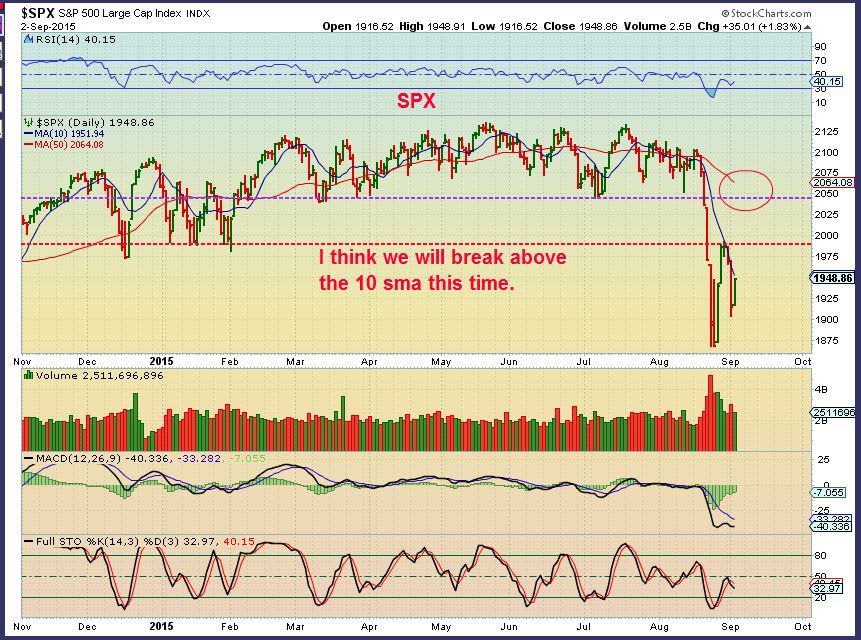
Let me just say that I expect a ‘bounce’, not a full recovery. Deep down I think that it could even last long enough to encourage the BULLS to think that nothing has changed. “FED FUNDS FOREVER!” I’ll watch things step by step for now. Some major changes might be taking place with commodities, as mentioned in prior reports. Time will tell.

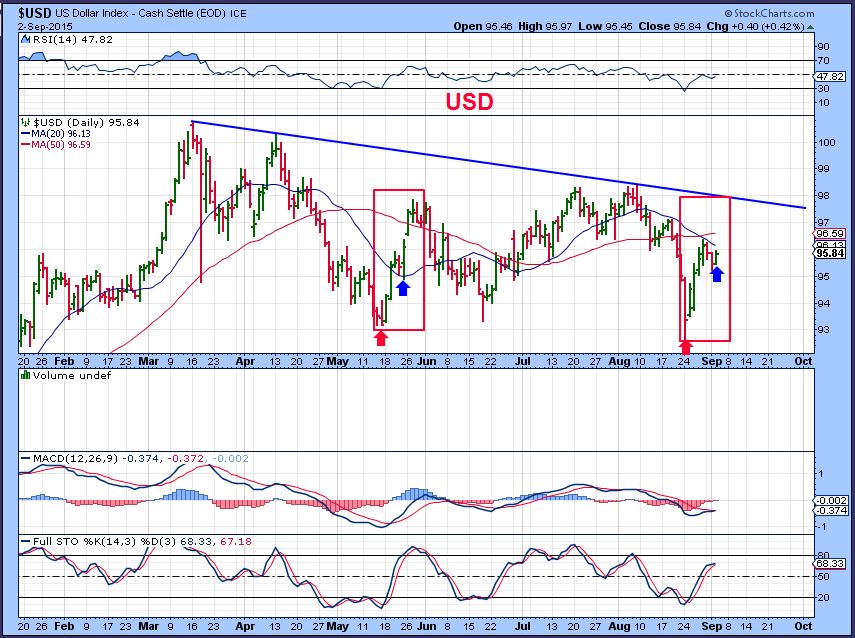
USD – I am still comparing it to the May run when I saw signs of weakness. We’ll see if there is any follow through for the $USD. Still looks weak to me.
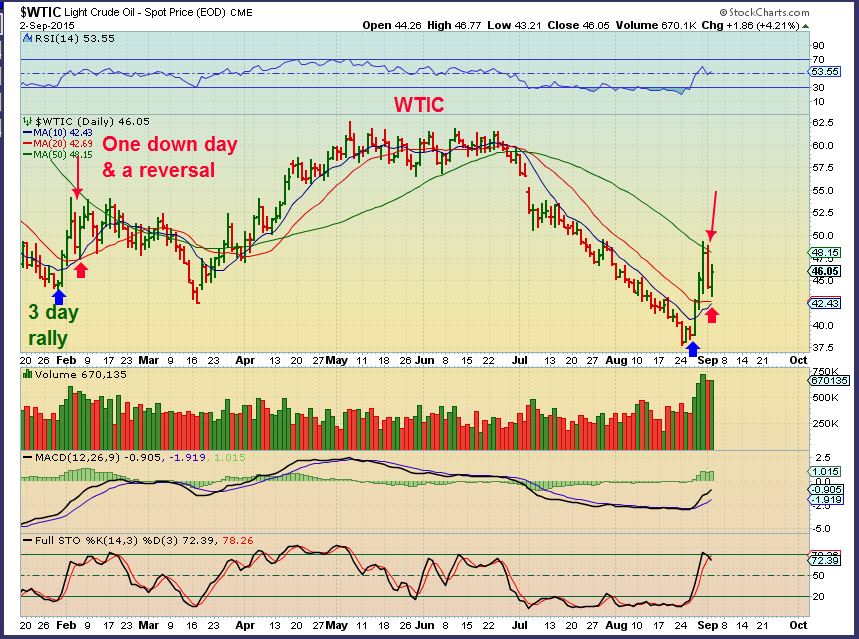
WTIC – Yesterday I pointed out this pattern in the Oil chart. Last Feb we had a 3 day run hugher, and a 1 day drop near the 20sma, followed by a reversal.
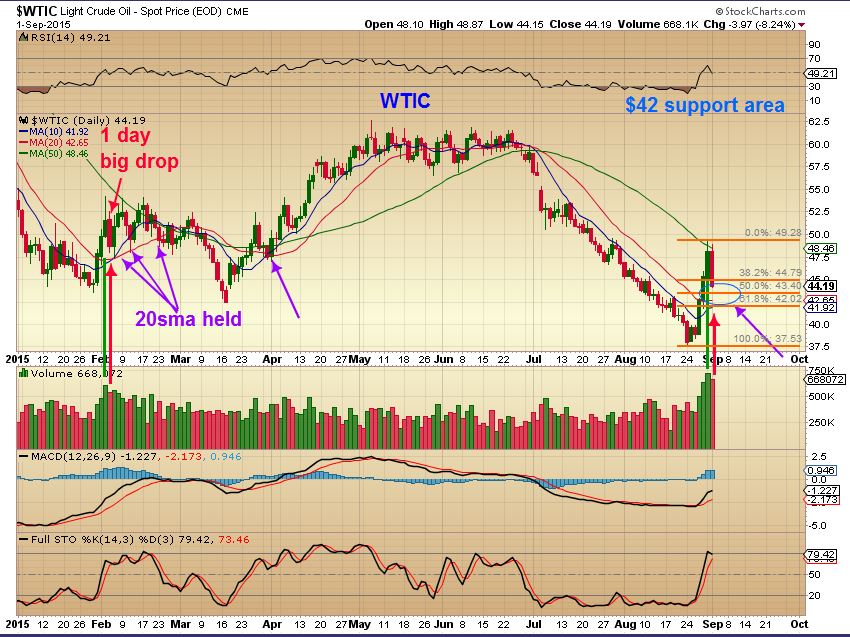
WTIC – Very similar. We then chopped around higher for a bit. I will add some Energy thoughts at the end of the report.
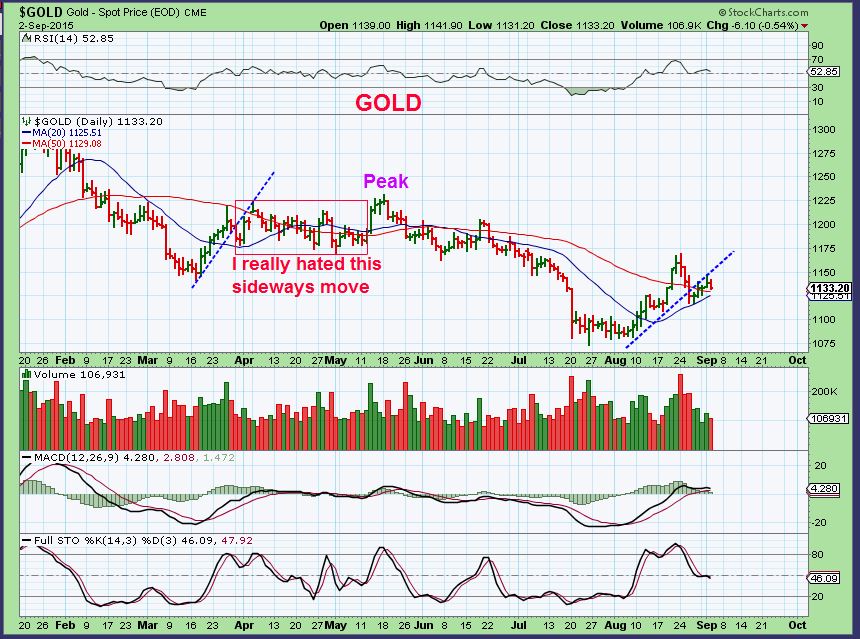
GOLD – This chart shows that in CYCLE timing, we could drop into a Daily Cycle low and still be fine. Gold has been dealing with the 10 SMA overhead and hasn’t closed above it.
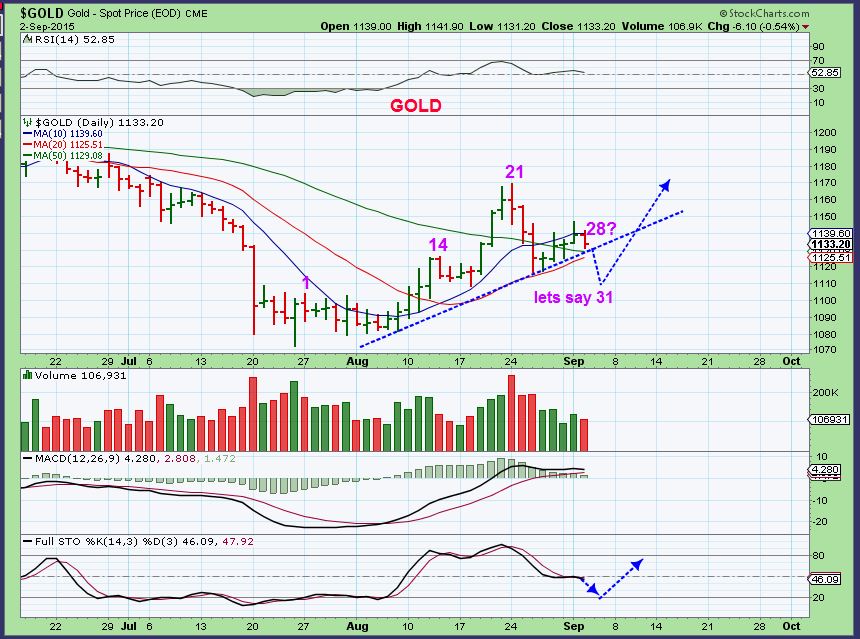
GOLD – I wanted to point this view out too. Look back at March,April, & May. It shows how grueling this could be for traders if it plays out anything like golds cycle in March. See that RED BOX of sideways movement? What if we just did that again? UGH 
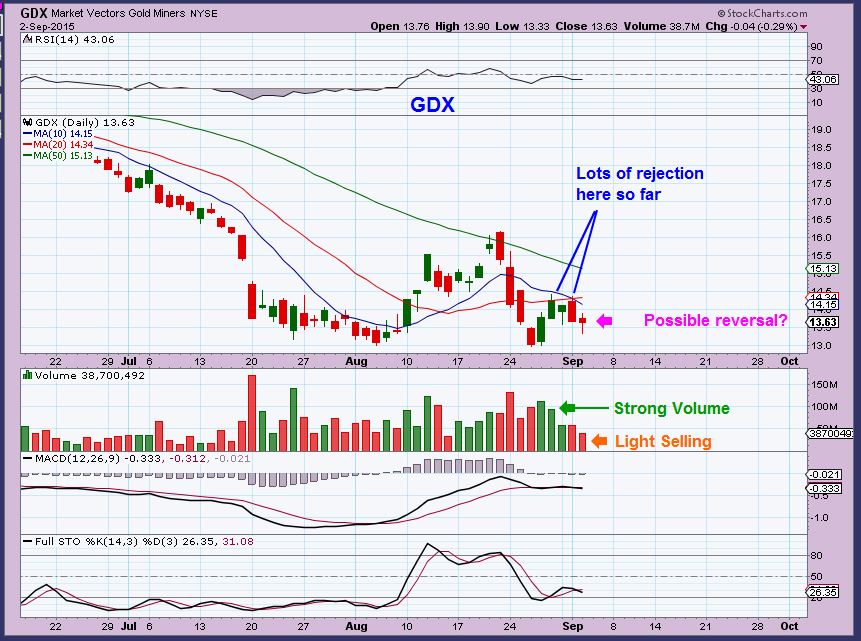
GDX – GDX has been struggling. Today we had a reversal candle and selling was light. We’ll see if we can get that push higher above the 10sma that we need for confidence in a higher 2nd run higher. We need a strong volume push higher.
So before we close, the Theme of this report was “Pulling The Trigger”. How many times we do we see stocks just take off and run higher and we say , “I wish I owned that!” Going one step further, we say , ” I hope we get a pullback! I will buy that pullback!” Then when it pulls back, we might say , ” I dont know if I should pull the trigger. Is this the start of a sell off? How do I know that this wont roll over?” Has that ever happened? That is why we look for a low risk entry and place our stop underneath. The best entry is not when its running higher, it is when it falls to probable support. Trading is about ‘probabilities’, not guarantees. The guarantee is your stop. It guarantees that your losses will be limited, while your gains could be impressive (based on the first run higher).
Lets review a few Energy stocks that you may have bought Wednesday, or that you may be able to buy Thursday if we linger at these price levels.
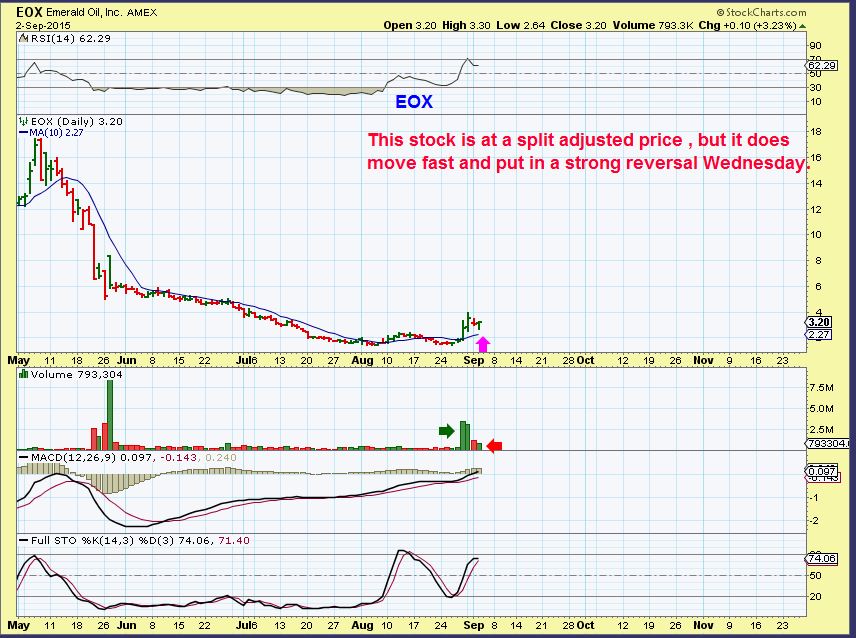
This was the fast moving EOX Sept 1. I wrote that one should look for the pullback to support, the 50sma.
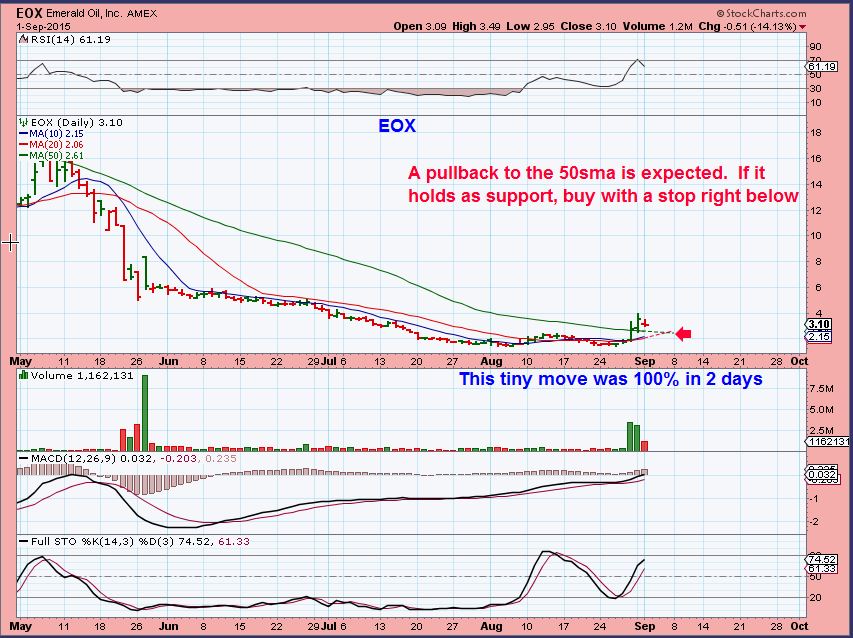
EOX- A pullback & reversal happened today. It dropped right to the 50sma & reversed. That may be it or it could still move to the 10sma shown.
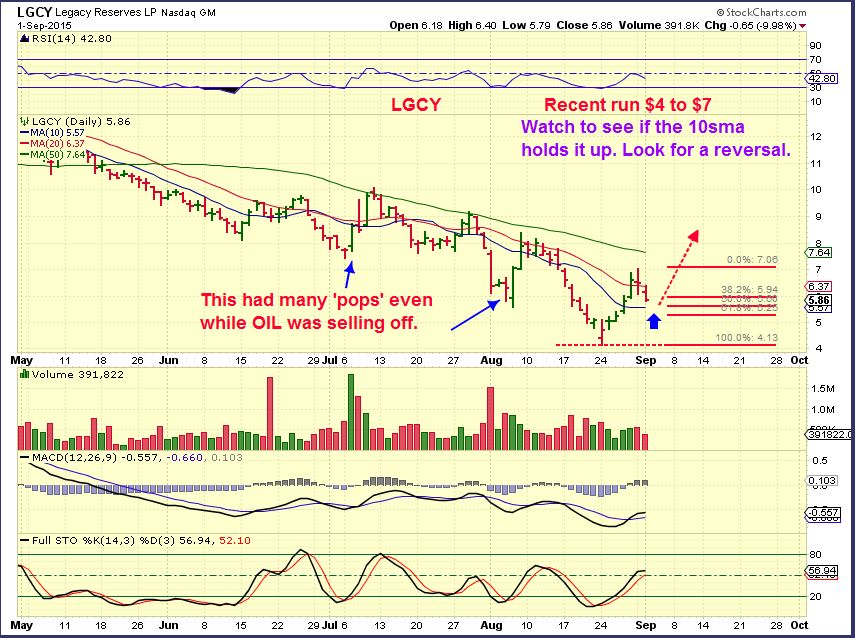
LGCY – I showed this and the 10sma was at $5.57. That would be the buy.
LGCY – The 10 sma was tagged and price reversed at $5.55, moving almost 40 cents higher. Did anyone pull the trigger? 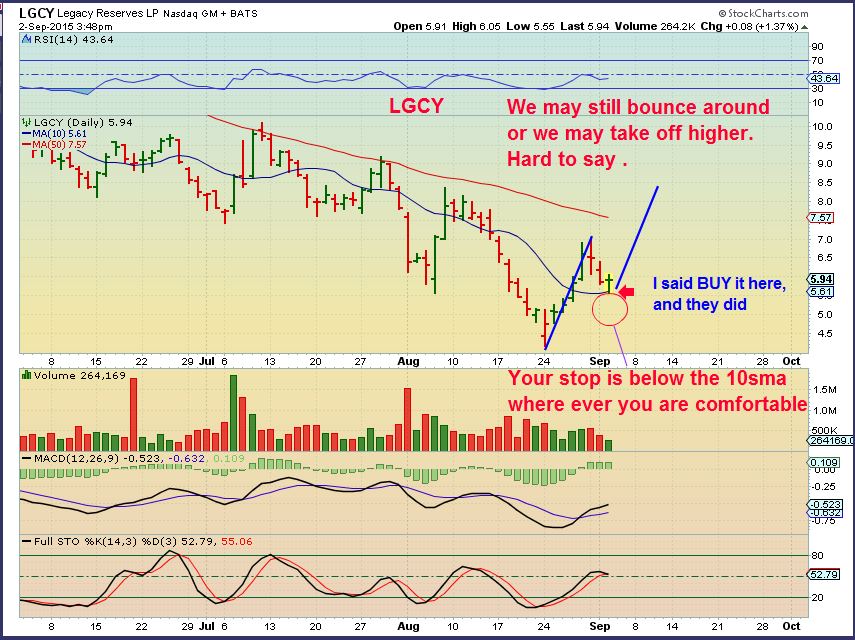
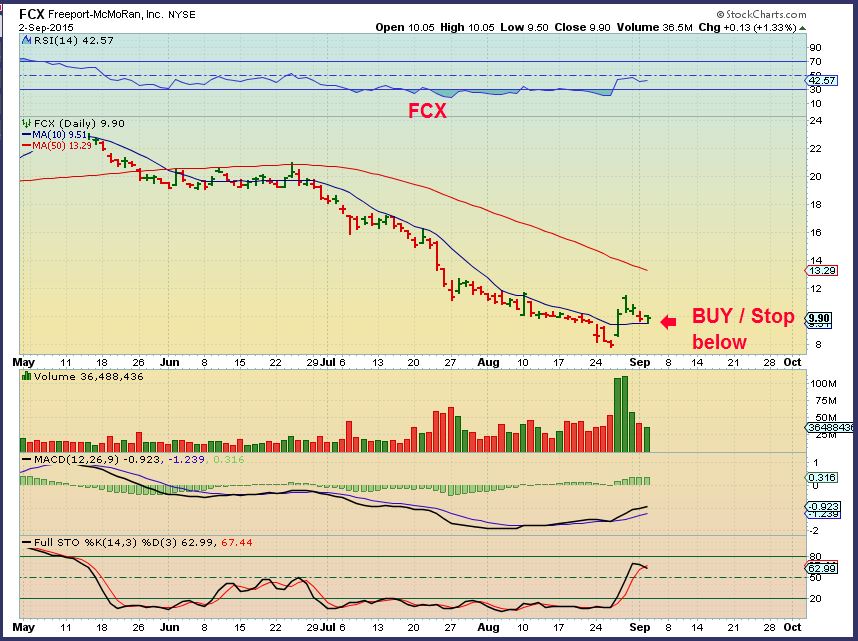
FCX – Remember this one posted here? Please excuse the typo.
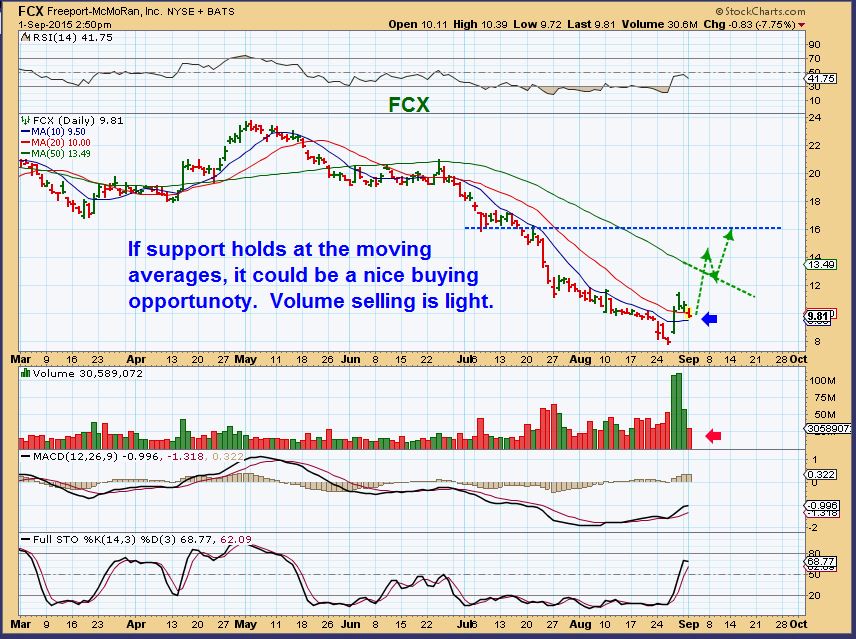
FCX Wednesday- This could still be bought tomorrow, and the stop goes under the 10sma ( I recommend loosely, determine what your loss tolerance would be , based on position size). This could run to the 50sma minimum.
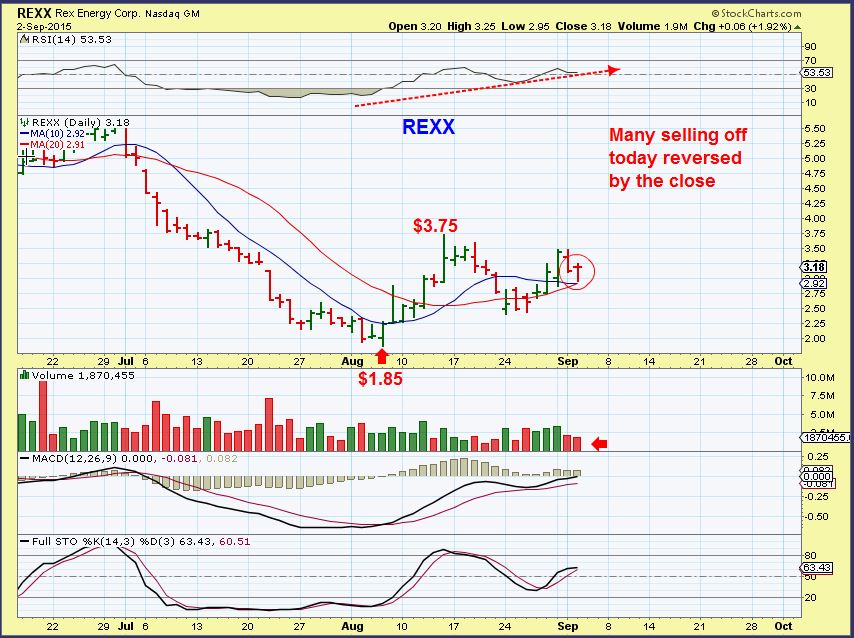
REXX – Reversed on double support.
HAS OIL PUT IN THE FINAL LOWS? We dont know for sure yet, but I wanted to show 3 charts of possibilities that this recent rally could provide.
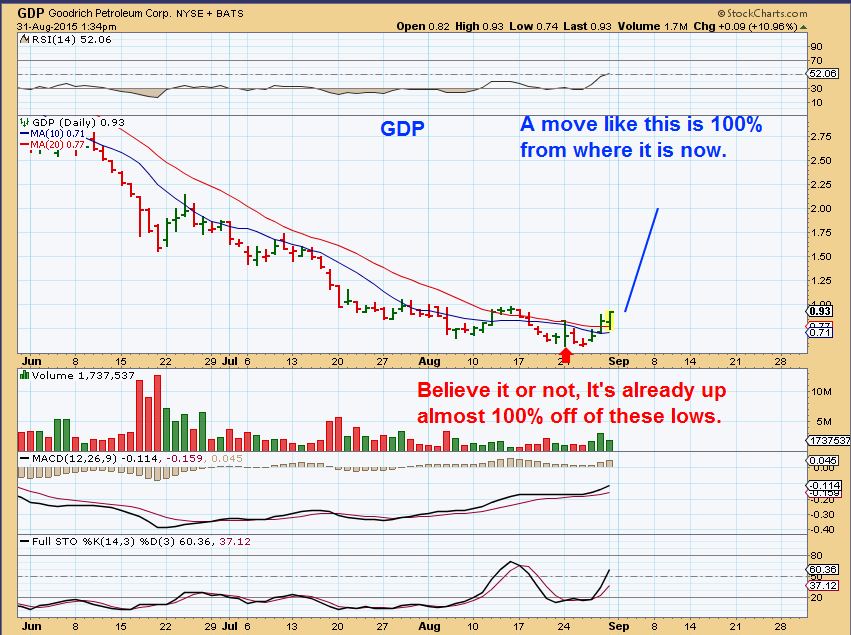
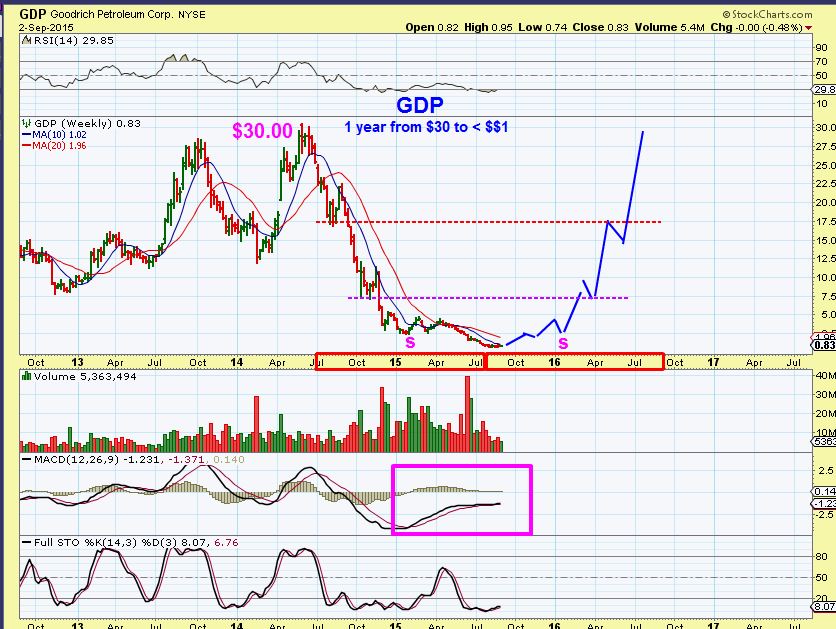
GDP – I pointed this out when I bought it in the $0.70’s. It already ran up 100% off of the lows.
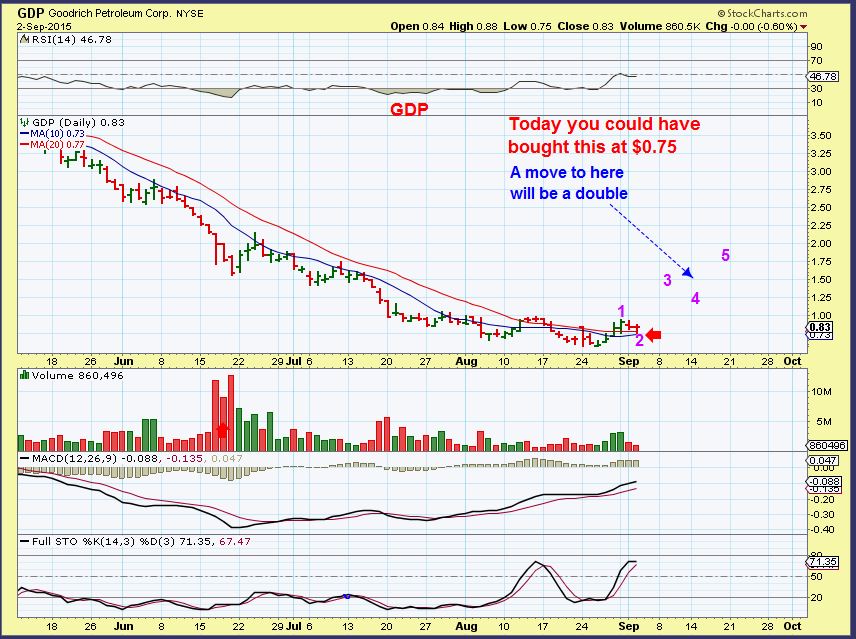
GDP – GDP dropped and is sitting on or bouncing off of support at the moving averages. A stop right below $0.70 would fit my needs. A run to $1.50 would be a double from todays lows.
Here is where I get a little silly, but you never know. If OIL has bottomed and regains price above $70 or $80, could these Energy beat downs get back to former highs? Some may, so lets draw a chart of GDP. Lets say that we just bought 2000 shares at $0.75 today & held. I will draw the chart projecting price 1 year from now, based on where it was 1 year ago. 2000 shares at $0.75 is $1500. Next summer it would be $60,000. I AM NOT SAYING THAT THIS WILL HAPPEN, but we cant dismiss the possibility that these Energy stocks could recover over time if Oil has put in its long term lows.
SO we had the expected pullback. I pointed out that OIL would likely pause and draw back at the 50sma, and Energy stocks would likely follow. Many ran up strongly and you have to wait for the pullback to buy. Tuesday and Wednesday they were pulling back to support. Did you pull the trigger? You may get another chance Thursday if Oil is still bouncing around. As they say, “You gotta be in it to win it”. Just be sure that stops are in place below support. Best wishes and happy trading!
~ALEX


Thanks Alex, way to walk us through some of the energy stocks.
Thank You Bill.
Nothing is a guarantee, but the pullback to the moving averages has at least lowered the downside risk to a closer stop below the support area.
Hi Alex…one analyst says Gold always drop into the jobs report then pops…do the charts reflect that? Thanks
Hi Mickey
What has been happening lately is that Gold used to sell off on Fridays into the weekends. lately ( And I pointed this out in a couple of my reports) most people are afraid to buy & Hold into the weekend, but that is when Gold has been moving higher. Our major reversals kept happening on Fridays.
Is it related to the jobs report, which comes out of on Friday? One can believe that they are correlated if they wish, but I dont think so,. Gold doesn’t jump when the report comes out. It has gone higher into the close , when most do not want to buy & hold Gold over the weekend.
Thanks Alex…appreciate your insight
Quite a spike in the dollar, presumably on a rather benign jobless claims report (slightly higher than consensus but not much). Interesting that gold didn’t actually react that much to the spike, as it was already down quite a bit by that time. And so far GDX is only at yesterday’s low, in the pre-market.
Still seems that we need that new low in gold to set the DCL. Maybe it comes tomorrow on the jobs report and then a big reversal. Seems too obvious but sometimes it ends up being that way.
Well apparently the dollar spike was related to an ECB press conf, not the jobless claims. Makes more sense that way. Don’t know what was said but market didn’t like it for the Euro, I guess.
Not raising interest rates
Quelle surprise! 😉
Good morning Alex,
Do you track longer term (monthly or yearly) cycles in the major SM’s?
If so I for one would be interested to see your opinion, at your convienance. Thanks.
I really dont. Sorry.
No worries.
Nice reversals in many miners this morning, and Silver has been climbing nicely too the past 6 days.
Nice to see the stocks do okay when gold is down. I think we are about ready for a push higher.
NGD has VERY high volume in the first 1/2 hr & I cant see any news on it. 1.5 million in the first 1/2 hr is great. A few others are catching my attention too. On 1 hr and 30 minute charts , GDX GDXJ look favorable for a push higher.
Silver looks to have formed a bear flag, much like in February. How reliable is the follow-through to the downside on those?
Sorry, I missed this post.
Bear flags, especially in precious metals and down trends have a high chance of playing out, but I do see differences in this one.
FEB had no volume on the flag rise, silver is pretty good volume. ALso the RSI has a higher low / divergence now and was dropping then.
I’m glad you pointed that out, but comparing the 2…I think this possible flag may do what we saw in early AUG when a possible flag formed then.
Anyone have any particular insight on gold and/or miners today as they popped higher earlier pretty solid but have continually sold down since? Seen price but too busy at work to chart effectively. May just be $$ moves in response to Draghi conference?
As much as I hate to say it, back to ‘sell the pops’ intraday last 3-4 days on either DUST JDST would have been a very lucrative strategy(not that I am advocating going short here!) But do stay away from FSM, she is one Heck of a dog, New 52 week lows last 2 days.
Daily Swing in Oil. 🙂
And GDX is pushing against the 10sma ( just pushed above ).
Update: NOT 🙂
Beautiful flag on LINE (on 30 min chart)
(refresh)
Very pretty, seeing a few of those in Energy
ohh mannn… :o)
me likey…
Any news/rumors true about GDP de-listing notice? anyone holding or need to be worried? thoughts?Alex? Thanks.
has 6mo to regain compliance with the minimum share price of $1.00, 18 mo to regain compliance of capitalization and stockholders’ equity
Yes, and many of them have received this notice. As Alan mentioned, they have 6 months to resolve the matter and They just need to trade back above $1 ( I think they will). In the past , if they dont regain their higher price, they do a reverse stock split and that solves the problem.
I knew about these announcements when I entered my trade, it is common after such a sell off, and often they regain that qualification in the allotted time.
what a difference a day makes…. as of yesterday, i was experiencing a slow death by water torture…
today… chachinnnng………………………..
run bullseye .. run…
I am having a problem here, this is only a test ,, ok I think I got it
Just seen a tweeted chart: seasonality on WTI is bearish from early Sep to Dec…
Bought 2nd half of planned BAS position earlier this week. Bought USO calls yesterday (a little late on the reversal but caught all of today’s move). Natgas finally moving up? Giddyup!
*Test
test 🙂
LOL, someone contacted me and said he is having trouble posting in comments today, so I had to test and see if it works for me. He can read them, so now he sees that it works for you too. Thanks 🙂
just in the nick of time.. i was about to write ..
..testic…
*Speechless* – I tried to reply a couple times but….nothing .
How about….Thanks for keeping it ‘Rated G’ ? ; – )
CRK – she popped again out of that Bull Flag. looks good volume wise too.
out of BB, due to a pullback.
(refresh)
That would be nice to add on a pullback, but try the B.B. on ACI.
Many would have sold at $2.75 as it left the B.B. , but it closed outside of the B.B. 8 days in a row ( 2 weeks). Wow & it ran straight to $10+
ACI pulling back on lt vol. at 10dma…thoughts??
I was debating… it might take off again, but also it is so overdone it may chop around for a bit to wear that off . It is still so far above the 20sma. ( see CRK after the first leg higher to see how they wear off the overbought surge. dropped to the 10 on ligjht vol, but kept going to the 20sma). BTU also looks like light volume normal pullback.
Ugghh!! I’ve still got sooo much to learn! Thx CF! More homework for tonight…
If it takes off like a rocket tomorrow…you’ll be the smart one and I’ll be the wrong one 🙂
hi
Looks like a head and shoulders pattern on GLD and GDX – http://screencast.com/t/GxT8rxvsN6AM
Thanks
Todd
Hi Todd,
I’m not saying that we cant break lower, but a true head & shoulders pattern happens after a run higher. They play out a high % of the time.
In my experience, H&S at bottoms do not play out nearly as often. They are not really reliable at lows because most bottoms have them. Its just a part of bouncing around at the bottom to build a base.
Thanks
right, I saw ACI.
historically CRK corrects when once out off BB 🙂
like to be on safe side.
BAS did well.
Considering oil gave back some of the big early gains and S&P not much above flat line, the move in BAS is pretty solid!!
agree… steady stair stepper.. ck out that hourly… im luvin this bas play….
BAS has done well
Just as an F.Y.I. – I missed a post by Ombibulous below a bit earlier. If I ever miss a post – it is usually because I leave at 4 or 5 p.m. eastern for the day, but mid day its because I walk away from my computer and it hits ‘sleep mode’ .
When it’s in sleep mode & I reawaken it, I dont get the “Alert’ that there was a new post like I usually do in the comments section. Or If I refresh to see a new chart posted, all notifications of a new posts are removed and I miss them just wading through the sea of comments.
Sorry in advance.
Big jobs number tomorrow morning. Press sure has been playing it up. 1 thought to share for those who play options, watch the implied volatility recently it is extremely high on some assets – SPY, VIX ETNs, WTI. For ex. USO calls did poorly today with crude up as some volt peeled off in the afternoon session. S&P premiums at a very large relative high right now.
GLD/Miners sure are frustrating. Been getting sold down all week. Just about to run out of time and support… 🙁
oohh la lah… anyone see HK like this??
https://www.tradingview.com/x/kDzJD6xT/
Sorry maria, I was having a problem with posting. The problem was me .!!
I picked up some SVXY , LATE Yesterday. Hoping that plan works out