Our positions in the Miners are pulling back, but it is a slow pull back so far. This pullback was expected. We’ll discuss what to expect later in the report, but lets start with the pull back that came in the equity markets first.
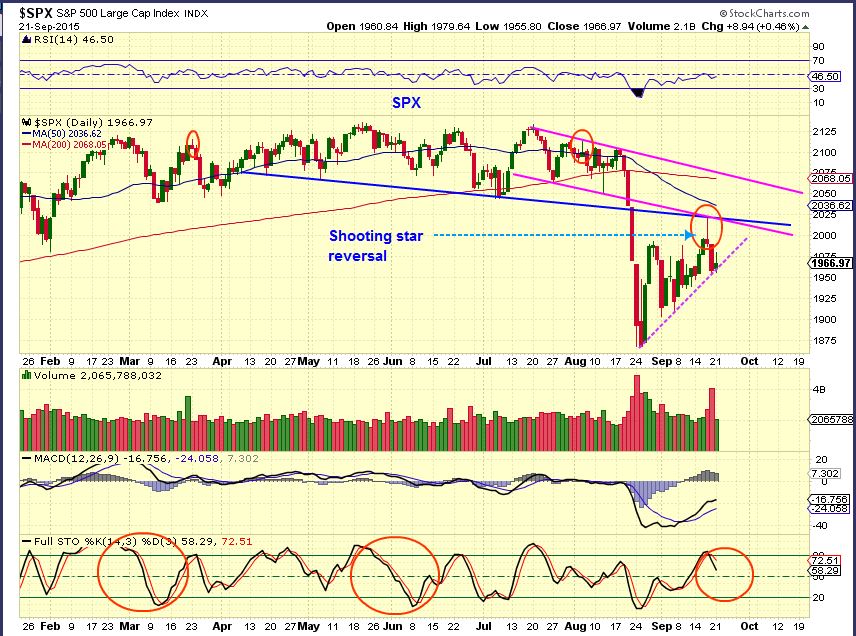
SPX – It started with a shooting star and the stochastics indicate that we could see more downside. In fact, I have mentioned that I expect a test of the ‘high volume candle lows’ sooner or later.
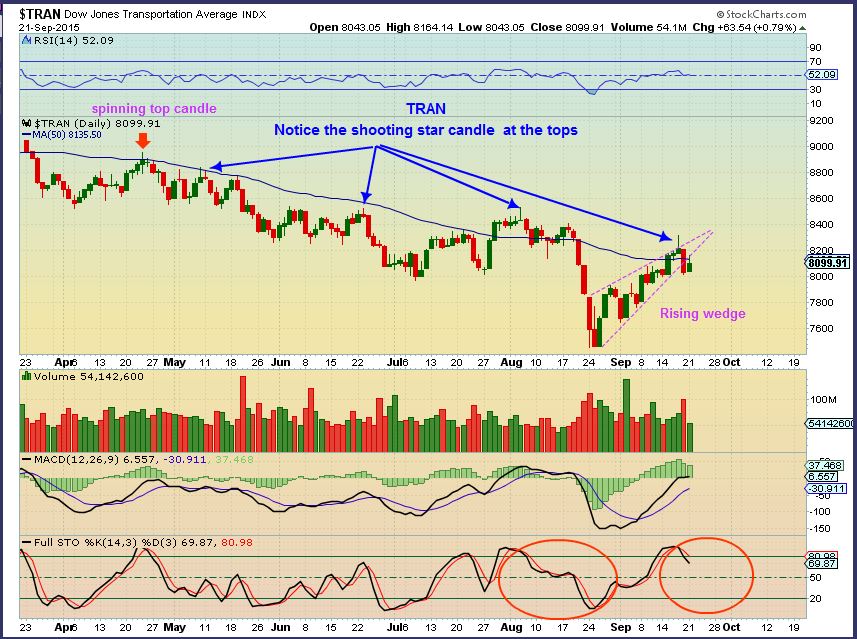
The TRANNIES looked pretty strong re-gaining that 50sma, but they’ve done that before and a rising wedge is bearish. Notice the shooting star candles at past tops?
OIL is playing out as expected too…
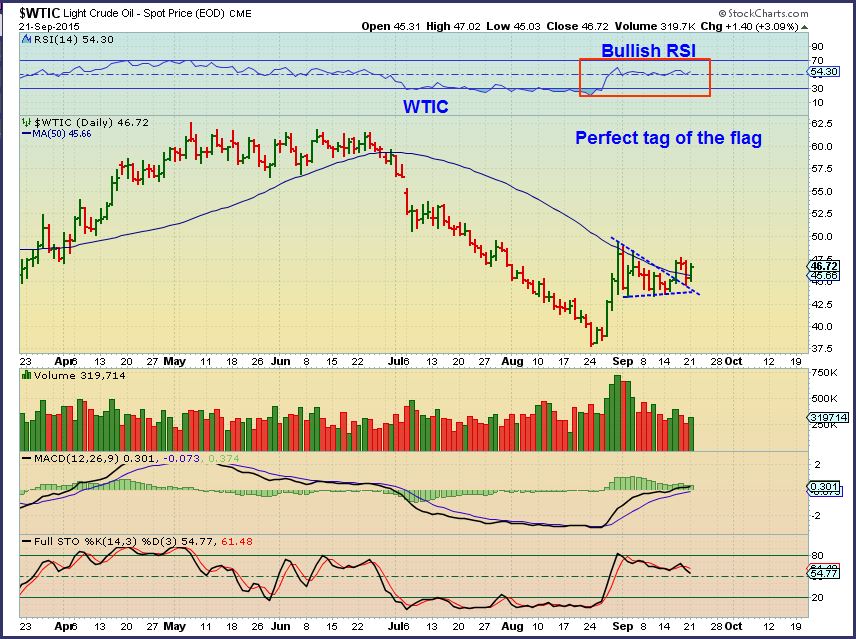
WTIC – The sell off Friday had a few emailing me , asking if I thought it was a break down. In the weekend report I wrote that it looked to be a back test…
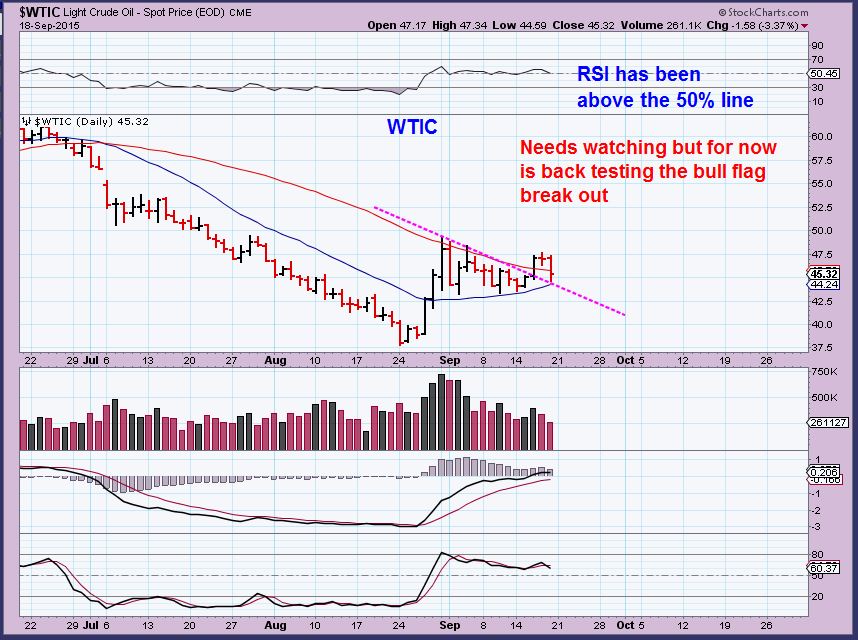
So far, so good. A perfect back test.
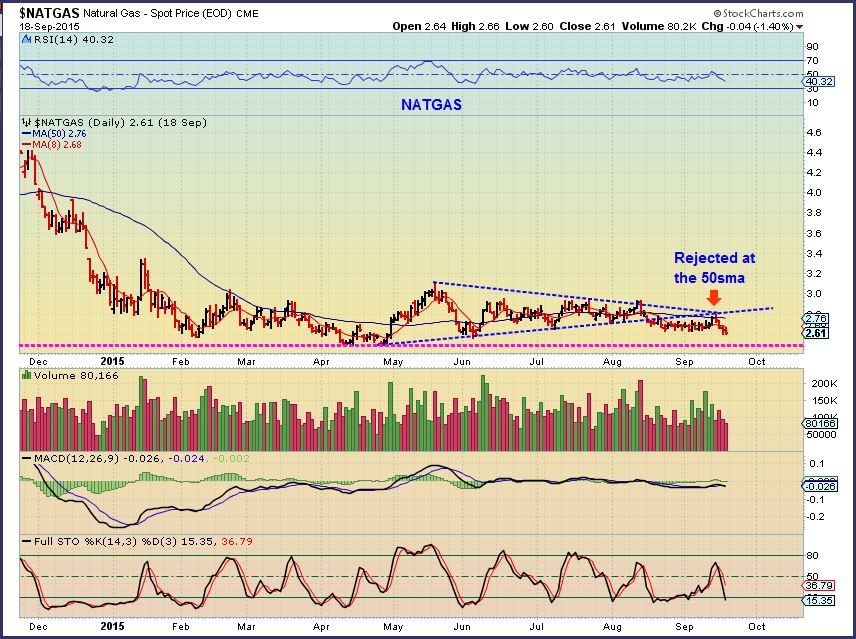
NATGAS – I thought that NATGAS was doing a back test to, but back testing the underside of a break down. It was also rejected at the 50sma. This may just be a LONG base that breaks higher later.
I want to say that even though OIL acted what I would call ‘correctly’, some of the OIL/ENERGY stocks are weaker than others, and I am more concerned when I look at their charts. Obviously I cannot post 100 charts of energy stocks, so I will show some examples of healthy looking ones vs weaker ones so you know what to look for .
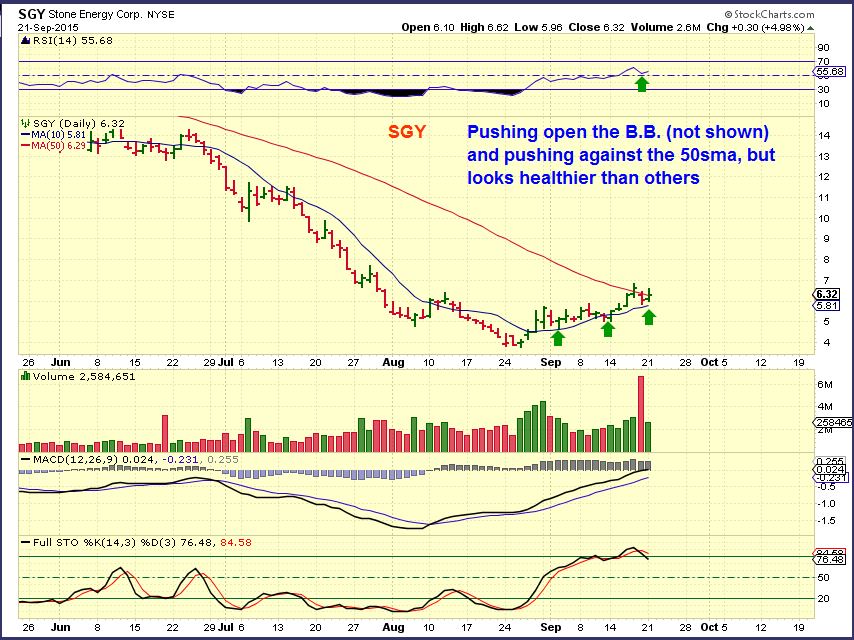
Healthier or fine looking Energy Stocks
SGY –
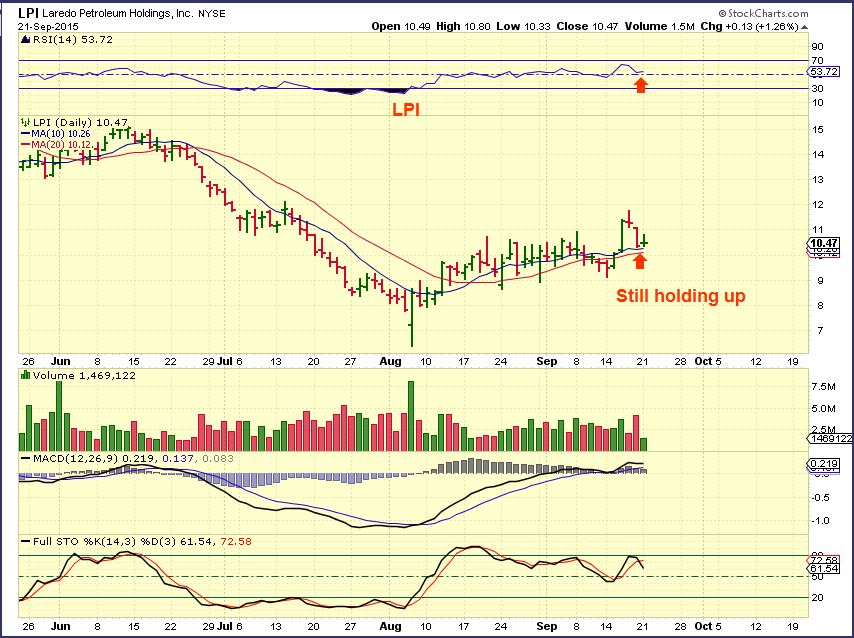
LPI –
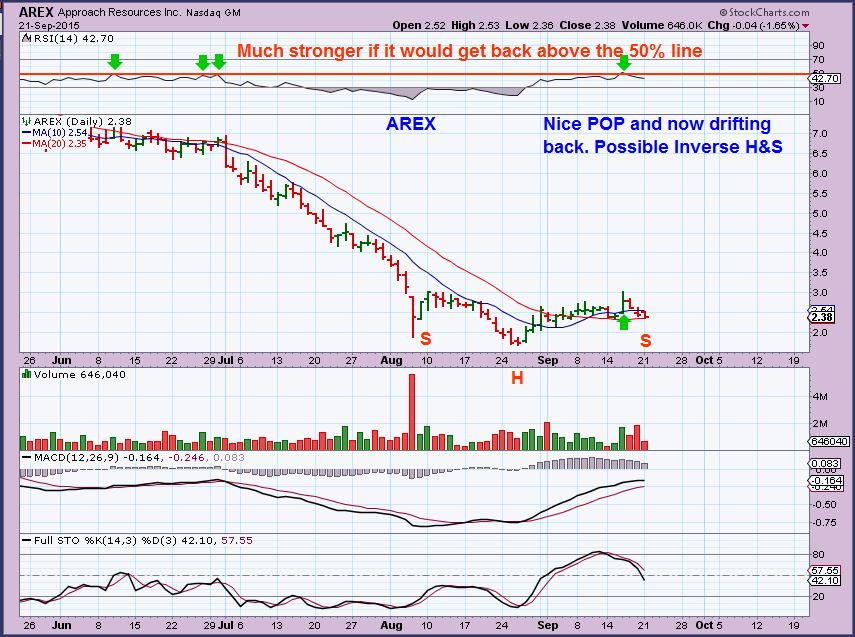
AREX – still fine, and may hold support here. I just dont like that it is so close to breaking support. Even a trip to the bottom again could be an inverse H&S, but it is a large (ish) % drop.
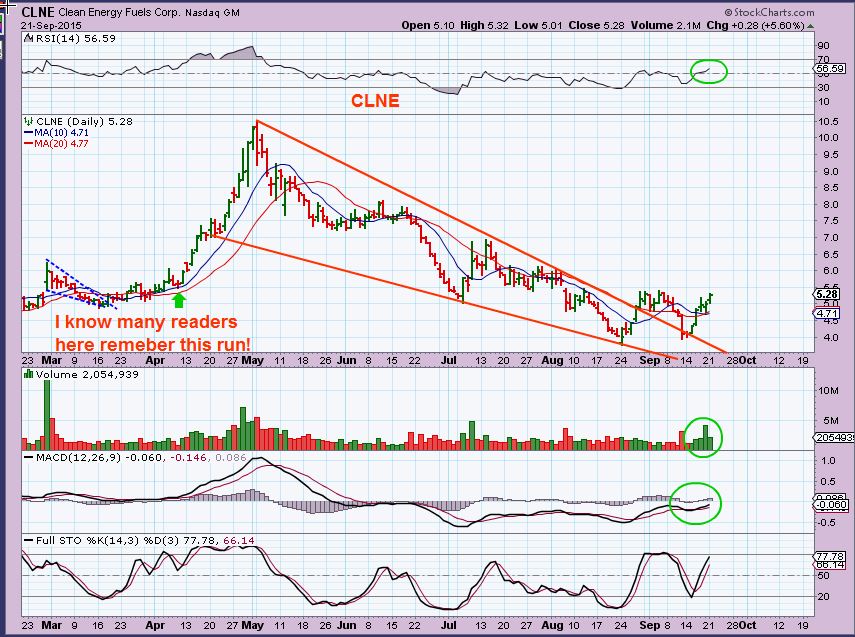
CLNE – This ran like a gazelle last spring. SZYM, PLUG, AMRS, FCEL are more of the clean energy plays that look decent.
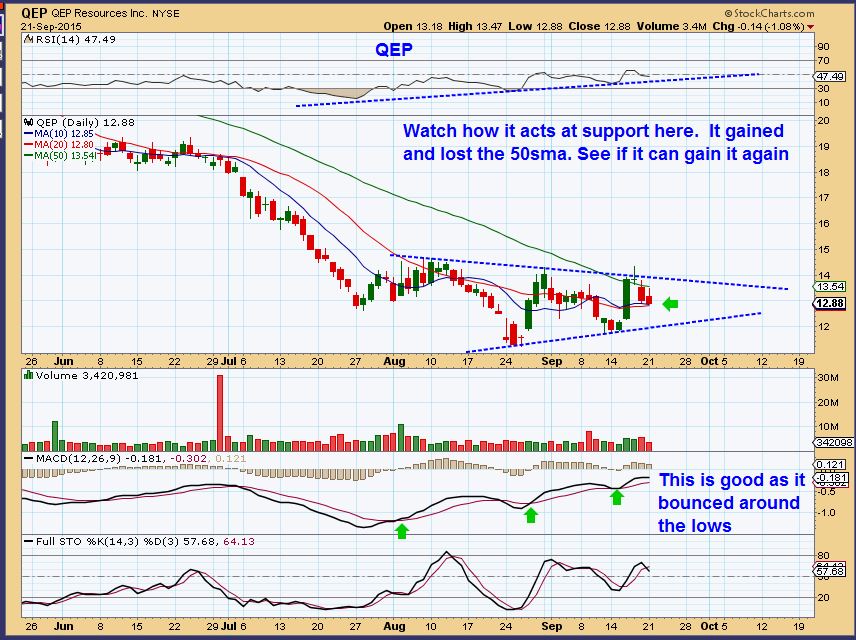
QEP – this had a good set up last week, I posted this chart as it pushed above the 50sma.
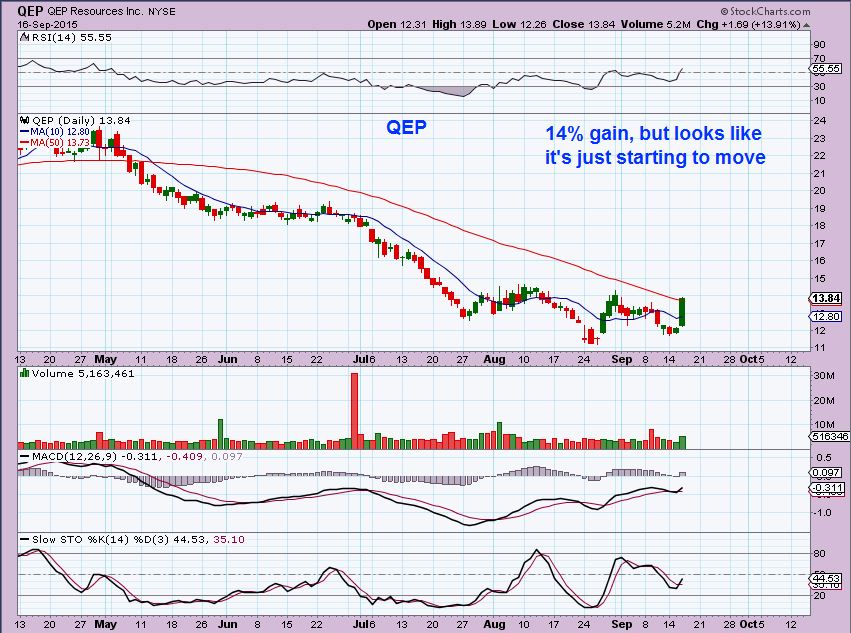
Currently QEP is fine, but it gave up the 50sma. a gap below may get filled? I’d want to stop out if price broke below the bottom trend line. MACD is showing good momentum at these lows.
So lets look at a few that were good looking that now are a bit unhealthy looking by comparison.
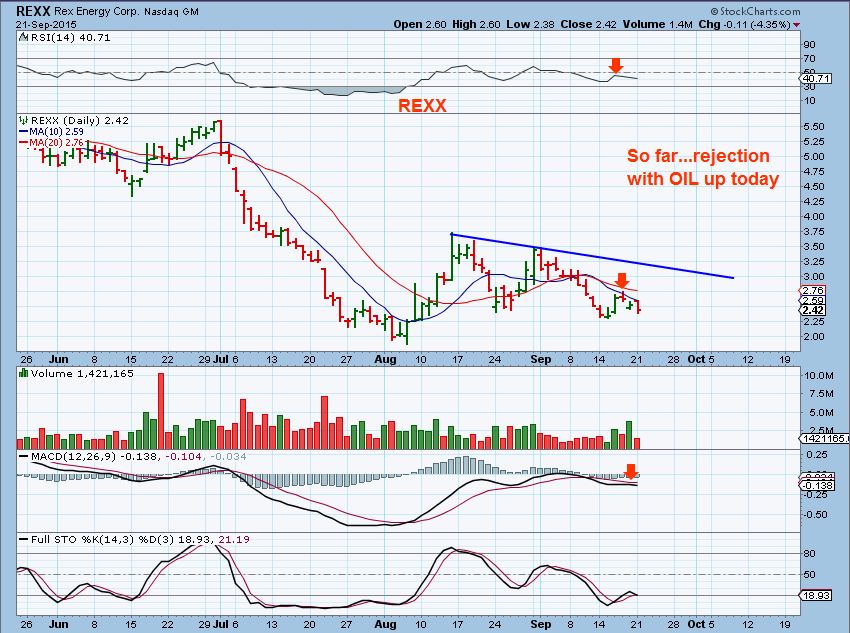
REXX – It is a light volume sell off, so that’s good, but it is weak at resistance and the MACD is rolling over – with oil up today 🙁
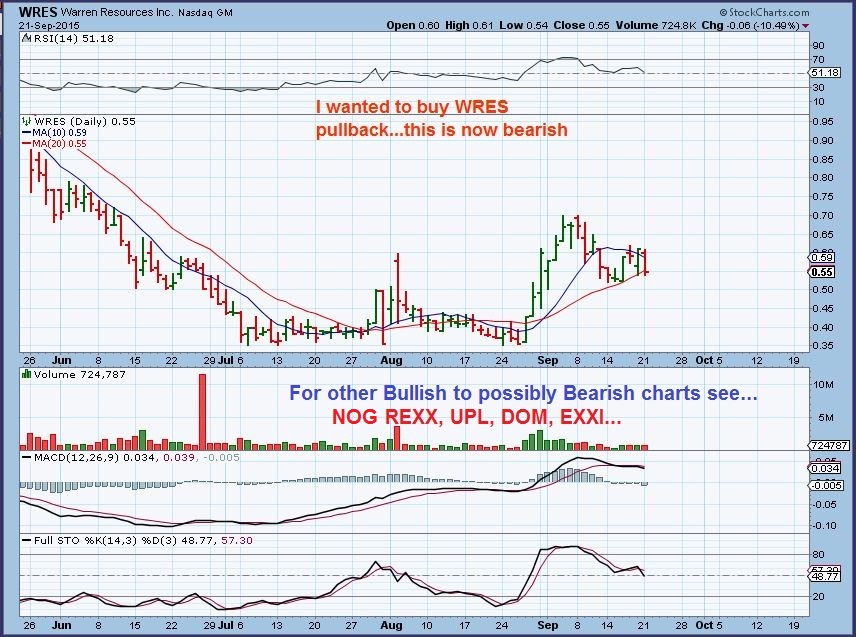
WRES – I wanted to buy this pull back, but it risks breaking down here.
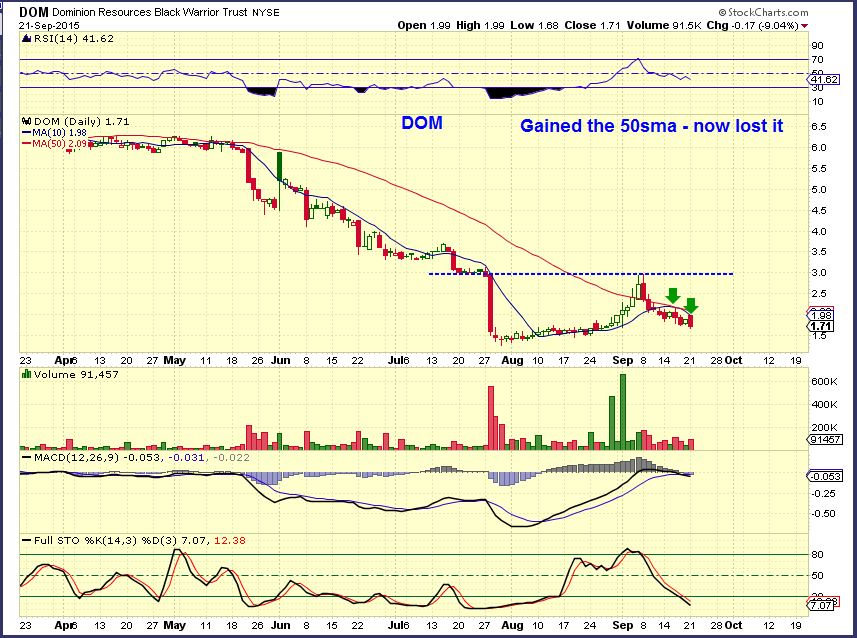
DOM – Questionable. I wouldn’t buy the pull back, I’d consider the next recovery if there is one.
I hope that you can see the difference. There are strong and there are weak Energy / Oil stocks out there. If OIL blasts off higher., maybe they’ll follow, but for now its a matter of watching what you own for signs of weakness or health. Reversals higher may add a healthy change in the future to some of the weaker ones, but we will have to wait and see.
GOLD, SILVER, MINERS
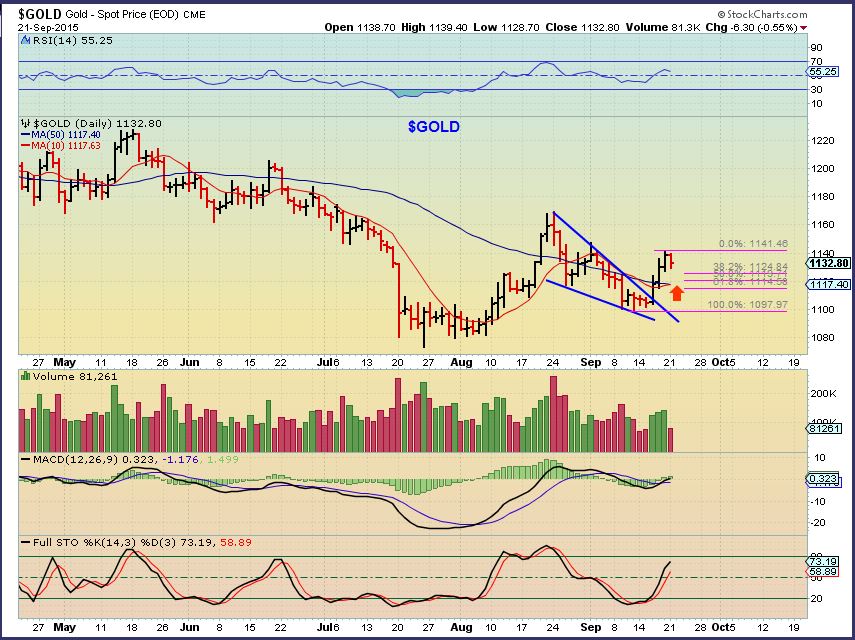
GOLD – I think a pullback in GOLD to the $1120 area would be healthy. This was just the first leg higher and I do expect higher prices. In the first daily cycle ( July to Aug 24 ) we had 2 moves higher of about equal length – Picture a-b-c-d. We could do the same here, but usually under current circumstances , the 2nd daily cycle will do more than the first. $1200 ?
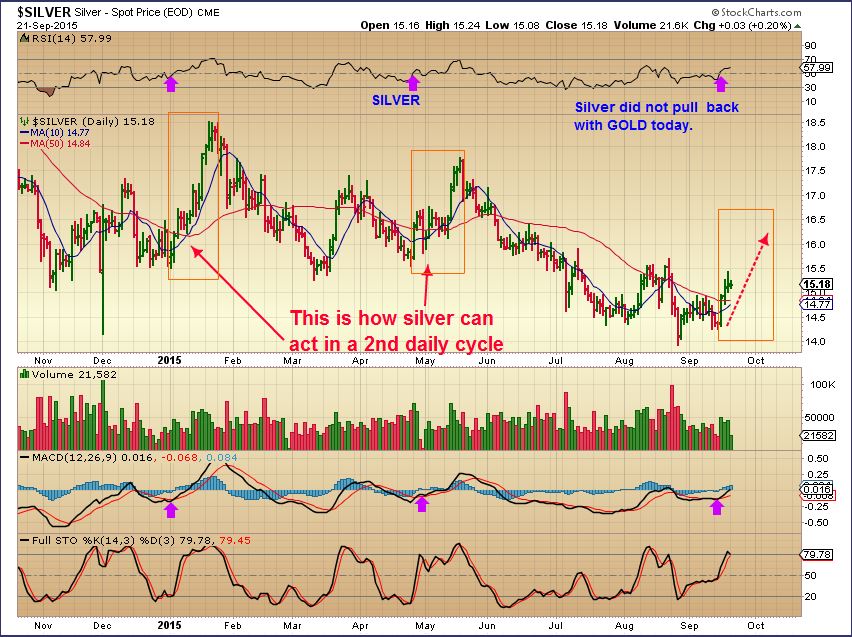
SILVER – Silver often runs fast in the 2nd daily cycle. No pullback today in Silver.
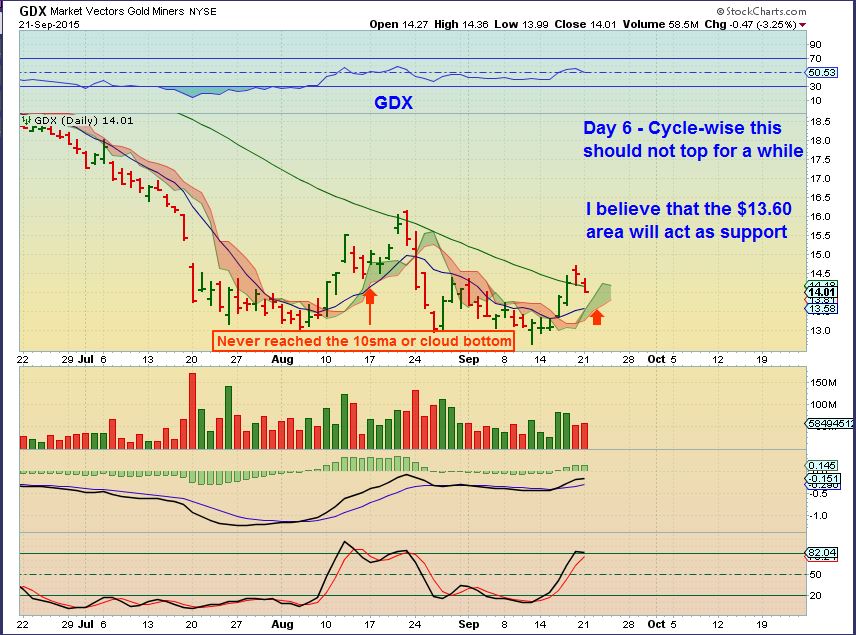
GDX – $13.60 may not be reached. See the 1st daily cycle.
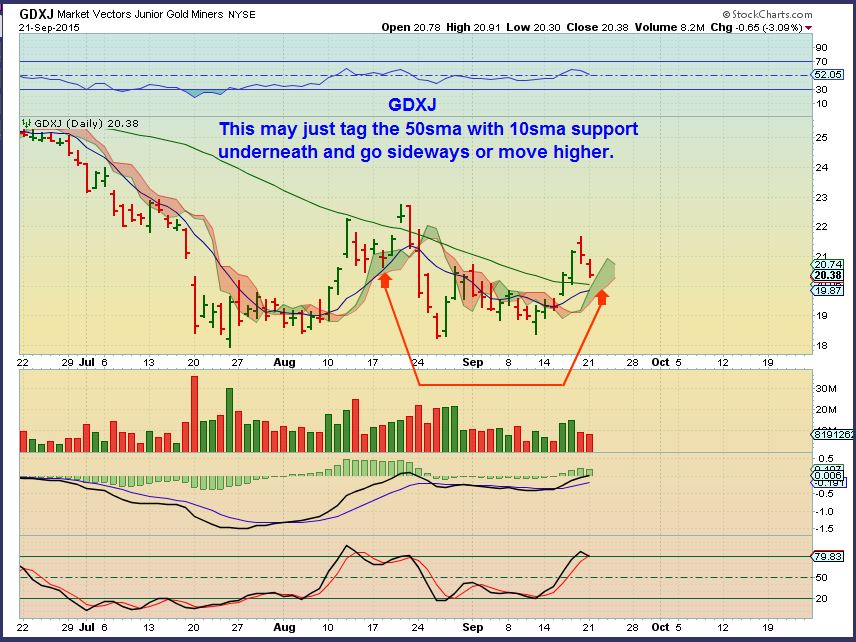
GDXJ –
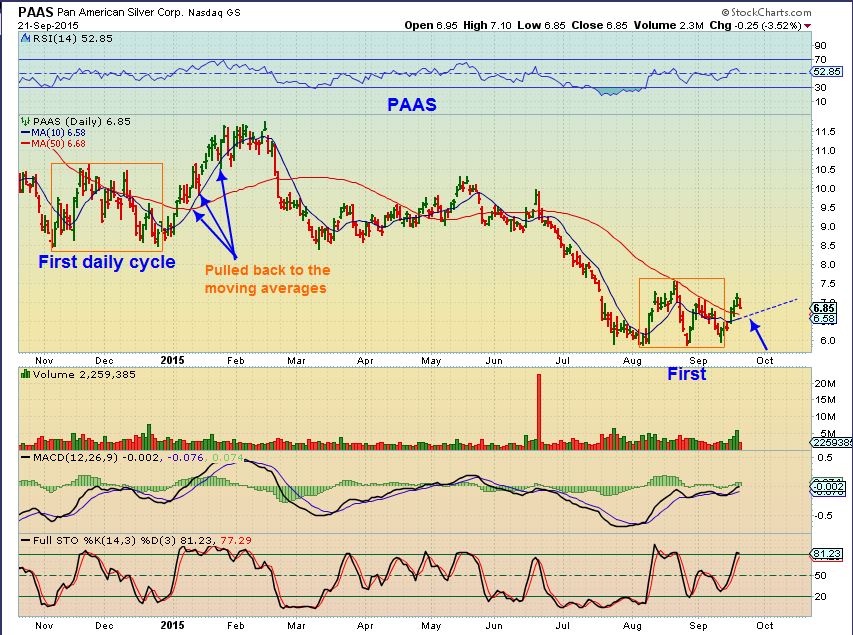
PAAS – lets just look at PAAS and see what a pullback looked like in the 2nd daily cycle. It hugged the 10sma. We may see that this week in many miners.
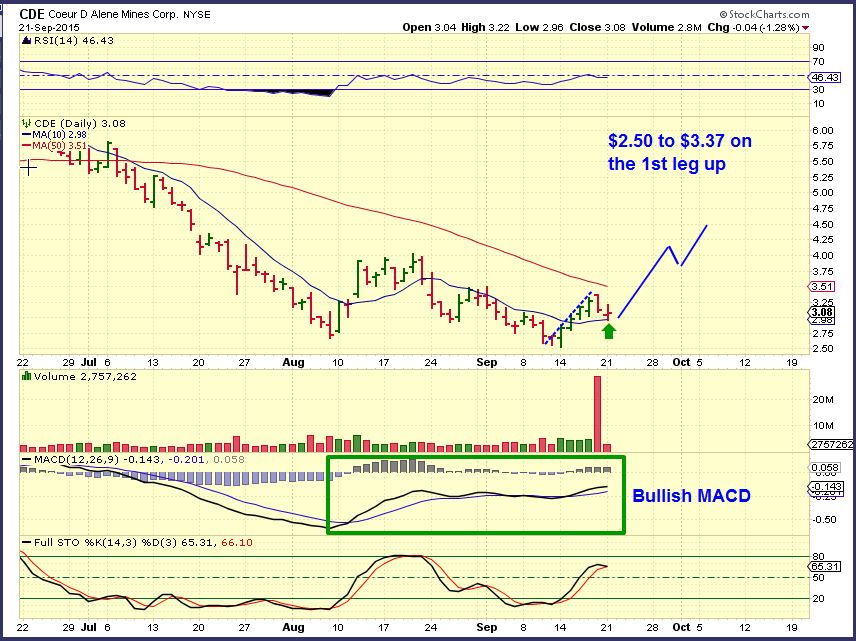
CDE – This MIGHT be support.
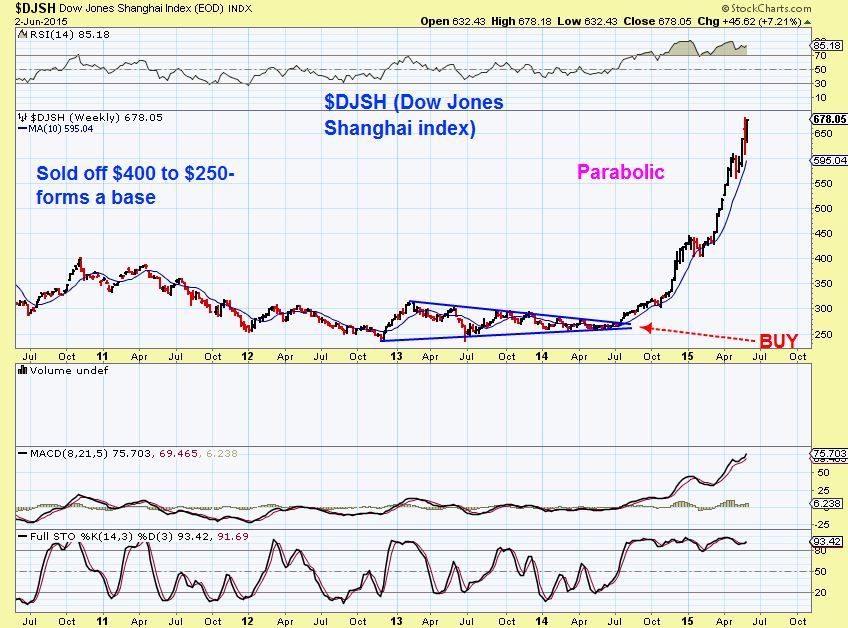
I pointed out “WEDGES” in a recent report. I said that they can be explosive and I also showed the shanghai wedge and many others. Here is another example from a past report.
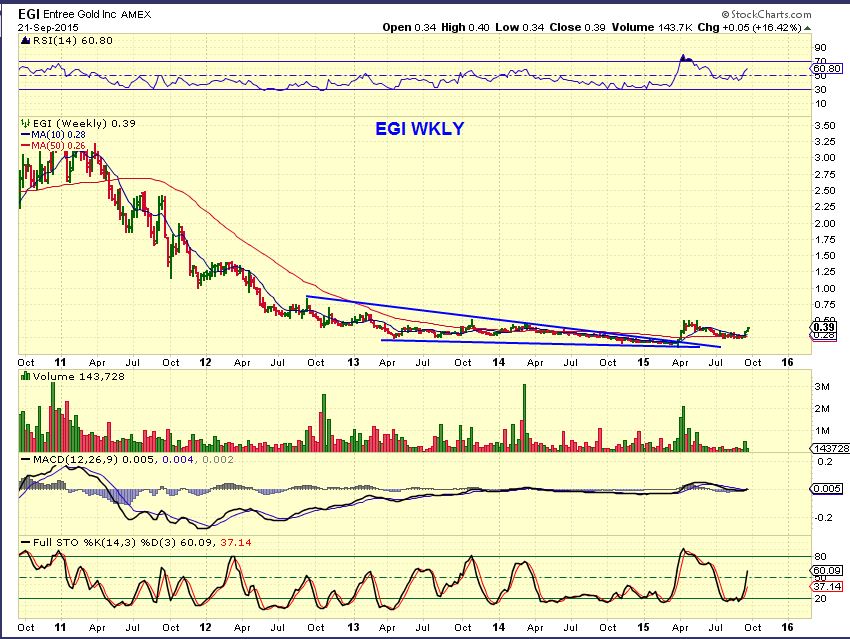
Well, I have repeatedly pointed out EGI also. This is a weekly chart of the EGI WEDGE
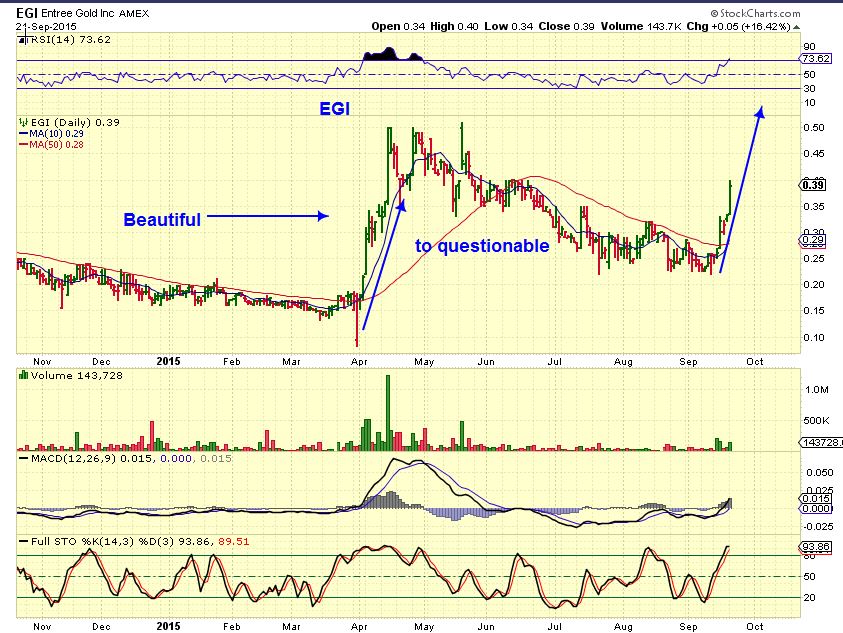
EGI DAILY – This is how it has been playing out on a daily.
You may now recall that last week I pointed out a wedge in TGD. This is it currently, we have had a capitulation event since my first post.
TGD WEDGE
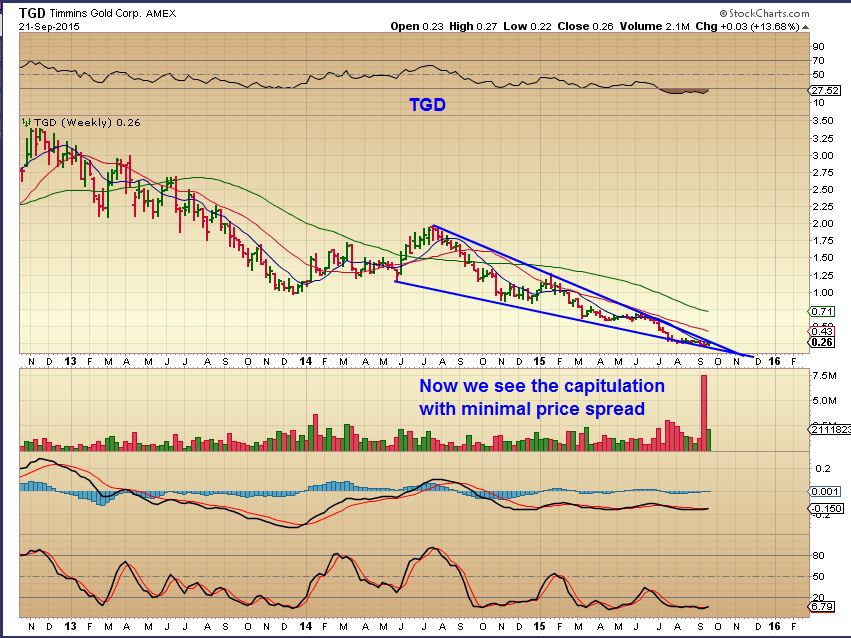
TGD– This is a very interesting looking bottom that has formed with that volume. Many people do not want to buy stocks under $1, I understand that, but I am pointing this out for those that may have the idea that a few miners may recover when Gold breaks its bear market grip. 1. Buy the break out ? 2. Buy the break over the 50sma? 3. If it drops back to lows, but the lows (less likely with that volume ).
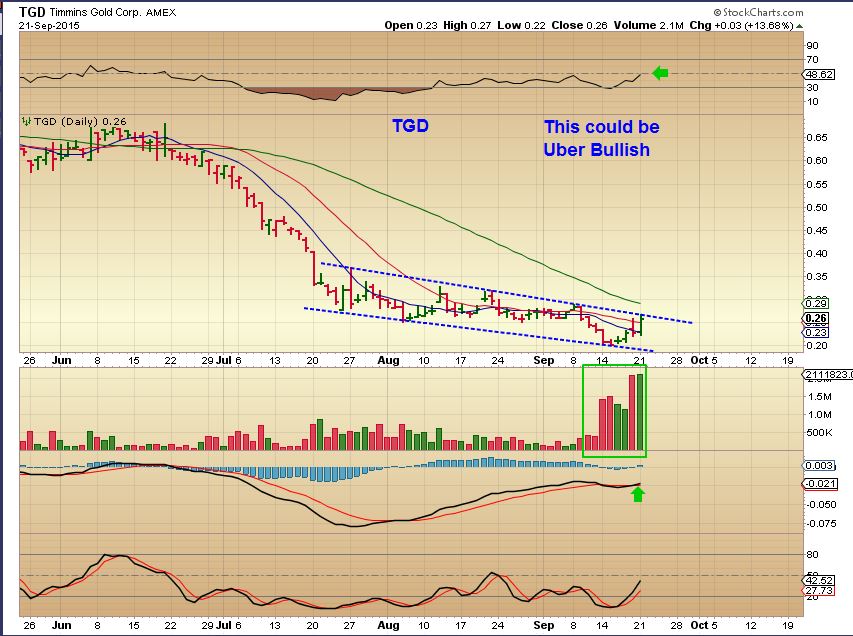
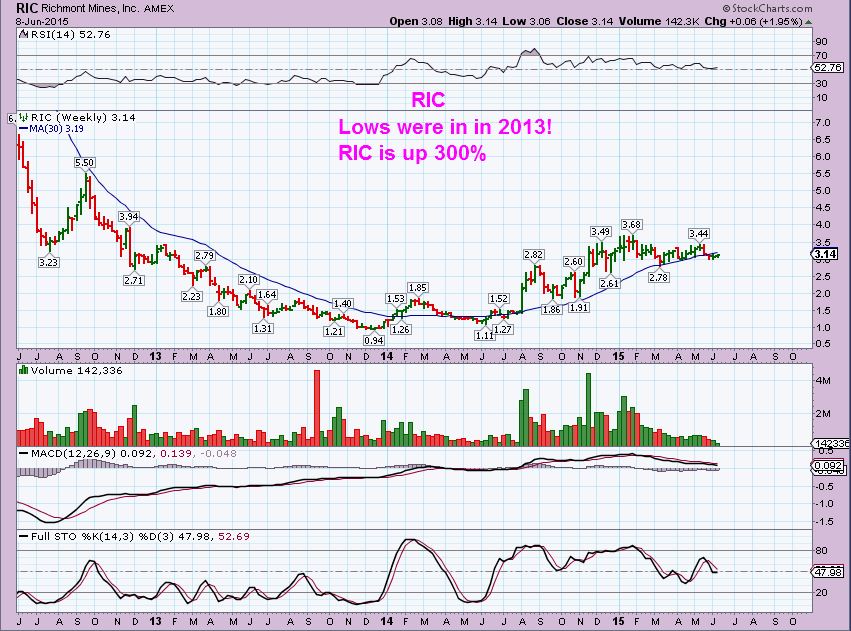
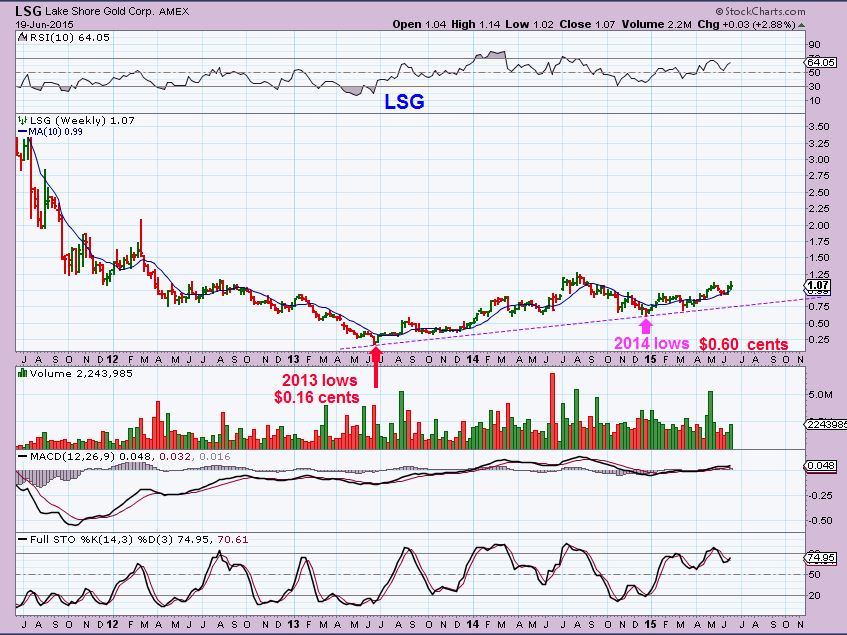
( SEE RIC , LSG for examples of recovery Miners , mentioned here many many times).
RIC –
LSG – 16 cents to over $1
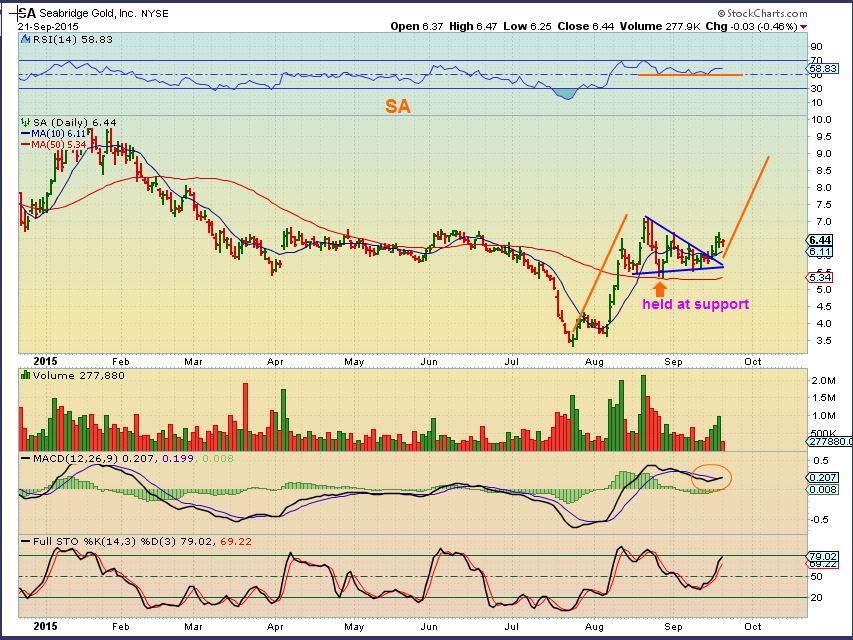
Finally I just want to say this about perception. It’s funny 🙂 When SA recently ran from under $3.50 to $7 , I had people asking me “Where can I buy this before it gets to $10! Whats a good entry?” Now no one is asking about it, but I think it is gearing up to run to about $10.
SA – It has shown its strength and held its gains. Support held $1 lower at the 50sma . It has basically proven itself, but now it appears too expensive or boring?
So with this report I am encouraging BUY THE DIPS at support on your favorite Miners. Or buy a reversal higher, or buy them as they re-gain the 50sma, whatever your comfort level is. As this pullback continues tomorrow ( I assume it will based on my GDX/GDXJ charts), I will post some charts of miners as they set up for a low risk entry. This is the second daily cycle and often it can be a mistake to try to trade around them too much. I actually didnt recommend selling and re-entering, so it is assumed that many are just riding their trades higher. Losing position can be costly if surprises are to the upside, but I know we have many traders here so I will provide some charts tomorrow.
So far GOLD, SILVER , and Miners are acting as expected and remain quite bullish. Thanks for being here at Chartfreak!
~ALEX
P.S. I have been working on this report for over 4 hrs , and I want to release it tonight, so I am not going back to proof read it. Please forgive typos and mistakes 🙂
Lets Check This Puppy Out 
 Watching
Scroll to top

Thank you for your relentless work for us! I appreciate the nightly report and all the great ideas!
Tiger5! Nice to see you again. I do remember you from the BBT days and your encouragement when I posted. Thanks buddy.
Ditto! Thx Alex.
Thx Deshy & Ur welcome 🙂
Hi Alex. Especially pleased to read your report tonight and the expectation for additional minor pullback in gold before heading higher in the 2nd daily cycle. I had sell signals popping up on my 1 hour/4 hour charts,which sits perfectly with your report today but like you also seeing this as a buying opportunity before heading higher again in the near future. I can see your argument for $1200 gold. IF…and I stress IF…we can make it higher, 1225/1230 looks another obvious target area and IF we could make it all the way the the trend line that connects virtually all the recent ICL peaks then nearer 1240/1245 looks possible. Now that would be nice!! 🙂 But one step at a time and as you point out today, the first one is picking up some more stocks/ETF’s in this pullback. As already mentioned, thanks again for all your hard work and no shortage of ideas. 🙂
Agree Chris, I often just watch the pullback for signs of strength or weakness and so far (Esp silver) things looking good.
We’re certainly seeing additional pullback as I write in gold/silver and based on UK listed mining prices we should definitely see some mark downs at the US open in PM miner prices. Buy lists at the ready!! 🙂
Yes, MY chart of GOLD in the report shows a few reasons why $1120 area may be Golds next support. The 50sma is at $1117 and fib #s are there or lower, so we can see more dip in Gold 🙂
Good day
Very much agree Alex, that 1120 area looks interesting for a whole host of reasons. A good place to monitor for support and a potential turn back up. 🙂
I am going to be away this morning ( Dental cleaning and a few other stops). I would look for low risk entries today if your favorite miner is pulling back. When I said in the report I would watch the pullback and draw up charts of any entries that may present themselves, I meant I would draw them up in tonight’s report. I gather my charts at night. IF YOU RECOGNIZE ANY LOW RISK, LIGHT VOLUME SELL OFF TO THE 10 SMA or OTHER PROBABLE SUPPORT, YOU MAY JUST WANT TO BUY OR AT LEAST START A POSITION.
I assume many are already in with recent moves above the 10sma in GDX/GDXJ
Thanks so much for a great report, Alex!
I’ve had a watch list of miners/developers for awhile – do you care to take a peek at them? I’m watching because of favorable fundamentals, but I want to enter based on technicals. Hey, that sounds like a CF!
Fwiw, they are:
USA: PVG, GORO, RBY, NGD
Canada: KAM, DNA, RMC, LUG, OGC, SMF
tx cf
oooolala sa 🙂
lol
Well there was the first touch of 1120 on gold!
For those trading JNUG, we’ve blown through the 50% retracement level (8.41) at the US open and next level to watch IMO is the 62% retracement around 7.95. There is nothing that says we have to reach or indeed stop there but a level worth watching!
61.8% would be a perfect spot to buy and rebound.
Would agree a perfect spot to rebound Bill. A perfect spot to buy only if it actually bottoms there!! Lol 🙂
one never knows
Absolutely Bill. So it’s wait for some hint of a turn…or bottom pick…whatever style each of us chooses…BUT ALSO know where your stops are even before you enter the trade.
Of course JNUG is leveraged and suffers form decay. We shouldnt chart off of leveraged ETFs. Look for GDX 13.44 to go to 61.8% then rebound, GDXJ at 19.65
Couldn’t agree more Bill. I only mentioned it because I knew a few other CF’s at least were making use of it. But yes, far better to chart off unleveraged products, especially on longer term time frames, where as you say the decay can become a real issue.
Chart for GDXJ, outlook
You’ll get Maria all ‘hot and bothered’ with that ‘harmonica’!! 🙂
But I showed EW also?
I can’t begin to imagine what effect that combination will have!!!! 😉 Lol
ohhh myyy…
https://uploads.disquscdn.com/images/91e51560f1b854ad1f9b3e7f1e018f09f54265b23942857e0ebf996435a23052.gif
will have to check it out later….Bill..looks pretttty cool tho
Bill, with this harmonica it would indicate that the 2nd DCL has already topped, meaning that subsequent high points would be spots to graciously exit positions. Is that what you thought?
Cason, I am just laying out one scenario. It appears to be a Gartley pattern forming. Until its broken, I think we need to be cautious. You really shouldn’t trade Harmonic patterns until you reach point D. At that point, in this case, go long.
Ok, didn’t realize that – it’s more of let it finish and go long at D versus try to catch B->C move. Gotcha.
Just received a stock recommendation from a gold stock service and it was a Marijuana stock. Maybe that’s an indication that we are about as low as we’ll go on the gold stocks.
LOL, I’d heard a story somewhere that a gold miner(s) were getting into MJ growing. Might indeed be a good contrary indicator.
Maybe their recommendation is for usage to weather the drop?
Who they recommending? GWPH
A Canadian company called Umbral Energy a resource company going to pot.
Doesn’t look like a pot company to me.
I guess the pot diversification is relatively new.
I got an email about them too. Funny
I see GDX/J now down near support areas we highlighted, but don’t see any sense of turning up yet, planning on likely doing nothing rest of the day, see if tomorrow isn’t a better opportunity for JNUG.
I probably sound like a broken record at this point, but based on the fantastic indicators we received at the ICL, this has just been horribly, horribly disappointing. Am sure general market weakness part of it, but the lack of safe haven bidding to metals also concerning in its own right.
Cason, we all feel your pain. I’m fully in right now. I feel Today is the buying opportunity. I think we gap up Tomorrow and off to the races. Based on the last cycle timing.
Hope you ar right! Fortunately, I cashed out JNUG Fri and only 1/2 half in right now. Yea, this is probably the buying opportunity but I’m waiting for tomorrow, if we went down again I’d be in trouble. GL Bill.
I don’t know if this will help Cason but in the ‘big picture’ gold and silver are still in technical downtrends. Therefore, in that sense at least we have to acknowledge we are still fighting the larger trend. Having said that it is possible that the recent lows in gold/silver were MAJOR lows but we won’t know without a lot more price action. So worst case scenario this is just one more bear rally within that larger downtrend as all the recent IC’s have been. However, even under that worst case scenario we can still expect a 2nd and potentially stronger upleg in this current IC. If you look back at the IC in gold that began last Nov, the 2nd low took hold on 22 Dec but on 2 Jan there was an exceptionally deep pullback with an intra-day spike that very breifly took out the 22 Dec low. At that time it would have looked like the ICL might not see it’s 2nd leg but then it quickly reversed and gold went from 1170 to 1300 over the next few weeks. It’s just possible we are at a very similar point now in this current IC and very close to the next surge as Bill suggests but we have to allow that we might see a wobble or two first as we did last Dec/Jan. But all the recent IC’s STRONGLY point to a 2nd upleg yet to come, so hang tough until price action tells us otherwise. 🙂
Thanks, Chris. Yes, I am definitely operating under that set of assumptions right now. Still not impressed compared to previous ICLs. Good point on Dec/Jan move. I was partly expecting that, but always seem more harsh when it actually happens!
So true Cason. Looking back at a chart with the benfit of hindsight is one thing, being right in the middle of it with the added ’emotional’ element is something else entirely. As we all know a hugely important part of trading/investment is getting the ’emotional’ element under control and thinking/assessing with a ‘cool head’. A LOT easier said than done!!
That’s a big part of the reason I have to continue to be a member here, no emotional control (but at least I know it!).
Identifying our ‘weak spots’ is the first step in conquering them. And I speak from painful experience!! Lol I’ve read quite a few investment/trading books over the years and they all stress how controlling our emotional response is one of the greatest but most important challenges. So you definitely aren’t alone.
dang..what am i missing..today’s a busy day- CFs off gettn drilled, Chris is talkn about Bills harmonica, everyone else in convos about ganja? sheesh.. when the cat’s away..the mice will play .. ;o) https://uploads.disquscdn.com/images/b387348b98287dfe4e2dcfa9198c5ec6d6293185ff8c9ff999545f6656493556.gif
I’m guessing CF wishes he was here right now..especially if he’s “gettn drilled”!! 😉
well.. it’s that or polished..
Those aren’t Mice?
lol .. bill .. you’re such an ‘engineer’ ………..
#InspectorGif
thats all i had handy.. at work…
Teeth cleaning 🙂 Got drilled in some of my miners though
You could have used a Cat….Woman
.
(Cat-Woman for those who didn’t realize that you play the part)
ha! what do u mean?
I AMMM CATWOMAN (insert catwoman animated gif) ;o) meow
hmm.. is it go time..??
this too pie-in-the-sky PolyAnnaish??
https://www.tradingview.com/x/EfFuS5Ti/
Well the MACD has made a bullish cross on my 15 min chart, so there is the very first hint of a turn!! 🙂
in my humblest opinion… (gdx, FCX, etc etc.).. i think wave 2 just finished.. hangon for wave 3.. woo hoo
Have you got your “cheerleader” costume on by any chance!!? 😉 Lol
i have one u no….did i already post it here? lol
Hahahaha….Somehow that doesn’t surprise me!! 😉
remind me later.. 😉
I will!! Lol 😉
I haven’t seen Maria the Cheerleader yet!!!! Lol 😉
giggle.. ok hopefully no one will be checking back.
nice smiley maria w/ my son? or crazy maria with the ‘blue devil’ mascot..? ha ha ha
story…my sisters and i (i have 4) all dressed up as cheeleaders for my niece’s high school sectional game.. the school let us borrow the outfits.. lol (we had some fun) all “G” rated ….. LOL disappointing im sure.. HA HA!!! (yes, I know what you’re thinking) HA HA HA HA HA HA
ps. it’s possible i didn’t tell u the *entire truth.. L O L
I can only imagine!!!! 😉 🙂
Very cute. 😉 And based on the voting only Alex and myself have had the pleasure of seeing you in your cheerleader outfit!! Lol Well one of them at least!! Haha 😉
FWIW
…i also (if my count is correct) i found that DUST has completed wave 2 up and is in wave 3 down ….
(im also giggling to myself as this echoes in my mind ….. “if u stare at a chart long enuff it will tell u anything u want it 2)
https://www.tradingview.com/x/dKGZTlQ0/
Boy, I hope you are right, cause my hands are getting tired (of holding on to the edge).
I do like seeing the crude has fought it’s way mostly back to near the unchanged mark. Sure energy stocks still getting crushed but low tide in Dow Land probably at least partly to blame. GLD holding still, but miners continuing to fade, glad I held off purchase this morning. Maybe crude and gold are the better purchases if we are going to test equity lows?
I’ve had inverse ETF’s on board again as I’m seeing equity markest going lower yet and possibly quite a bit lower!! It won’t be down in a straight line but I don’t think we make to look any kind of meaningful low in general equity markets before early October.
Agree. I finally got with the program yesterday and got SPY puts, if not to downright profit, at least to hedge and stay even until a longer term low is out in this fall.
I know it’s likely the minority opinion but looking for a test of the lows, a final bull farewell to nominal new highs then potentially a full on equity bear. Time will tell.
Pretty much the way I’m seeing things in the general equity market as well Cason. Looking for a VOLATILE bottoming process in October to then launch a meaningful year end rally. I’m less optimistic about nominal new highs though and think we have already started the bear market. However, all you need to do is monitor the longer term ma’s like 200/300 day as highlighted by Alex. If the bear is already underway, those averages will pretty much cap any bear rally. If the indices get back above them, then a bear market has potentially been aborted once again as it was in 2012..at least for the time being. So just need to monitor closely at that time and let the price action tell you. I’ll let you know when I clear out of my shorts although I’m using the x2 leveraged inverse ETF’s QID and SDS amongst others so they may behave a little differently to your puts depending on how far in/out of the money etc.
Increased my miners (w/ GDX) by a fourth. That was an extremely hard trade for me to make; however, this seems to be the place to do it as it is less than 6% from THE lows, allowing for a close stop and I do believe we haven’t finished an intermediate rise (at least intermediate)
and has bullish div on 1min, 5min, & 15min
I may be wearing a straw hat by the end of the week – anybody need some yard work done?
LoL
lol squared
I had my teeth cleaned and did some yard work today
Well, it was for my Mother, but crazy co-incidence ( Its suddenly turning autumn in New England)
I need work done but have no money.to pay you with. I have extra athletic shoes I can trade for work.
GL Cal. I just couldn’t hit the ‘add’ button today. We’ll see what tomorrow brings!
Looking at charts and while GOLD & OIL held up, Miners and energy stocks still seem to lack the confidence of the buy & H-O-L-D Teams.
As pointed out in the past, even at the ugliest part of the Bear Market rallies in the miners, they have made good gains in the 2nd daily cycle. Sentiment is still ugly and bearish and that is a good sign, so we should get a nice run up when Gold does its next move higher. I too was disappointed to see Miners close below the 10sma.
The report will be very late tonight or tomorrow morning.
Disappointing. Yep. That is the best adjective for right now.