
Buy The Dip?
It felt like just about everything in the market was pulling back today. Not all pullbacks will qualify as a ‘Buy the dip” candidate, but some may be setting up as a nice opportunity. Lets take a look…
.
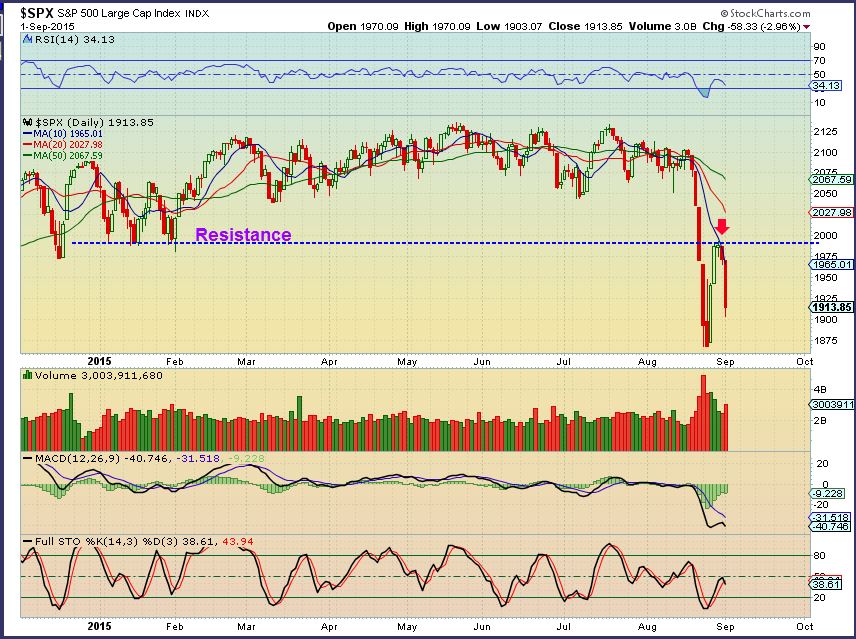
SPX – This turned down at multiple resistance areas.
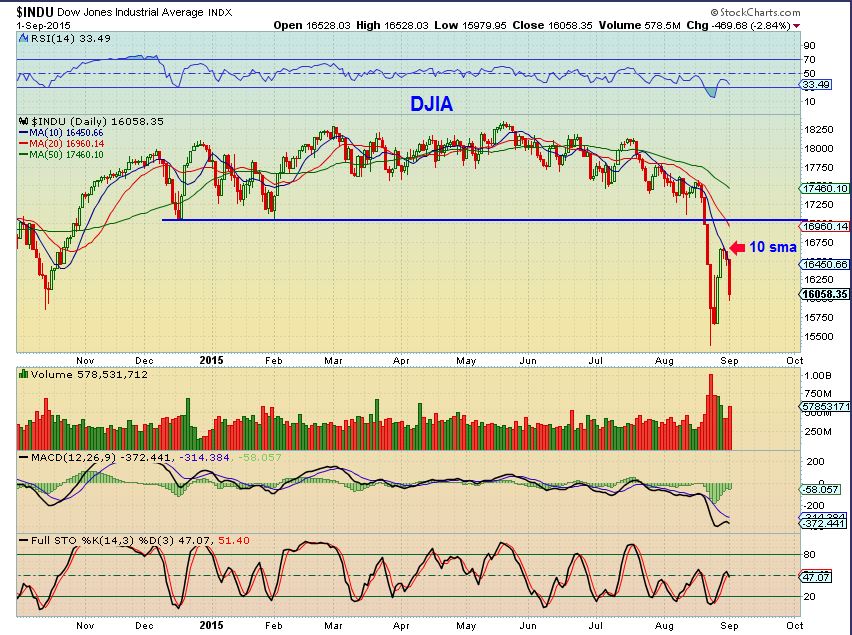
DJIA – 10 sma stopped the bounce
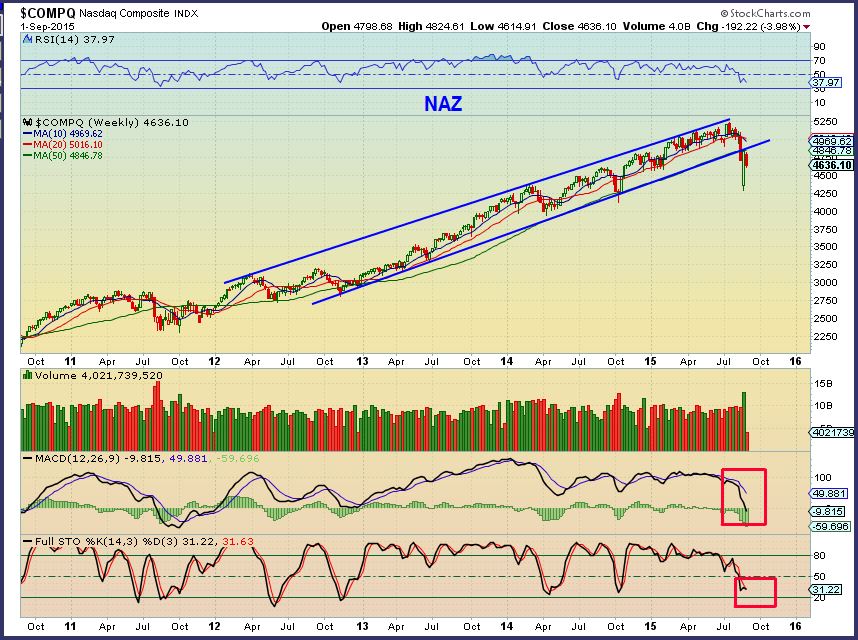
NASDAQ – Hows the long term outlook? Buy the dip?
The USD remains the same at this point. I see weakness.
,
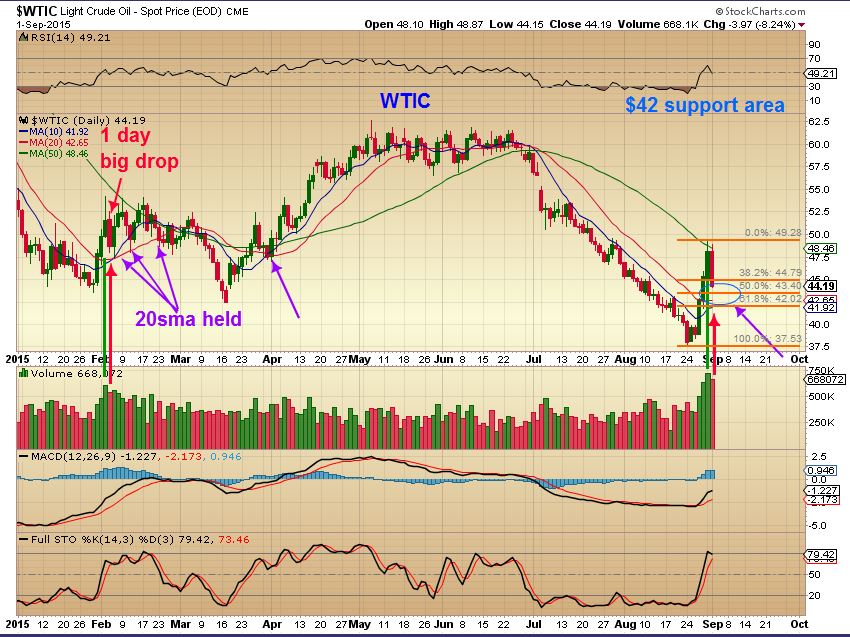
WTIC – Oil started the expected pullback at the 50sma.
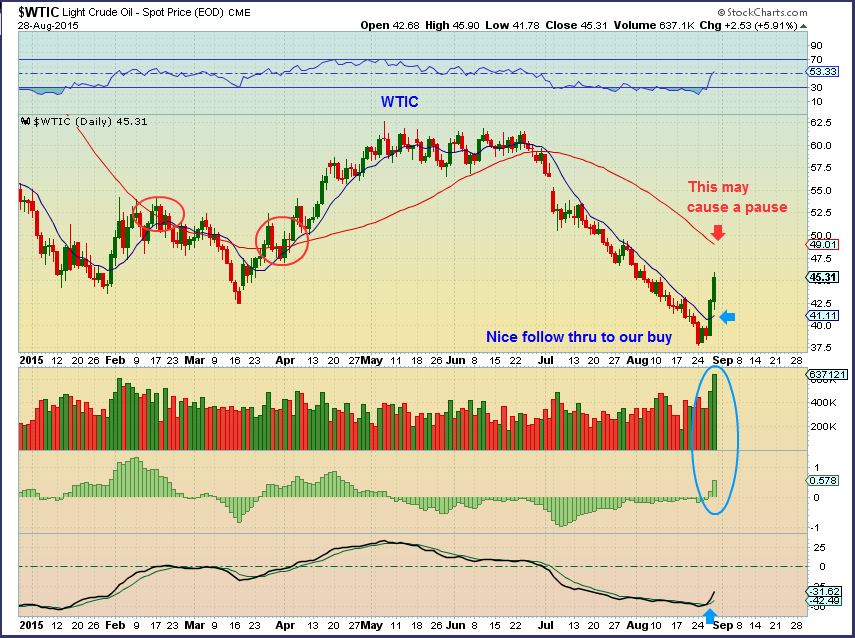
I think OIL will be a buy the dip. A few targets are the $42 support area. See the 10 & 20 sma for possible support, and watch for a reversal. See the left side of the chart for the Feb drop.
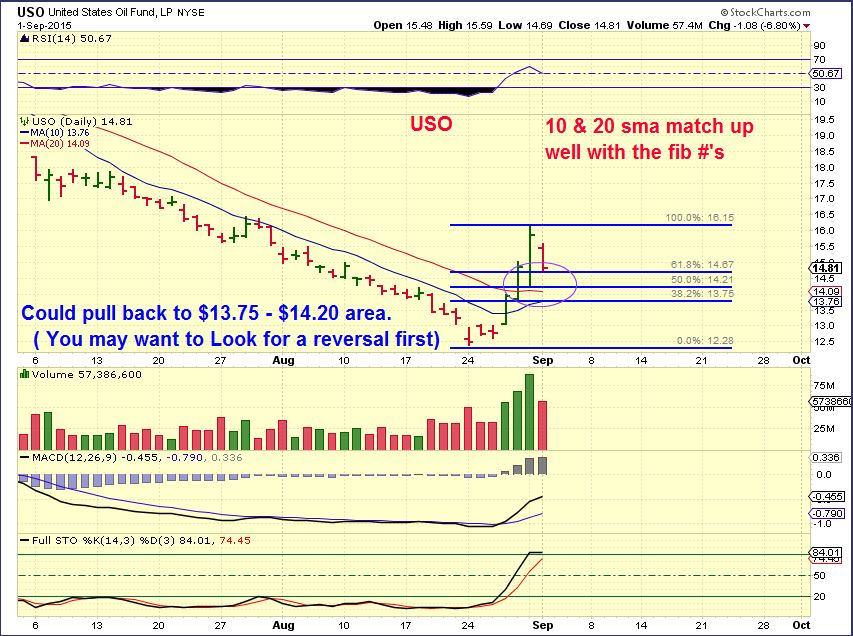
USO – This could set up to be a good entry soon. Again, you may want to wait for a reversal before buying. Your stop will be under the moving averages.
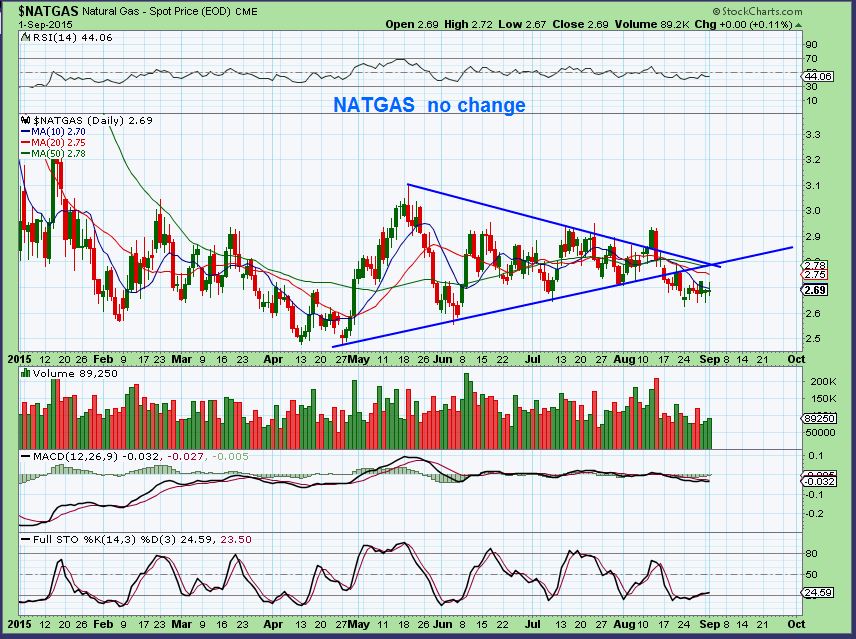
NATGAS– I was asked about NATGAS. I haven’t been covering it because it remains neutral. Not long or short for the past 10 days.
I will cover some Energy stock ideas at the end of this report.
GOLD,SILVER, MINERS
I’m not happy with the inconsistency or lack of sync between Gold and the miners. When this happens, it is best to be a little cautious. No leverage & only small positions until we have a confirmed DCL. Let me explain the issues.
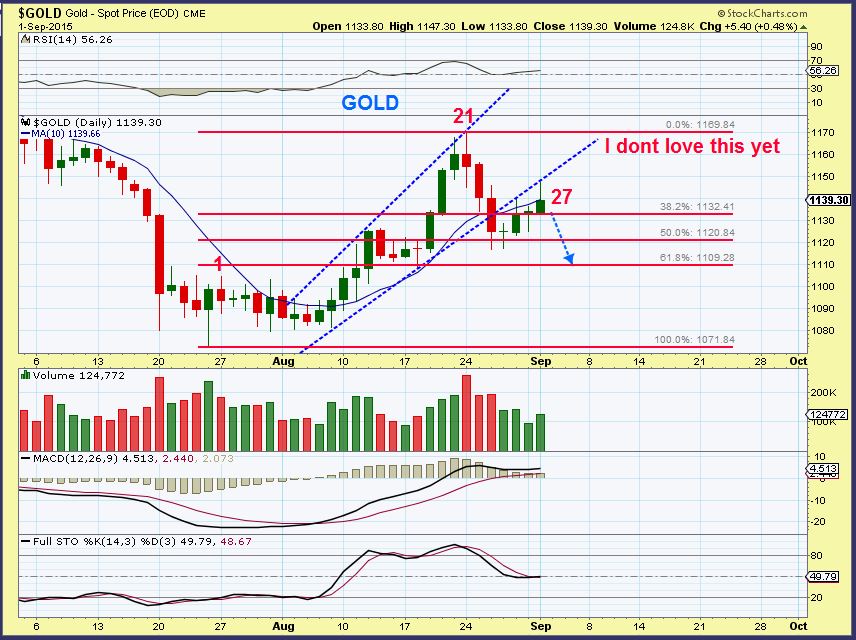
GOLD – I like the “look” of this chart as is. It is also above the 50sma (not shown). All looks fine.
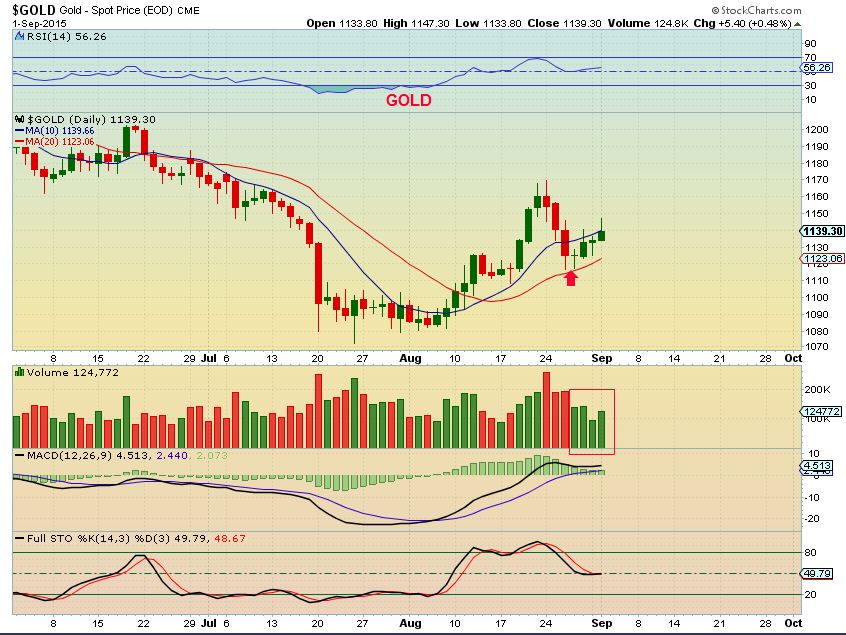
However, I pointed out this trend line. Gold cannot get above it and cannot hold the 10sma yet. On day 27, it is not out of the question that it could do a quick dip lower into the DCL as shown. WHY bring this up??
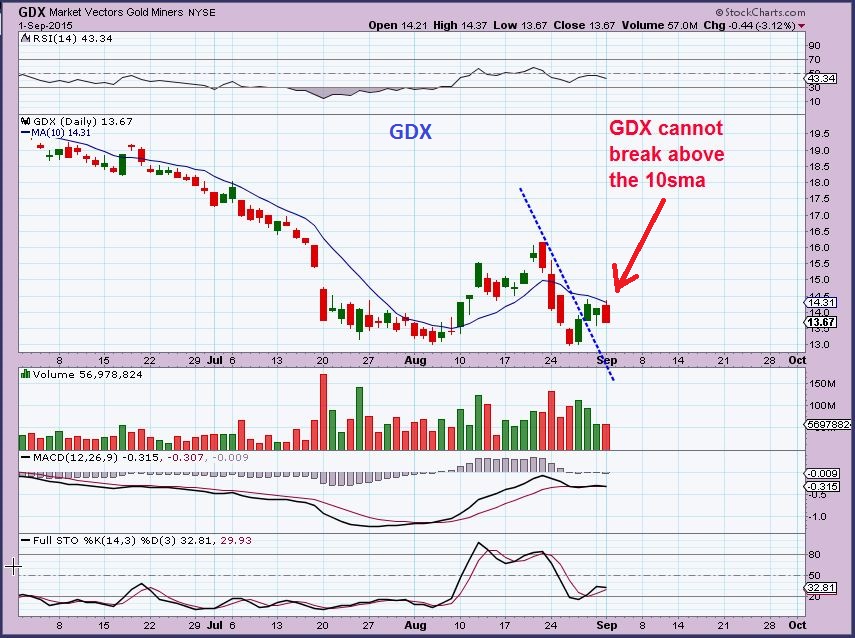
GDX – I am not getting that warm fuzzy in GDX.
This chart I drew up last week to show what possibly could happen if GDX played out like last Dec . A bounce & then a drop. We got the bounce & today we dropped after being rejected by the 10sma. DCL still ahead of us?
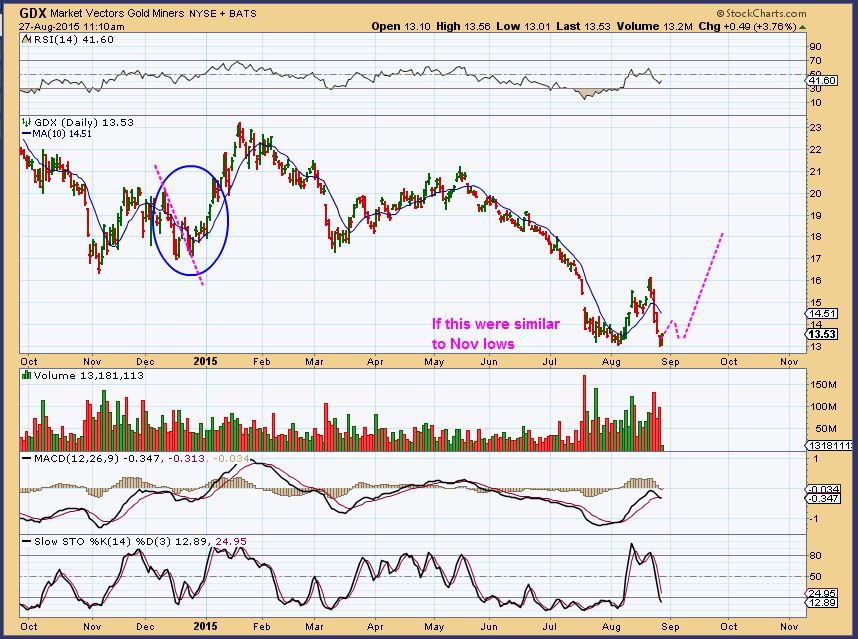
SO I looked at GDX components and they look a little like they could dip down too. 🙁
GG
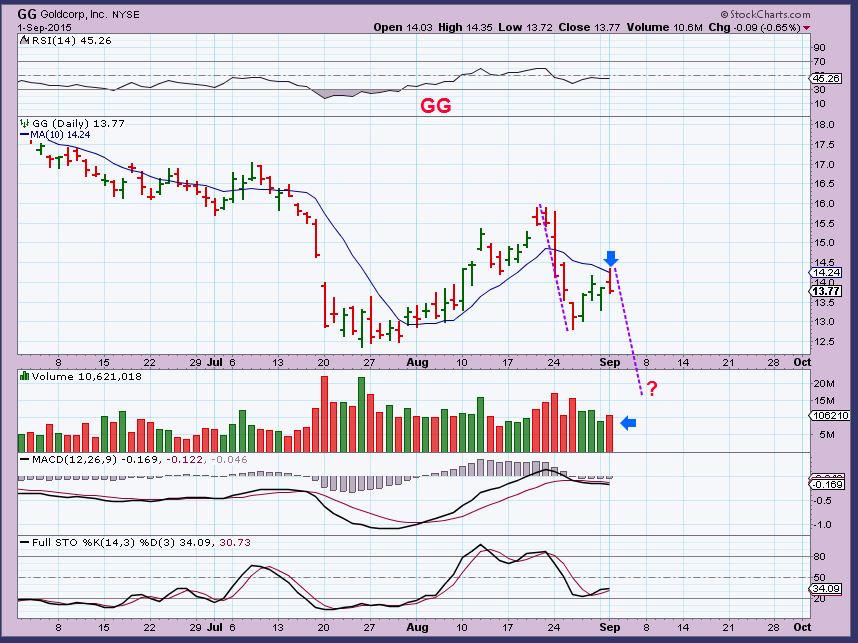
And doesn’t this look a bit Bullish with todays reversal? This is JDST. I’m not recommending it, because yesterday it looked like it was rejected at the 10sma. Today it rose above. GDX was rejected today, could a POP in Gold drag GDX higher? Yes, so I’m just watching at this time.
The way I see things, The Markets are heading down to test the recent lows. If they break down further, we could really have a lot of downside left. In fact, we may test the recent lows, then bounce , and then get another leg down later. The “BUY THE DIPS PLUNGE PROTECTION TEAM” did not save the day. Many bought back in, and got washed back out.
OIL is dipping and I think that this could be a good ‘buy the dips’ opportunity. OIL is already near my price targets. It may be a fast dip . I still recommend waiting for a reversal, but I think Energy stocks are going to do another strong leg higher. THAT is why I wanted to post a few charts.
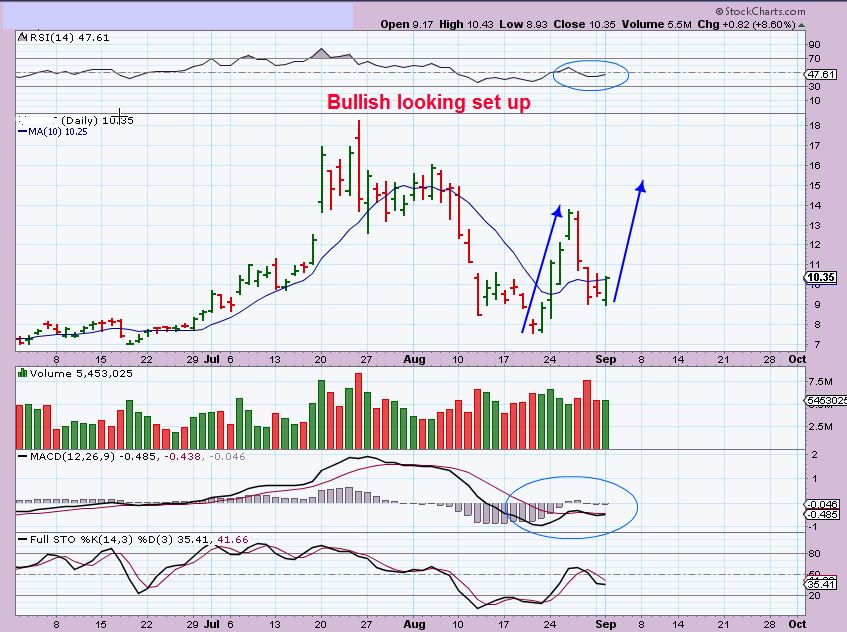
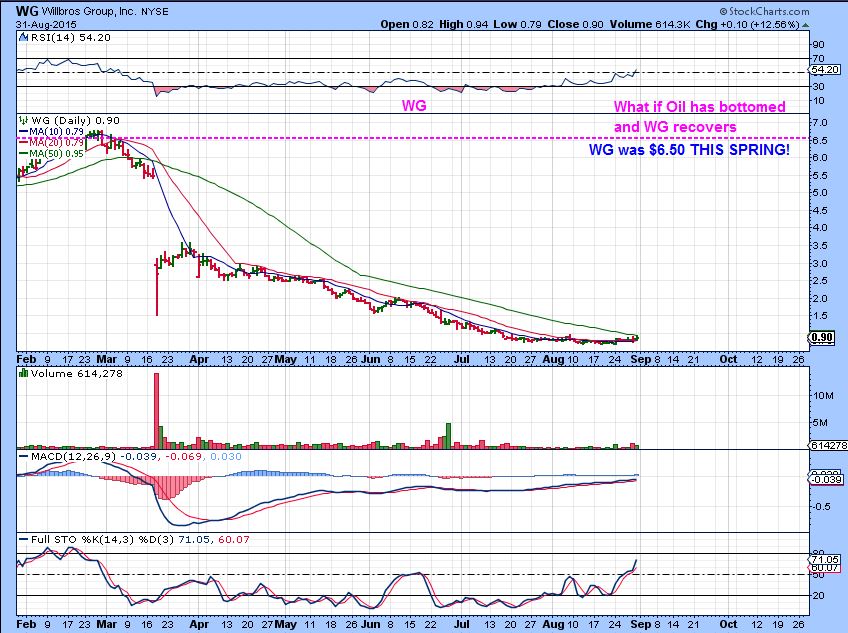
I already pointed out that when nice BASES form under the moving averages, price often POPs when it gets above them. Aug 31 – I pointed out examples like WRES and said that WG looked like my kind of Base.
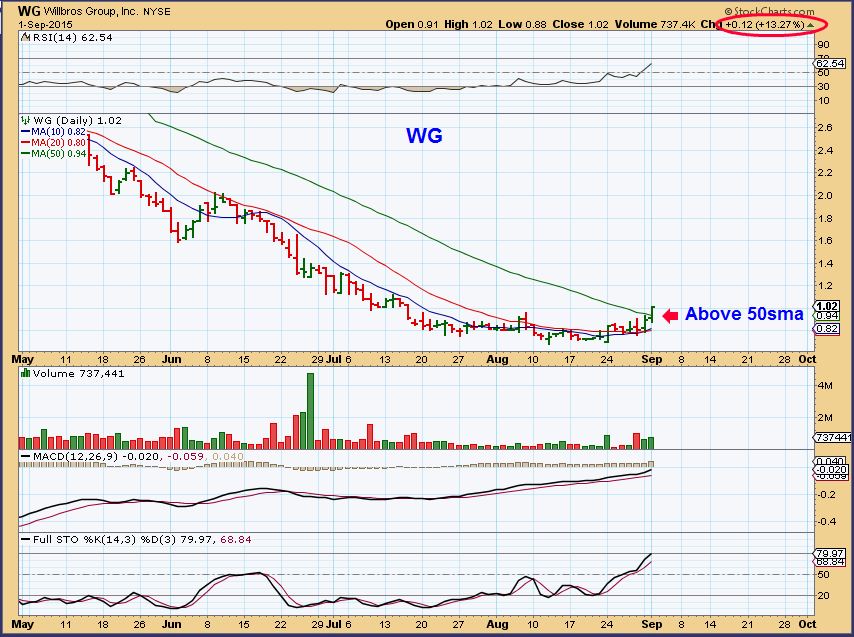
1 day later, As OIL dropped today, WG popped & ran. This is bullish for the Energy sector, because it showed that some can buck the sell off and act bullishly even with oil selling off.
Lets look at some Energy Stocks that ran higher and see how they are pulling back. Is this a buying opportunity? I believe it will be.
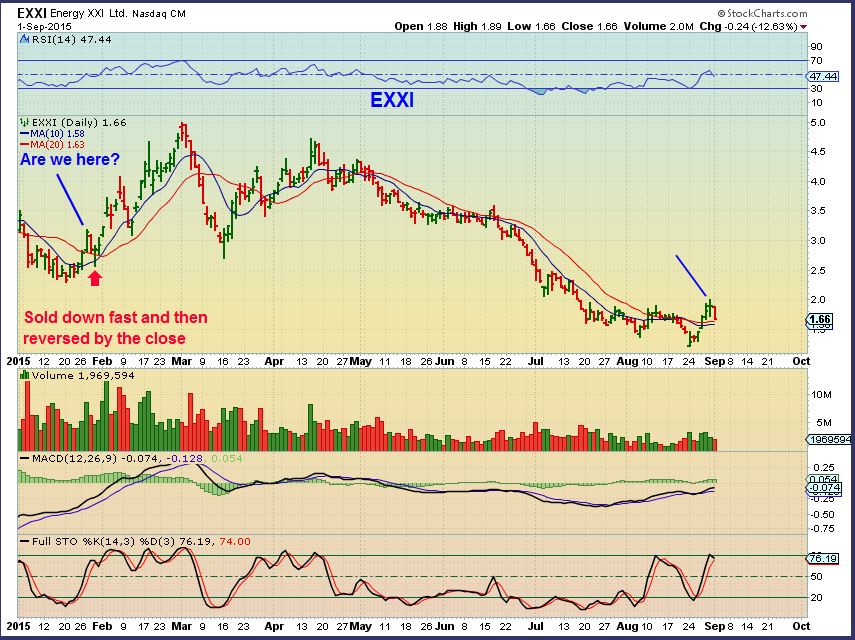
EXXI – It is at support already. In January it pushed below the 20sma and then returned right back above all in the same day. Thats a buy. The run in Jan-Feb is what we may see again with energy stocks.
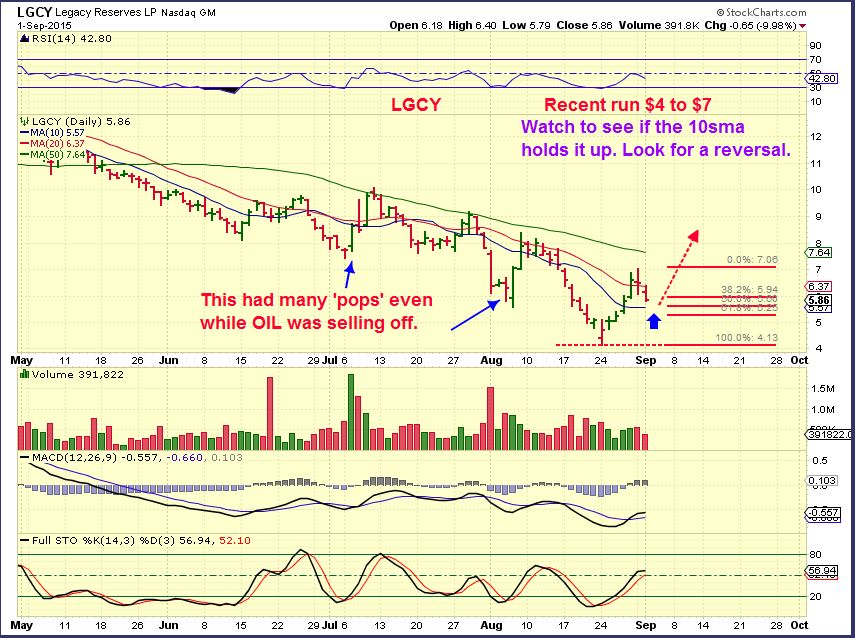
LGCY – This popped several times while Oil was selling off. When OIL bottomed , it ran from $4 to $7 in a week. Almost 100%. This looks like a buy in the $5.50 area. Again, you may want to buy a reversal and put a stop below $5.25ish.
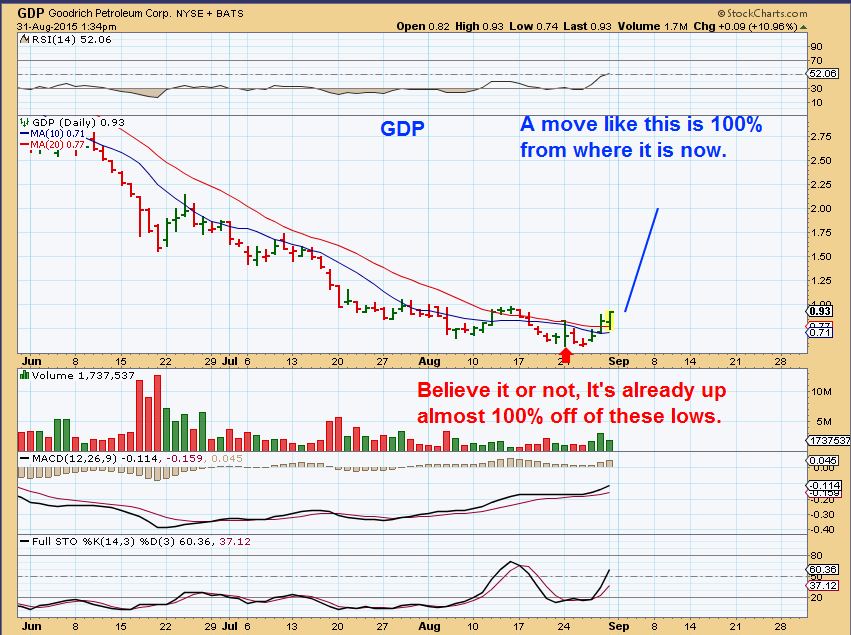
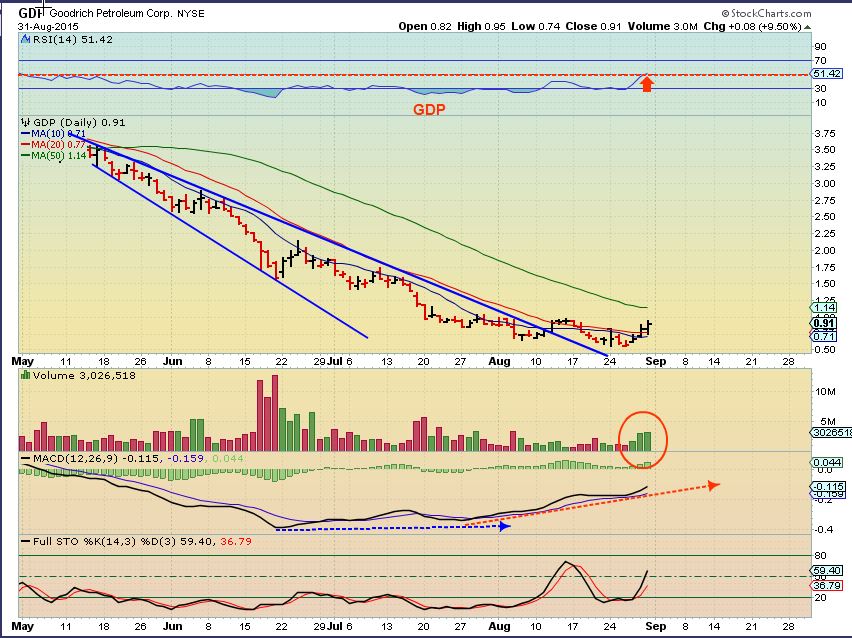
GDP – I showed this pop from a nice base. If it runs to $1.80 ( shown Blue line) it’ a 100% move . It pulled right back to the moving averages Tuesday.
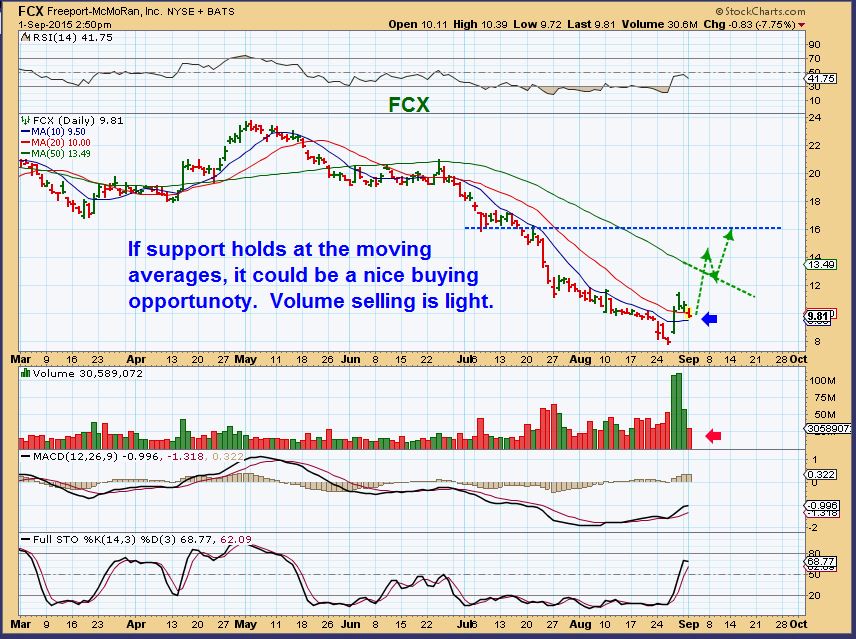
FCX – Remember when this popped with HUGE volume? ( Copper) , It is now drifting back on light volume.
There are many more Energy Stocks that ran up in a big way and are now pulling back, but I cant possibly chart them all. Look up charts of
BASS- EXXI- OAS- LGCY- HAL , FCG, XES, ENLC, TEX, QEP, CPQ. Smaller ones like WRES, REN, GDP, SFY, SD, TPLM, MHR, etc. Make sure that they dont pullback too recklessly. A nice light drop about 50% of the prior run is a good guide , and buy a reversal with a stop right below. I’ll have more in the Wednesday report and we’ll have to see what GOLD , SILVER, & MINERS want to do from here. That DCL may or may not be in. Happy Trading.


Great read as always Alex. Would have to totally agree with the slightly confusing look to gold very short term. I’m not big into EW but have this 1 hour chart of gold which I’m watching closely. The labeling is definitely open to different interpretations but I see a possible completed initial wave 1 up (or a wave iii) at the recent $1169 highs, in which case the corrective leg looks incomplete and would look better with one more short downleg and ideally to the prior wave iv low around the 61.8% ($1110) retracement level. It is of course possible the minor correction is over but hopefully today will help clarify the very short term picture. But either way we will hopefully be seeing fresh highs in September.
Hi Chris, Nice chart. No experience with EW either. I am expecting the same thing with a drift down to 1105 before a further move higher. I posted a Harmonic pattern on GOLD daily Monday I believe to back that up. We seem to be arriving at the same end point using different methods.
I remember the chart Bill but that is one form of analysis I have rarely if ever come across so am truly unfamiliar with it. But certainly intreresting that two very different methods have come up with a very similar target area. I know this action in gold/silver and the PM miners is very frustrating in the short term but there is a part of me that would rather see a much more solid looking base area built and accumulate some long term investment positions that just see a mooonshot that is quickly given back. As bullish as I feel about gold and silver longer term it’s just possible we may have to wait until next year for the real fireworks to begin. But even if so, something to look forward to!! 🙂
Its odd that I see a bull flag forming in Silver, compressing for a push higher? And GOLD appears to have a bear flag forming for a move lower. CF any comments on that?
Just thinking out loud Bill but given silver spiked to new lows last week but gold held up it would seem that in the very short term they are in different and slightly conflicting short term trends. Just to make life a little more interesting!! Lol
Yeah, silver often dances to it’s own tune. On a very short term basis it’s sometimes negatively correlated, for very short periods. http://schrts.co/N75AW7
Actually, I can now see a H&S pattern forming on the chart. That would again signal an 1105 area for a pullback. Also, an AB=CD pattern from the top with a bear flag forming currently. Refresh for H&S pattern.
Nice analysis Bill.
now that’s a nice harmonica….. ;o)
Now, having said all that about GOLD, I think the miners are going to go down just a little. I can see GDX moving down to the 13.14 area, its at 13.67 currently. NUGT 2.71, JNUG 6.85. We’ll see shortly
You think triple bottom on GDX? How many times can (near) 13 hold? That really makes me nervous.
Thanks for chart on gold, if we get 1105, I’ll probably go in pretty heavy.
No, not quite. I see maybe 13.16 as the low. I think the lows around 13 are THE lows.
Closed well off the lows, maybe that is encouraging? I won’t be touching again until after Jobs Report.
hey chris… et al .. what do you think about this for Gold?
looks like… 5 truncated & wave 1 up .. is underway
https://www.tradingview.com/x/HxZumeRv/
Maria, so you think were moving higher from here? Correct? I hope you’re right. To me Gold looks doubtful but silver looks promising. Is that possible? CF?
well… that’s why im asking .. what you guys think….
you know im not a real Elliotician.. i just play one on tv ;o)
with EW .. there are always ‘alternate’ counts.. this could be wave 1 of 5 up (impulse) orrrrr
it could be wave 2 of 5 down- you know how wave 2 can retrace 99% of 1…. (and can also be an impulse)
hows that for complicated? either or .. eeeny meany…
All the possible alternate counts certainly get my head spinning, which is why I never persisted with it. I ended up with so many possible alternatives it confused things for me rather than clarified them. But each to their own and what makes this site such a great melting pot of ideas. I always like to see someone else’s point of view. 😉
exactly… i also love to see bill’s harmonica … LOL i mean harmonics…
(i left that in bcuz it was just too funny .. — darn autocorrect – that belongs on Ellen’s texting segment.
You can’t beat a nice ‘harmonica’!! 😉
oh my….
lol
Nice to see you here today Maria…U were missed yesterday.
Hey!;-)
I’m far from an EW expert but I’m not sure I have ever seen a wave 5 that truncated and the following wave 1 up doesn’t look overly impulsive to me. On my 1 hour chart below which is a ‘continuous’ price chart and thus feeds 24 hours a day, it looks more choppy and overlapping and thus more indicative of a corrective rather than impulse wave. But only the way I’m seeing it and by no means correct but another day or two of price action should reveal all!! 🙂
ok ..tx chris… just throwin that out there…;o)
Here’s the conundrum for me with GDX. I see the blue candles (BLUE) as the path GDX took in a similar move out of the 2nd DCL. Yet, I also see a harmonic pattern (YELLOW) pointing to lower prices (red circle). Time will tell, I guess……….refresh for the chart
Using my simple 1 hour chart I currently have GDX short term bearish so I for one would go with potentially lower prices in the very near term. It certainly looks worth being partient for a bit longer if a potential buyer.
We need the dollar to roll over here soon. So far there’s a day 4 DC high, which would be expected for a very left translated (and therefore weak) DC. Maybe a rejection at the 20 DMA again soon.
In accord with Alex’s oil call in today’s report it appears it may be getting the ‘bit between it’s teeth’ sooner rather than later!! Up more than $1.50 in the last couple of hours.
Interesting that silver, copper, platinum, palladium all just popped with it, but gold, nothing. No real dollar movement there either. No idea what that all means, but it’s interesting.
GDX holding up decently given gold is down a bit more.
Vol in GDX is light too on this selling, so far.
I’m not sure but I think there was some data/figures released, which may have caused all the ‘pops’. As you say they were all over the place. So might be just a short term knee jerk reaction to a bit of ‘noise’ that eventually amounts to nothing!
Possible H&S
I had exactly the same thought Alex as it gave up the earlier ‘pop’!! Now it’s looking like a possible false break of the neck line and a possible ‘bear trap’!! Wonder what it will look like by the end of today!! Lol Maybe the second ‘c’ was the correct one all along although I can’t make head or tail of that possible correction pattern as it stands from an EW point of view. But nice touch of my broken trend line as well as the 200 period ema which had been capping prior rallies, so would be ideal now if acts as support to short term corrections in a new bull trend. 🙂
One thing I notice about gold here is that if it has put in a DCL then it’s trying to get above an up-sloping 10 DMA here which would be very unusual (only exceptions I see are during strong runs up to interm tops in 2010 & 11), as it’s usually down-sloping or flat coming off a down slope.
That would imply another dip down to the DCL. Of course if it doesn’t do that it implies a lot of strength and a very strong run up thereafter.
OFT, You have a chart to support this? I would think coming out of all DCLs Gold would get above the 10sma?
That’s not what I said. Question is, up-sloping or down.
The 10dma is down-sloping and crossing the 50dma. Negative vibes
It’s not down-sloping yet; flattening today. And not near the 50 DMA either, yet. We’re talking gold here, of course.
2014 (refresh)
Ah, yes. Missed that one. Hard DCL to call too, no surprise.
Let’s hope that we see that kind of run up here soon! It’s certainly within reasonable expectations for the 2nd DC here.
Yeah, the ‘delay’ is boring me to death
Sorry, I was looking at the 1hr chart
Nice analysis, I’ll add that to items I am watching on that chart.
One good sign for GDX is that the volume has been very low since the intraday high. FWIW
38.7M today, lowest total since Aug 14th and 2nd lowest since low vol period in July.
Alex, not trying to rationalize the moves (lost too much money on that ‘system’), but wondering if we’re expecting the general market to turn down wouldn’t we expect the same for oil? Or are you thinking this may just be a bounce and sideways move for awhile? Thx in advance.
Great question! I had same. So for now I am keeping position size just a bit smaller to help manage risk. Sure, can cut profits but we’ve seen some wild action last 3 weeks!
yup, definitely lots out there to keep me nervous as well. Keeping my positions very small as well…when I try differently (recently) the smack down just hurt too much!
Anyone seeing this scenario in the GDX/J?
LOL…yessss.. that is what i posted this morning for gold.. that it may be in wave 1 impulse (1 of 3)
im glad you see that…..
it’s but ugly tho…. in terms of a 1of3…don’t you think? should be more impulsive…feels like sideways/correction and not the ‘urgency’ and FEVER … HEAT of a 3rd wave……imho…just thinking outloud…
its not the 3rd of the 3rd just yet tho’!
in that choppy 2nd wave of the 3.
does look like an ending diagonal in the 5th of the current C wave, doesnt it?… kinda petering out (price now at 19.40 as i write)
u know what ima gonna say…..
… show me … show me :o)
.. this contracting structure on the 1 min chart..
and you might even be getting a truncated mini 5th wave (in there as a special bonus for Maria)
lol… ohhh Maria…. so spoiled…. 😉
.. and 3.i.3 was pretty much vertical!
btw.. wave 1 doesnt have to be impulsive , does it?
can carry over characteristics of wave C or 5.. .. even to the point of being a half-assed diagonal
ha ha ha…………………….
yes?
SOG…. or “sonnnn” (in a twangy voice)
this is what im currently watching in GDX… i ‘think’ it could be a double zigzag…
https://www.tradingview.com/x/7A2cLn7v/
yess mommm…
well if your double z/z means more downside, we need to get Alex on the case ASAP, to stop it happening 🙂
incredible FIB on GDX..
(refresh)
wow… crazy…
Energy update
Like BTE and took a long position.
(refresh)
hey Xavier.. do you know which are the most traded & liquid energy stocks? (ie. out of the ones that Alex recommends)
aha..,, just refreshed and seen the volume column on your list…thx!
here’s Alex’s list by volume
http://www.finviz.com/screener.ashx?v=111&t=BAS,EXXI,OAS,LGCY,HAL,FCG,XES,ENLC,TEX,QEP,CPQ&o=-volume
OAS top volume!
even better… thx again
WAIT JUST A MINUTE! What list is that? Wheres REXX, LGCY, EOX, WRES, CRK,WTI, ?? I’m watching 70 Energy stocks : ) – LOL, I’m buying 1 share of each.
ok A..
if you just had to pick a top 5, which would they be?
would you recommend a basket etf like DBE?
I haven’t studied for a top 5. I am a visual type of trader, I have to see how it acts on the pull backs, but see my post above for examples of what I like to see. Many are acting correctly.
ok gotcha
I added to that while you wrote
the AB=CD thing, i presume
http://www.finviz.com/screener.ashx?v=111&o=-volume&t=BAS,EXXI,OAS,WG,LGCY,HAL,FCG,XES,ENLC,TEX,QEP,CPQ,WRES,REN,GDP,SFY,SD,TPLM,MHR
here’s the full list you included in your report http://www.finviz.com/screener.ashx?v=111&o=-volume&t=BAS,EXXI,OAS,LGCY,HAL,FCG,XES,ENLC,TEX,QEP,CPQ,WRES,REN,WG,GDP,SFY,SD,TPLM,MHR
so awesome.. thank u for putting that together frenchie :o)
you’re so welcome!
omg
Interesting that CRK remains so strong. Was hoping to add to my position on a more substantial pullback but we may not get that.
Possible Bull Flag (but I thought that early in Aug too, and it slapped me
im ok with that… 😉
BAS pausing at resistance but did not sell off much with WTI selloff past two days (prior to PM reversal); solid volume, too. Definitely in Beast Mode.
agree…im happy
I dont know if this is it for a pullback in Energy , or another couple of up & down days, but right now many pullbacks looked excellent and there was some buying at moving averages. Refresh & Check out LGCY here, but EXXI was even more perfect (so far). REXX, BBEP, BTE, (EOX on the 50sma)
Alex, going back to a post a few weeks back on target/time – are we still on target for our planned time with GDX? I was feeling good until yesterday. The way I had it mapped out, the 2 months would be mid-September, thinking the top of the 2nd DCL might be at about that time – also very interesting since that is also the time of the next Fed Mtg (16-17 Sep)!
I thought that we had the DCL on miners last week, but now, obviously am not so sure of that anymore. Waiting for a hold of the 10day and real move up; not making any more adds before Jobs Friday either. Hopefully, we can put the lows in this week and move up after report. Def not comfortable bouncing around down here anymore.
Interesting end on Wall Street today. Bullish close at the highs? Market breadth 3:1 adv:decline today. Posted ‘stocks above 50-day SMA”. This is off the NYSE. Notice clearly the lower highs all summer which was ‘under the hood’ of the sideways movement and even new highs on S&P. But was that a potentially significant low short-term last week? Maybe? 50 day is a bit of a lagging indicator, better for confirmation than timing. 20 day chart looks similar but less rounded with more exaggerated moves. China stocks closed for next 2 days (thank goodness). Could be bullish at least through Labor Day. Could that be enough to us up to 50/200 day? 120 points is a long way!
I’m thinking along very similar lines to you Cason. Think this bear rally has further to run short term and might even get closer to major breakdown levels (2040 S&P, 17,000 DJI) before topping again, which would also see us back towards those potentially key and now falling longer term MA’s. I’m personally expecting a lot more carnage this month and posibly into early October, so would be looking for new shorting set-ups and anywhwere close to those levels in the next week or so would certainly provide them with nice tight stop loss levels. For various reasons I still have a potential downside target for DJI of 14,500 or even lower. That would potentially offer great risk/reward ratios in the x2 leveraged inverse ETF’s if we get anywhere close to those higher levels in the coming days. I’ll be sure to post if I see the set-ups.
C.. was recently trying to get a long term EW for DOW.
what do you make of this one?..
(obviously the future C wave is pure speculation)
or this one..
can’t really suss out whats going on with that expanding top!
(again,.. take or leave the nature of any future ABC correction)
Hi SOG. Fascinating to see this one in particular as I’ve had something similar to this mapped out for literally years beleive it or not. It is open to all sorts of labeling but one interpretation is that it is a massive expanding wedge so the low in 03 would be labelled A ,07 high B, 09 low C 15 high D and 2016/17 low or 21/22 ?? E. And yes I would totally agree with that potential downside target for the Dow being back below 6000!! The few people I’ve shared that with think I’m nuts and it just isn’t possible but the reams of research I’ve read over the years make me believe its not only possible but almost inevitable as it will involve the whole financial monetary system having to be reset as the ‘fiat’ currency system finally fails. I don’t know if you have ever heard of Kondratieff and the MAJOR cycle that he proposed exists in markets but there are four seasons to the cycle and we are currently in the ‘winter’. This follows the Autumn (or Fall) when there is an explosion of debt and credit fueled expansion, which ultimately becomes unsustainable. The last Autumn was the roaring 20’s!! The Winter, amongst other things, purges debt from the system. During the last winter (1930’s) the Dow dropped in excess of 90%!! The Central Banks have kept things elevated far longer than I believed possible by piling more debt upon debt but I have always believed that there will be a day of reckoning and ultimately the underlying market forces will once again purge the system. Once that is over Spring arrives and a new secular bull cycle begins and we start the whole massive cycle once again! But a LOT of pain to come between now and then I fear!!