
ANOTHER STEP CLOSER
Lets see how the various market sectors continue to march toward their next big move.
SPX – Many thought that the recent sell off would recover straight up like the one on the left last October. Did you notice the back tests recently? These are acting like resistance points.
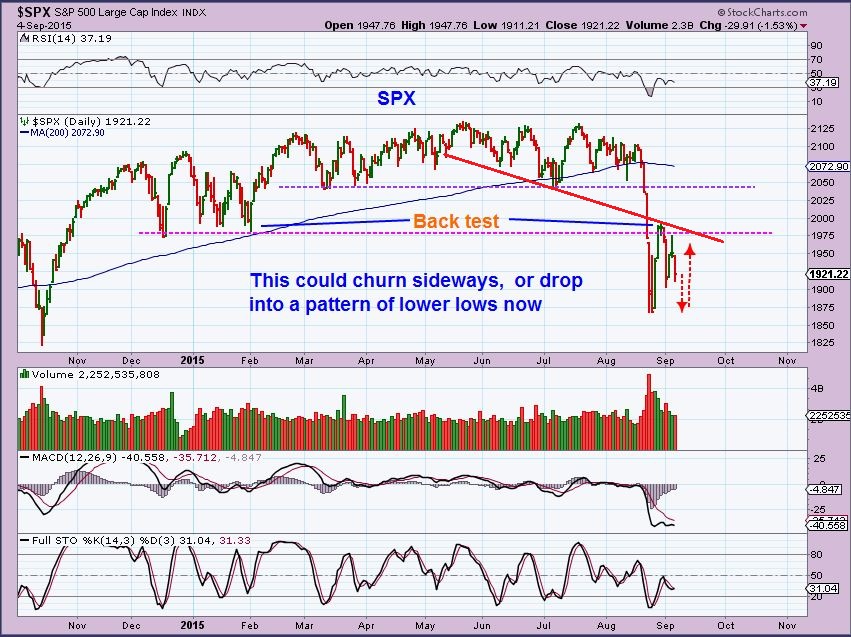
Lets look closer…
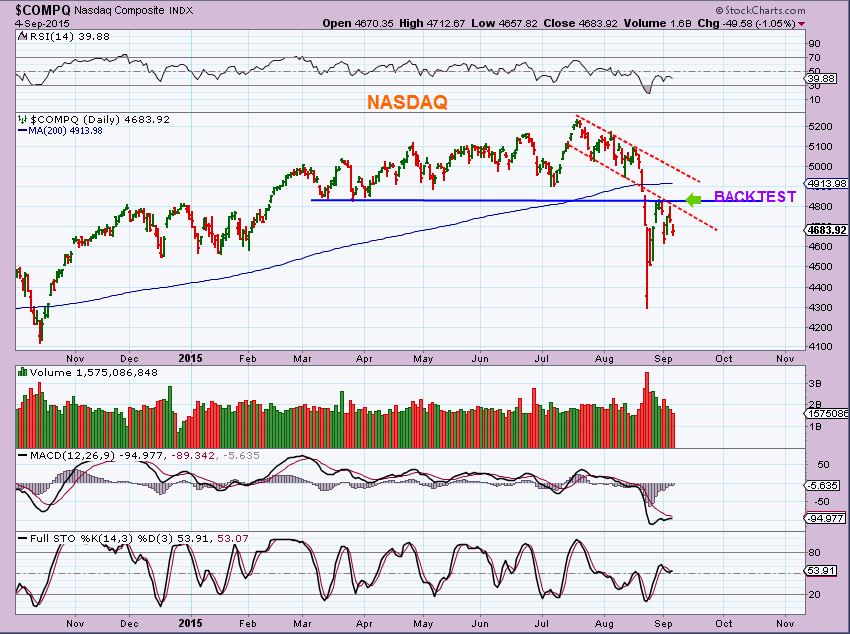
The NASDAQ has been one of the stronger sectors, but when it broke down it bounced up and was stopped at resistance too. This will likely drop down and test that high volume candle at some point.
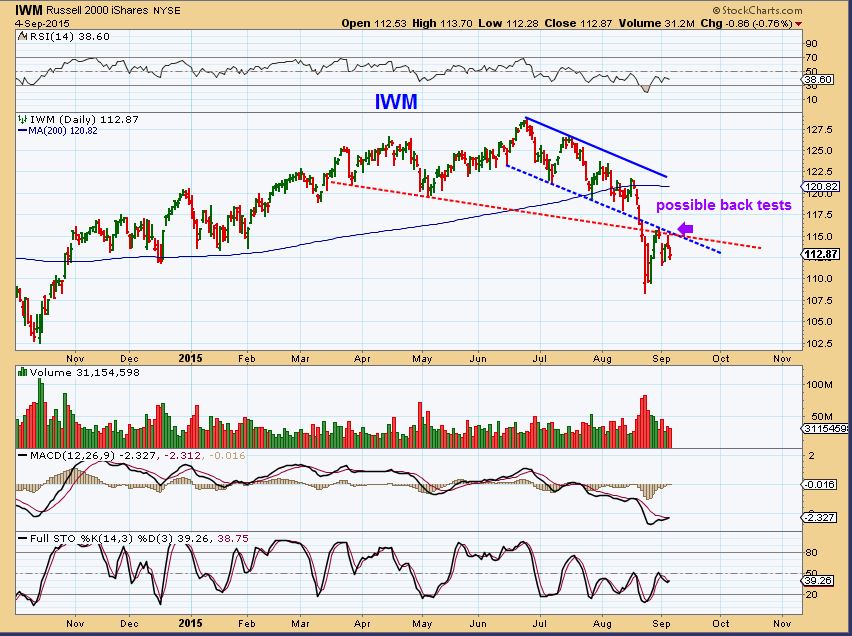
IWM – Same story here.
Review-
I have been mentioning that I think the markets have topped. At the same time I think we are seeing commodities bottoming and we could see money start flowing from one to the other. With that in mind, lets look at prior TOPS. I keep hearing in the comments that we missed the opportunity to go short.
.
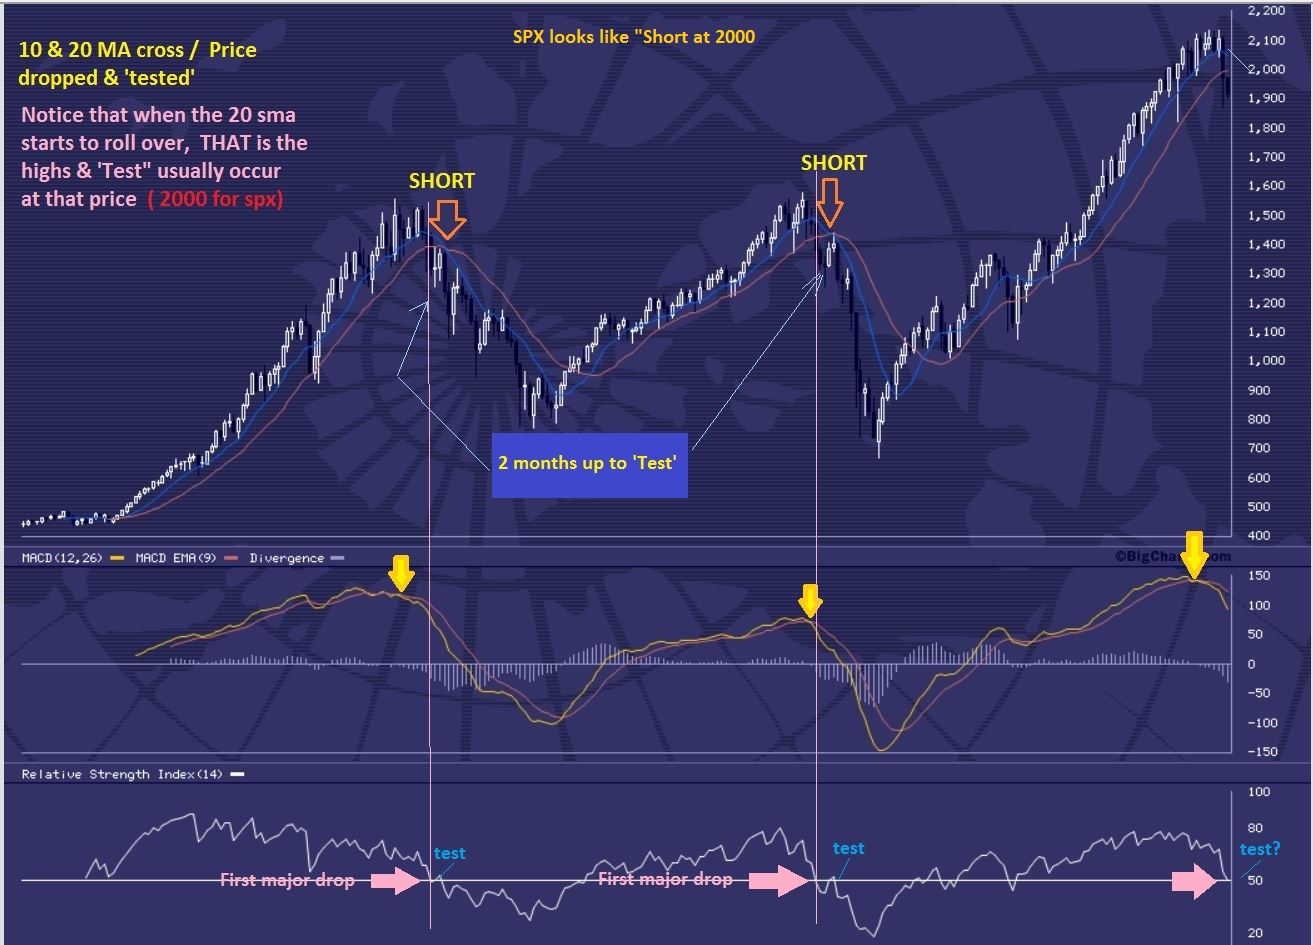
SPX MONTHLY TOP
Notice that prior Major Tops had a solid drop 1 month, then a green candle the following month. Eventually the 10sma crossed below the 20sma on a monthly basis (red arrow) . We have not seen that yet. The MACD crossed down ( we have seen that now). The RSI crossed below the zero line. This all happened at the top, there was a lot more downside to follow.
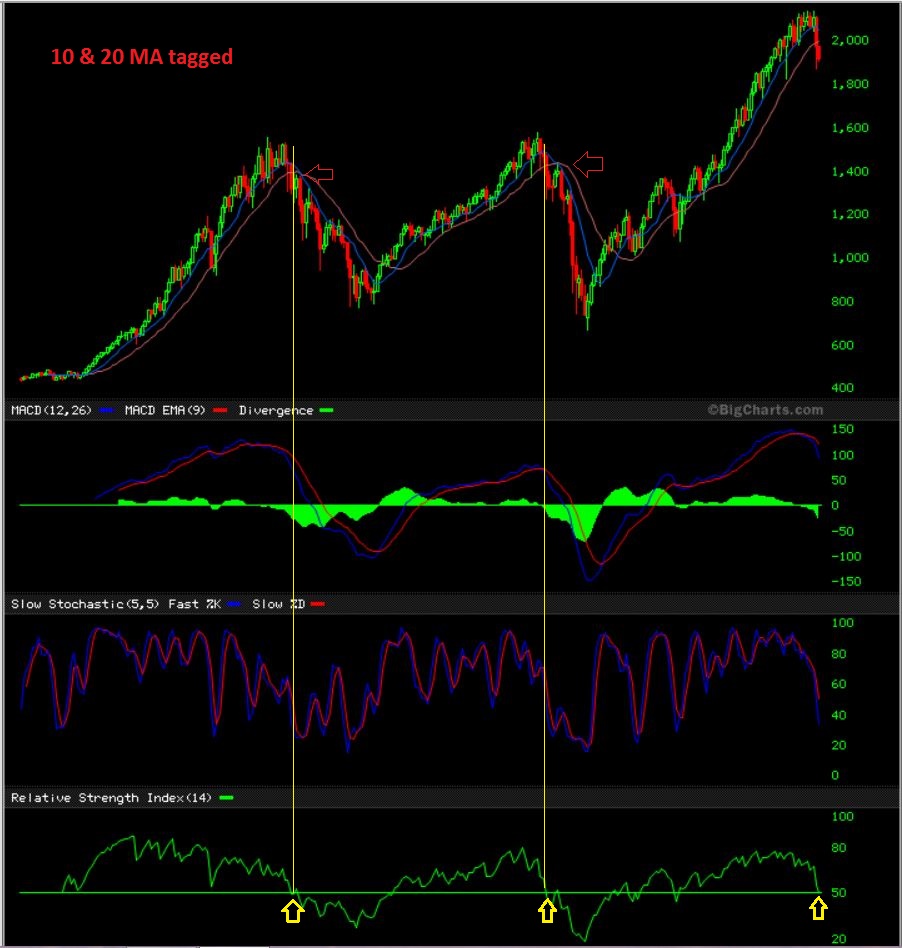
Unfortunately , the first chart that I drew showed down days in black candles, and its hard to see here. What you can see is that in the following month or 2 a white candle rises and ‘tests’ the 10 & 20 sma (monthly ). We have not seen that yet, it was 1 or 2 months later. THAT will be a good place to short if we see that around October.
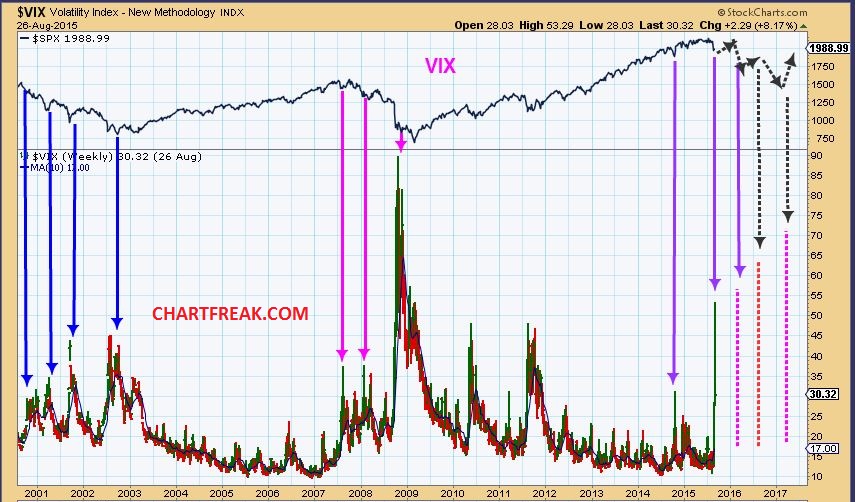
Someone emailed me a week ago and asked something like, ” If the VIX just had one of the largest spikes seen, and it almost compares to 2008, how can we say there will be further decline?” That wasn’t the exact wording, I can’t remember the exact phrasing. In other words, did the VIX just max out? I drew this a week ago & forgot to post it. Picture that the markets keep popping & dropping ( Top box) as the Vix keeps spiking higher & higher with each drop. In between each Vix Pop would be a drop or bull flag in the Vix.
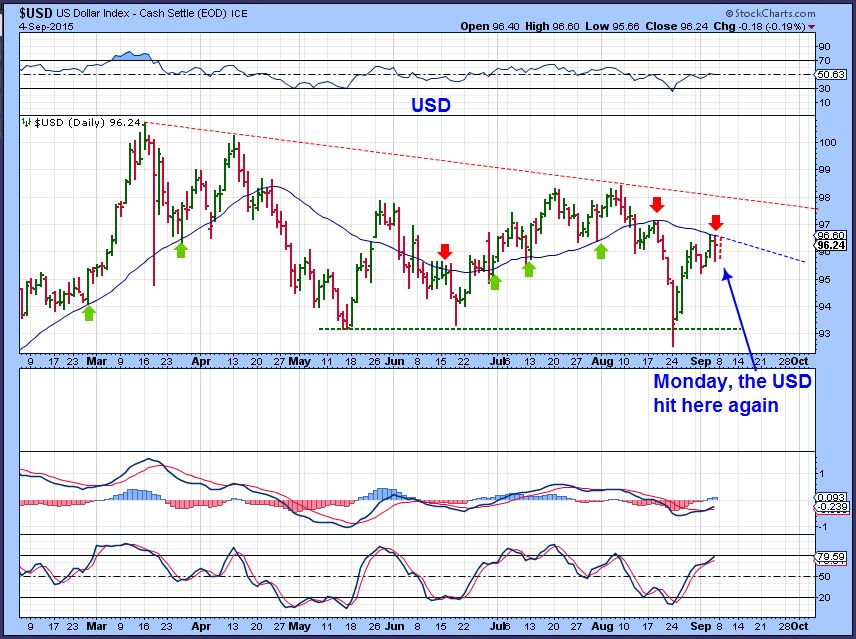
$USD – Could rise to the red dotted line and then we’ll see how it looks, but I have been saying for a long time that internally I see weakness. That changed a tiny bit, but not much, it still looks rather weak.
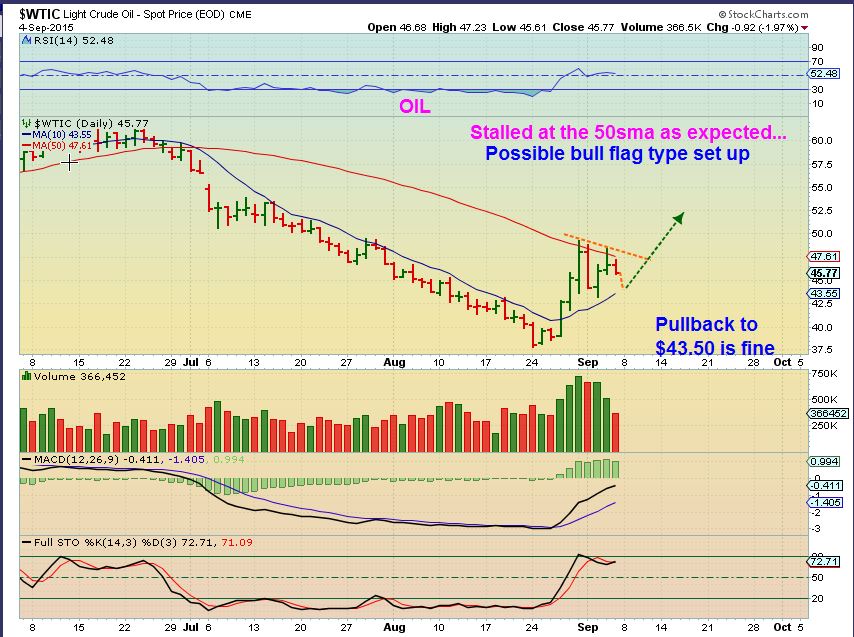
WTIC WKLY – OIL remains bullish and still oversold, buy the dips.
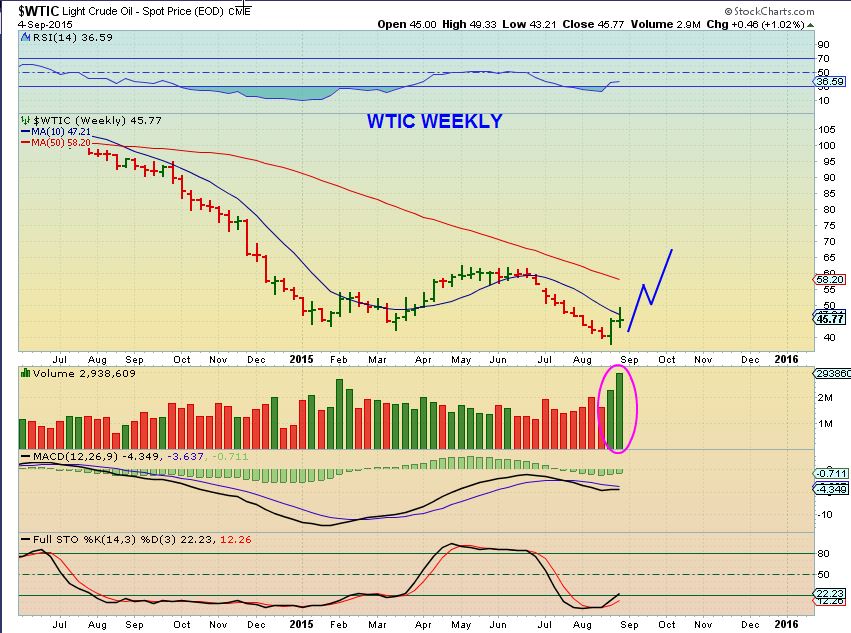
WTIC – stalled at the 50sma as expected here, and could be forming a bull flag type pattern. $43.50 is fine.
NATGAS I remain neutral ( see the last report) .
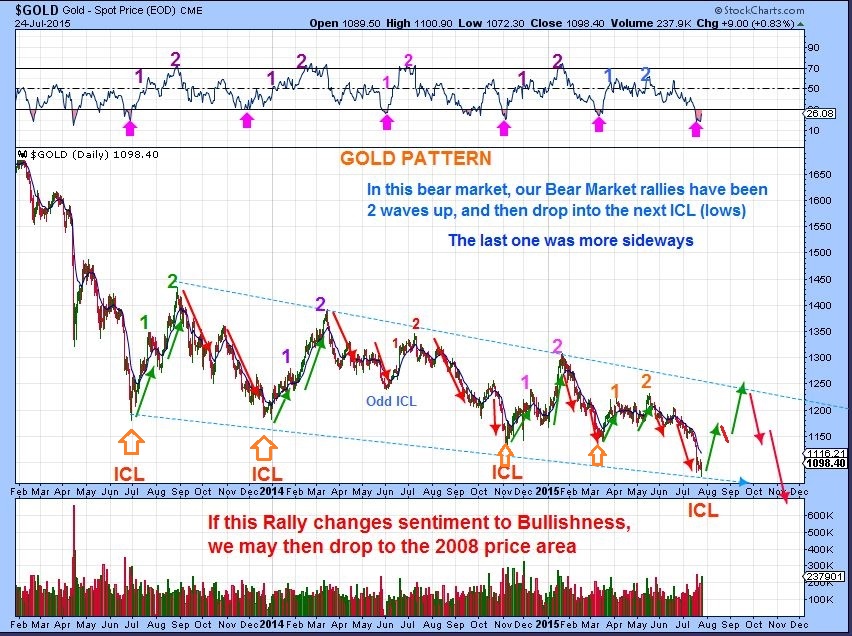
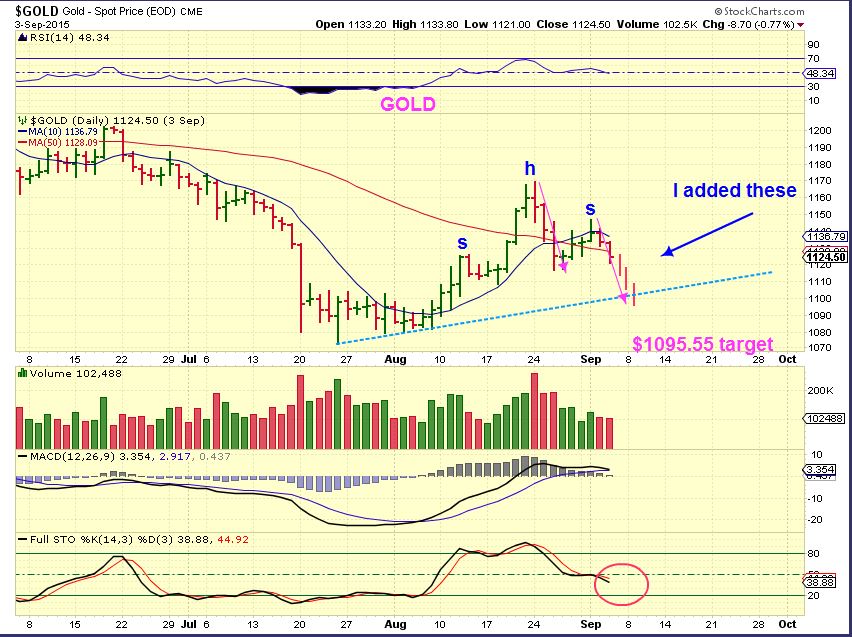
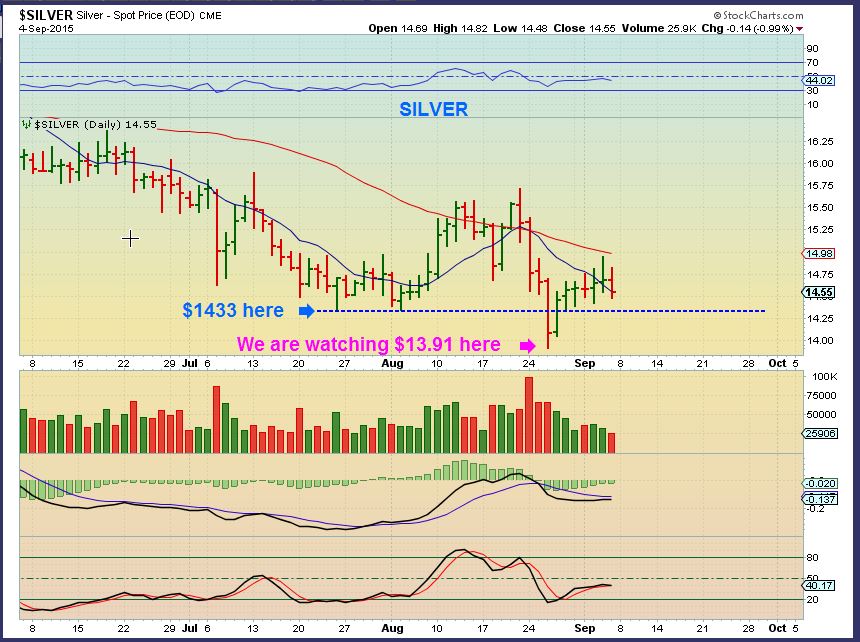
GOLD, SILVER, & MINERS
I was asked in the ‘comments’ to address something. He felt that cycle -wise we didn’t have two stages higher from the March 1025 ICL and the May 2014 ICL. He feels that the ‘peak’ happened in the first daily cycle, and fears that may be happening now. That is not true. This is an older chart that I drew this summer for someone else, but it shows the 2 moves higher using cycles and then the roll over to the next lows. We are currently waiting for the 2nd leg higher in Gold. The 2 time periods pointed out in the request are shown.
BASIC GOLD CHART as of Friday
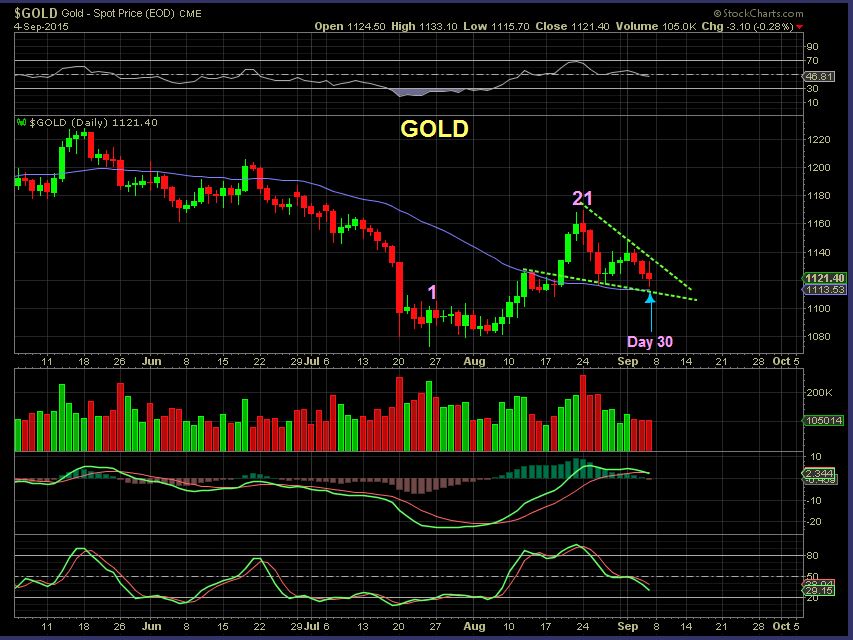
GOLD CYCLE COUNT – Day 30 was Friday. I actually thought that Gold could drop Sunday night and do another stop run. We didn’t and now Monday was day 31.
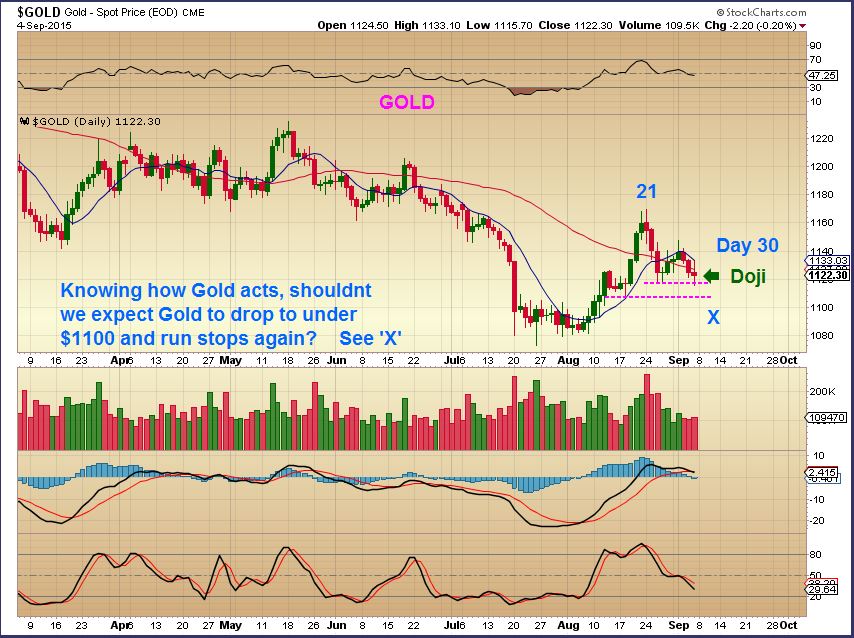
GOLD – Since we are on day 30 (Now 31 after Monday) It is time for a dcl. I pictured this if we did drop to do the stop run. I had a $1095 target if you take the H&S pattern and use the drop from the top of the head to the neck, and use it as a drop from the top of the shoulder. A-B-C-D style.
SILVER – These are 2 important numbers to watch for with Silver. I would expect the shake out to $13.91 to hold up.
I want to go back to a chart that I drew a few different times. This one was Aug 27, and I was showing that after a daily cycle low (DCL) is in place, you often get a bounce & a drop that shakes out new buyers. See it in December? So a drop in September was expected after the lows were in. Repeat after me….Bounce /drop. Bounce / Drop. Bounce/ Drop.
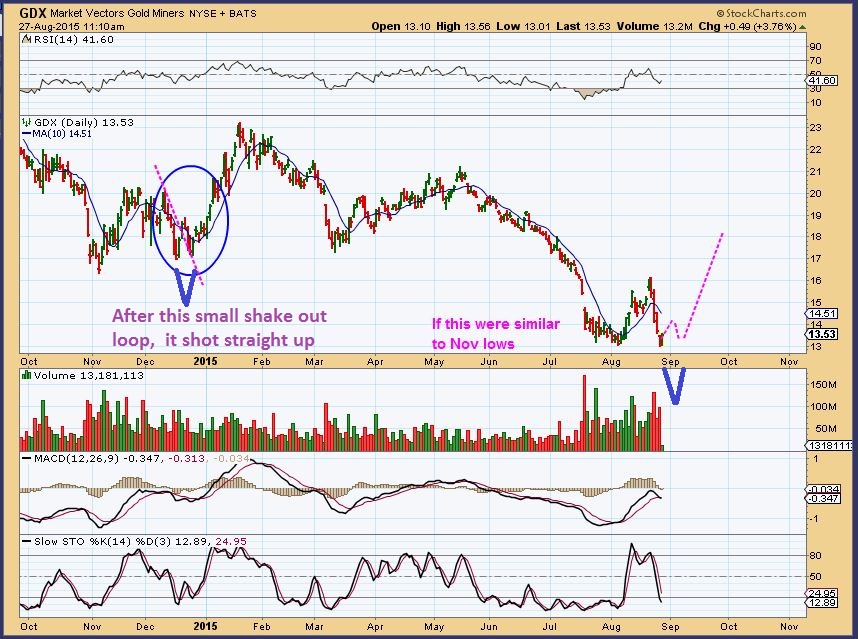
GDX – Bounce / Drop. Friday we see a reversal with Gold still down. Will it hold? Tuesday should give us the answer.
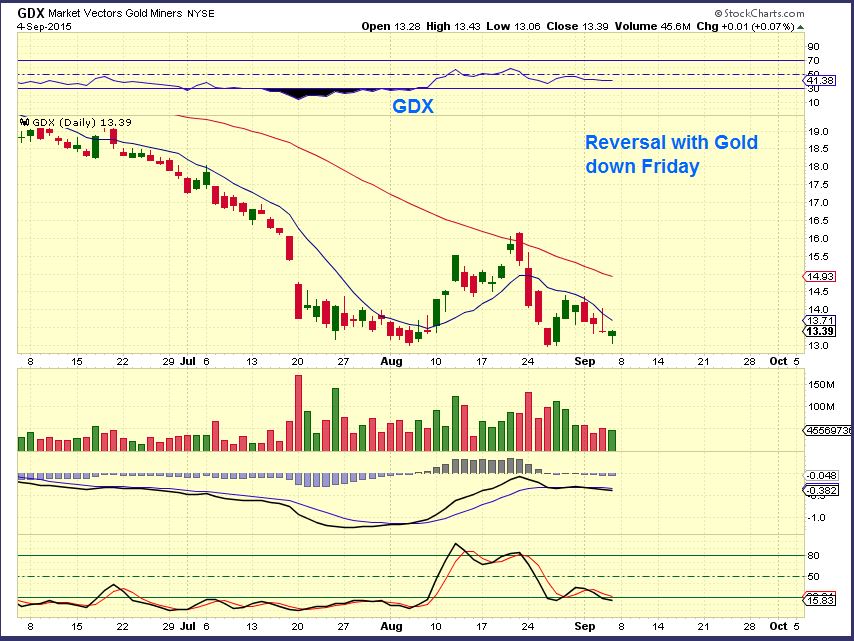
GDXJ – Bounce & drop. Gold was down Friday, and Juniors also put in a Reversal Friday. Price is pushing against the 10sma. A break above the 10sma would be very encouraging.
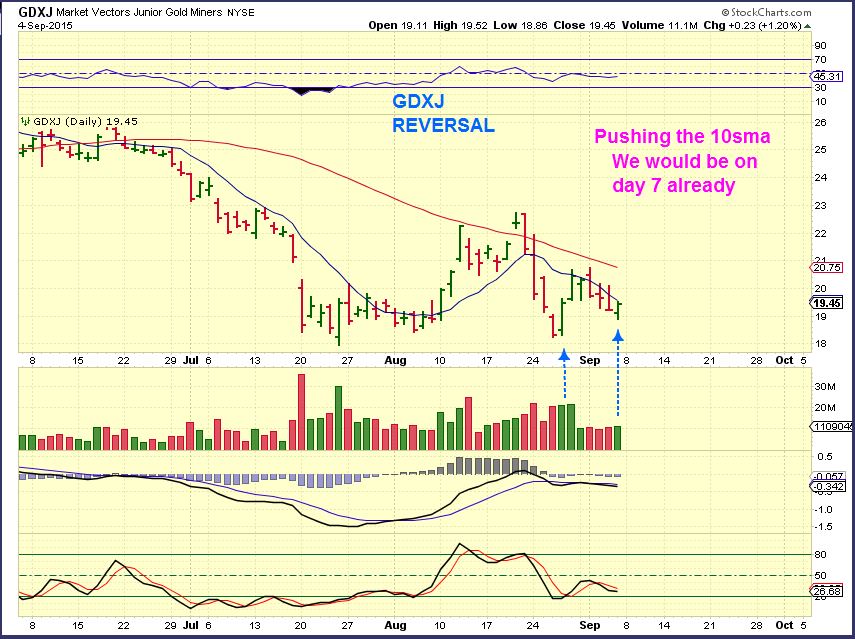
If you go back to the report that I wrote Friday, I said that the main reason that I wrote a Friday report was because I was seeing a bullish pattern in Miners as of Thursday. With Gold selling off, they dipped and revered Friday, both GDX and GDXJ closed green. We will have to see if there is any follow through on Tuesday. Gold is getting quite late in it’s cycle timing (Monday counts as day 31 ). A low can form any day this week, and we may see Miners leading the way, as they often do.
.
Look at this chart of NGD – That is a nice looking bottom forming. Gold was down Friday and this was NGD with strong volume, recovering the 10sma and pushing the 50sma.
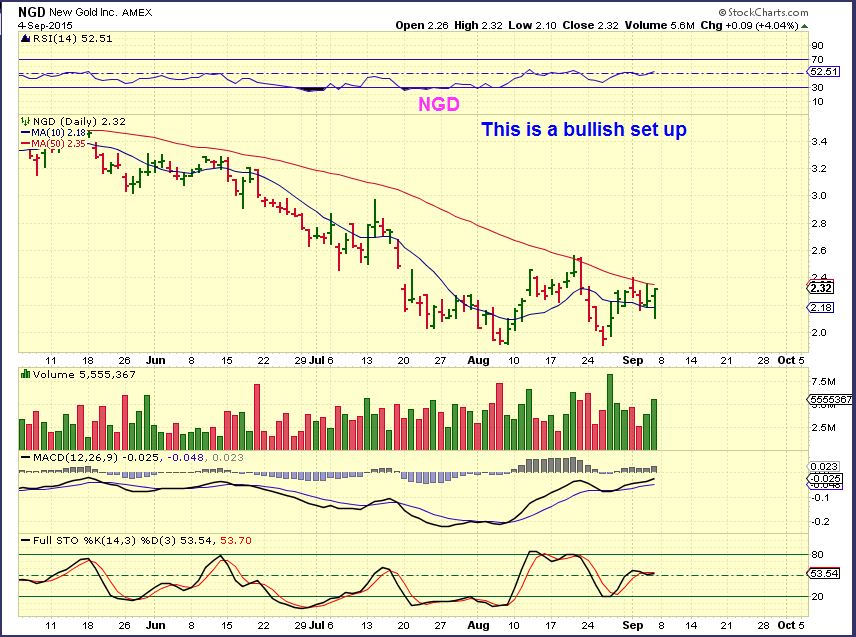
Search through some of your Miners and see if they looked good at this point. Some do, others may in the next few days. NGD, SA, NG, to mention a few stayed healthy looking. I do not think NG is a H&S 🙂
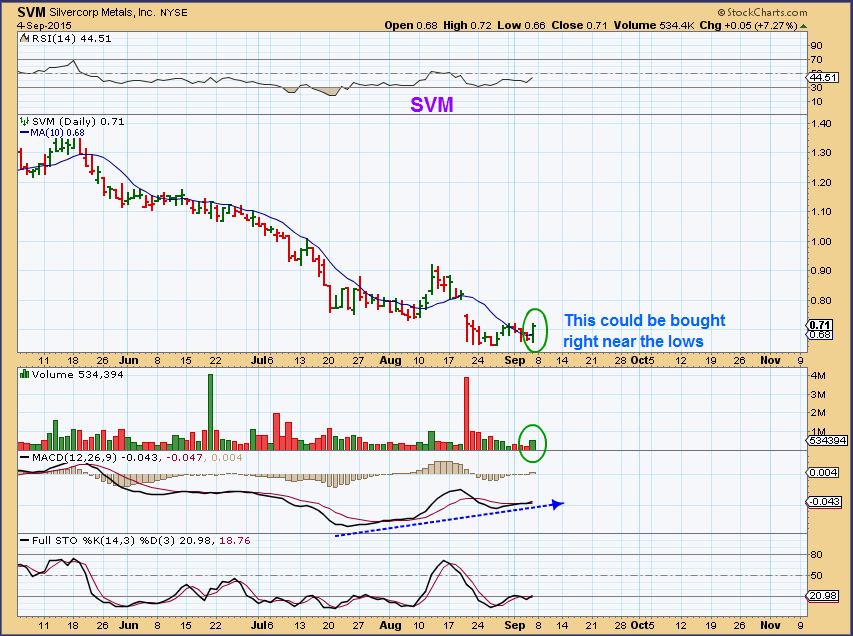
You may even be able to grab some (like SVM) at the lows this week if things remain bullish, and put a stop right below the lows.
I like OIL/ENERGY as we see them pulling back. I think many Energy stocks look like good candidates for a buy the dip. The SPX, NASDAQ, DJIA, IWM, etc are tricky. Even though I do believe we are breaking down, we could still bounce around in choppy fashion and eventually work sideways or higher to eventually ‘test’ the 200sma. The recent ‘tests’ shown in the charts included in this report may be pointing out short term resistance. They may be a good place to go short when tagged, since we will likely test that high volume candles lows, but I personally am not playing the short at this time. I am focusing on Energy & Precious Metals. Also Commodities mentioned in last weeks reports like FCX, VALE, AKS, MDR, etc may be good long candidates too.
Gold is one step closer to fining it’s lows and Miners may start move higher first. You can watch for that. A recovery of the 10sma in GDX or GDXJ is a bullish step in the right direction. Happy trading!


well done Alex. Thank you for the report!
Ur welcome Xavier 🙂
Alex, you mentioned that you believe SPX is rolling over and may go down for several months. Also that money may flow from there into the miners. How have the miners reacted during the previous corrections in the general markets?
I did not say miners. I will copy / paste what I said
I have been mentioning that I think the markets have
topped. At the same time I think we are seeing commodities bottoming
and we could see money start flowing from one to the other.
I see it, I’m just focused on miners.
Yes, if the bear mkt is done in precious metals, they should do very well too. Miners bottomed in OCT 2008, the Markets didnt bottom until 6 months later, so the markets were still falling and many Miners were up 100% or more by the time the SPX bottomed. This time is different. Miners have been selling off while the markets were rising, that was not the case back then. It is a different set of circumstances.
FCX looks pretty good in pre-mkt.
Thanks for the extra analysis.
Alex, your first 2 gold slides look bullish on GOLD with the first one showing 2 legs up, and the 2nd on showing a flagging pattern that looks bullish to me. The 3rd and 4th slides look contrary. Are you expecting 1100 or just making us aware of each possible scenario?
The first chart was drawn in July and was what I expected , basically it is playing out that way so far. IF the bear mkt in Gold is finished, the 2nd part will be updated. How deep the dip between 1 and 2 up is a guess based on past cycles.
The 2nd chart is a bullish triangle/ flag, it is a bullish set up. ( a false break down is also possible, so I drew chart 3. ).
The 3rd chart could be finished, it is showing cycle count and since we are deep in the cycle timing, it is bullish. If we drop & do a stop run, it is normal Gold behavior to shake out longs before a move higher.
The 4th is also showing a possible quick drop that still fits the cycle timing. I drew it to show that if Gold drops, there is no need to worry or go short. It all fits the bullish scenario. Last week it was mentioned in the comments section , and in my email box, that there is fear that this is failing or falling apart. ( not many, just a couple of readers) , so I am trying to show that all 4 set ups are bullish, not anything to worry about. I am not even worried if Gold drops below 1100.
Okay, got it! I jumped in the miners on Friday. They hit my targets. Now, I have been saying 1105 for gold, so thats real close to your 1100 number. I am hoping that miners get going positive first, then gold follows. But I imagine if gold drops another 25 then the miners will have trouble staying positive.
The miners looked good heading into the close on Friday and with Gold now on day 32 (today) it may be that the low is here. GDXJ was pushing on that 10sma, and today it could gap over it. I’ll be watching to see of we get a close over the 10sma on GDX & GDXJ.
Alex hi, thanks for the review.
Do see the GDX also following GLD? In terms of going lower first or is the low in Miners already in?
That will not be known until later this week.
As I pointed out, Gold was lower Friday ( so you saw GLD close lower in the red ) and Miners reversed and went to Green. That is bullish, but that does not tell us if the low in miners is already in though.
Alex,
very well done, we are very close for the miners. I think we can make a lot of money. I got one of my juniors GDCRF up 133% last week while I was on vacation in Europe. I could not touch it and so did not sell it. I think many of these juniors are in this stage. I feel the gains from the bottom will be very very good. thanks for steering the boat.
Congrats on that return! wow……
Yeah, NICE returns! I couldn’t look that ticker up on stockcharts. Not sure why.
look at gcu.v otr gcu.to, I found out why. It was bought out
oh yes, moon shot 🙂
Well done, as usual, Alex. What you do is tough, no doubt, as there are always those who use the benefit of hindsight to second guess and criticize you. And you have to hold a lot of hands as us amateurs fret about the daily, hourly, moment by moment wiggles. 🙂 I’ve seen a lot of newsletters and subscription services, etc. and you do it as well or better than any I’ve seen, with honesty and not a lot of bravado and reckless predictions (which are very dangerous to subscribers’ accounts.) Kudos, again.
I agree with you about the stock market (for what that’s worth, which is probably zero :-). The best approach is to be patient and stalk the high probability entry point for a possible bear market, not worrying about trying pick THE top. Most of those who did gain from this correction also got burned many times in the last couple of years (maybe more) trying to pick tops. And right now we’re in this extremely volatile period which is chopping both bulls and bears to pieces, no doubt. Patience is really hard, but I’m certainly still working on it.
Thanks for that Onlooker from Troy , I appreciate your thoughts there.
Most of the time I dont mind when people worry and share those worries, because so far it has helped me to see where maybe I need to be a little more clear. I may give my expectations ( like I may say, “I think the Miners reversal will be the lows and we will go much higher”. A statement like that causes some to leverage up & load the boat. It helps me to see that I should give the most likely scenario , and then add that “If we see XXXX, it is still within a bullish parameter, I’m not worried unless we break below XXXX”. Something like that , if that made sense 🙂
Yeah, it’s gotta be tough to write this stuff “exactly right” (well, impossible, really). And you have to account for how so many different people with different experience levels, etc. will interpret what you’re saying.
I agree with OLFT. I hope Alex doesn’t get mad at me when I question his charts or analysis? I question to learn NOT to criticize! And yes, I’m the one who will load up with leverage………
I dont ever get mad at questions or doubts….they cause me to research deeper and make me sharper.
.
p.s. Yes, I often grab for the JNUG or NUGT too out of the lows, I just cant recommend that for conservative traders not in front of the screen. They could get pretty chopped up with false starts.
You’re not the only one. Ugh.
U r the naughty child Bill…
Lmao
And i have a feeling it would take a lot to get daddy warbucks chartfreak mad. …
very nice thoughts Troy… I echo that first paragraph …
CF .. I’d say great report — but I haven’t read it yet.. :-/ ;o)
GDX rejected exactly at the 10 DMA. Aaargh, here we go again.
On the other hand, at least we filled the gap.
Ditto & ditto, and GDXJ lost it too (So far) . To be a tad bit more positive, “The day is young” 🙂
hey guys… my EW friends have this? https://www.tradingview.com/x/zgpSJQPU/
Thanks Maria. How low will (IV) go and isn’t ABC after 12345?
I saw yesterday gold touched 1115.4, was that it for the DCL? or we had gone lower prior to that?
$1115.70 was Fridays low, so I think yesterdays takes it at day 31 . Good chance of that becoming it, since Miners seem to be trying to move higher too.
I show a low of 1114.7 yesterday, according to ThinkorSwim, which would be a new low for the DC.
EOX could bounce back nicely with oil. Bull flag on hour chart.
Is there a any place you can put your money and get a safe (relatively??) 5% return. Just thinking about in the future when I retire. Sorry, IF I retire. Opinions?
I have been looking for that since 2008 2009 Bill. 🙂
I would suggest residential rental real estate in your area. Cash on cash ROI. You can hire out the management unless you want to be a landlord ……… like me. 🙂
They may start raising interest rates by then if inflation slips in…and I used to have a C.D. that paid out 15% and my regular savings paid out 10% when I was a kid! ( Ugh).
Ya, the good old days. Perfect scenario. What about Annuities? Anyone familiar with them? I’m certainly not.
I loved Jimmy Carter. 🙂
High inflation w high interest rates!
i have hourly RSI on XCO pullback just plunged to zero, and now recovering.
Bought NGD and EOX earlier.
Yes, I see EOX as a possible bull flag too.
MPO was looking like one too, but that one took off today
Bounce, drop. Bounce, drop (I’m repeating).
🙂
Oh, I meant just until you get to the next GDX chart below it – lol. 🙂
Then you’d see the Bounce, drop in recent days on that chart too .
Excellent Report Alex. The monthly SPX especially !
If GDX can break this trend line and Close above the 10 sma That would be Positive ! I will add……imho. 🙂
I think we just got it. Some may want to wait for it to close above for safety sake , but we are so close timing wise that it is more than likely starting that next leg higher.
Yeah, similarly GDX has been in a little channel that it just hit the top of. Here’s a 30 min chart: http://schrts.co/VwYA0M
I’m not sure if that chart worked the way you wanted it to?
Hmm, the link works OK for me. Let me try this. You probably have to refresh.
if NGD break $2.35 with gusto, it’s a launch!
I like the set up.
Many energy stocks were up when Oil as down too – MPO ( up 25% again) , WG ( up 18% again!) AREX, HK, DQ, SD, and SZYM has perked up quickly, to name a few today .
yes.. perky…
woooop woop
GDX just hit the 50% retrace from the last leg down,, also at the 1hr 50sma. Need to break thru here or we go back down a bit.
GDX, next harmonic pattern in play. Looks good folks. refresh……ing
Now, that is a nice ‘harmonica’!! 😉
LOL .. you KNOW I wanted to say that… but … I’m WAY too shy* ….. ;o)
*and innocent….
With the very short time I’ve been a member on the site, I have to say I’m rather sceptical on both those counts!! Lol 😉
HA HA HA!!!
Nice. But tell it to hurry up!
nice…. as VH* says…. ‘right now’ .. ;o)
VanHalen
I am SOOOO mad.
I drew this up last week and was going to put it in the weekend report and forgot about it. Today it broke out.
This pattern is similar to the SSEC when it broke out and just ripped higher and higher. (refresh).
,
same pattern in TGD weekly.
Weren’t we discussing this stock last week?
I dont recall any conversation , but I was away a lot last week mid day. I have several with this pattern and when / if they break higher, they usually run very well. The drawback is that they are so low priced… the worry that they may fail as a company.
Looks a little like your GOLD slide two from above. 🙂
Yes, but that looks like it could go on forever : ( (lol)
@chartfreak1:disqus
WG!!!!!!
I KNOWWWWWW – I loved it, I traded it, I dont own it 🙁
Still own it since $0.9
you put it on the map for me. :)))
Excellent!!
I was loving WG and WRES (now turning down) . I also mentioned EOX & MPO, nice patterns there but I didnt buy either again yet.
bought EOX this morning.
WG is at $1.57 now
NGD is doing it.
omg.. you guys are blowing up my inbox…………… lol
wish i could play.. :-/
boo hoo .. work
We need someone out there trying to keep the real economy going!! 😉
Nice to see U here again M.
I assume that your son is off to school , and you must have the day after Labor Day off, bcuz I KNOW you’d never try to work and comment and trade, etc all at once 🙂
MULTITASKING
u bet… I’d say pretty darn near expert at that….can juggle many crystal balls at once…
**can leap tall buildings in a single bound as well
.. o wait.. that’s my good friend superman…
signed,
catwoman
meowww
Someone is really refreshed after her 3 day weekend 🙂
mmmm hmmmmmm… ;o)
what you think about CRK …..
Huge drop, light volume. Still above moving averages, I’m going to watch it for another day or so. See if it settles down
I know it’s a ‘big one’ but a major constituent of GDX if I’m not mistaken, so important from that point of view if no other. But looking like a possible ‘stop run’ /false breakdown on ABX with some very nice bullish divergence on both this 4 hour chart as well as the daily and weekly charts. And for the EW officianados a possible 5 wave ending move!? Although I’m not overly loving the form of that possible wave 5 except for the very nice bullish divergence.
I like Chris !
GDX doesn’t have the over throw wave 5 but ABX does.
This is definitely proving to be quite a frustrating and tricky bottoming process we are working through. Try to make sure I keep taking a step back and keep an eye on the bigger picture as well so as hopefully not to be thrown by the smaller less significant moves. Alex is very good at keeping an eye on the bigger picture and great to be on board with you all.
Can you move your 1 over to the left a bit, using the May low ?
Ah yes!! Good point. And then 2 at the slightly lower May peak. Good spot…it’s been a very long day here…been working almost non-stop for nearly 11 hours…at least that’s my excuse. Do you want me to actually re-post a fresh chart? Or were you just pointing out my school-boy error!!? Lol
LOL… dunce cap for you..
ps. you can borrow mine.. ;o)
I’m already standing in the corner with my head held in shame. 🙁 Lol
….it’s nice to have company.. we can commiserate together… ;o)
TeeHee
Either, I just heard your disappointment with the 5 waves, but they looked pretty good to me. I didnt know if moving ‘1’ would make you like it better? 😉
It would definitely make it look better…and more accurate!! Just hoping it is an ‘ending wave’!!
Alex,
Is this TLT chart speaking to you in any way?
Like maybe a Buy ? Stop below Trend Line or 62% fib level or maybe the 50 sma ?
Ken…. you read my mind, I thought the same.
Thanks.
you are welcome Geurt. 🙂
I did start a position long near the 50 sma if we drop further near the TL I will add with a stop below that TL. Very low risk with very good upside if the SM’s start to sell off hard….might be a longer term hold for me. Just my opinion. 🙂
Good to know Ken. I bought 2 Call options, Jan 120.
I think 120 is a long support line. Let we see how we make it.
Thanks for responding Ken.
i did not buy the Calls I bght the bonds I am playing for a longer term play and I want the Interest TLT pays if the trade works. I am not saying an option play is not good just playing it different than usual.
You could play it that way, back testing the trend line looks good. My concern is the weakness on the weekly chart. It may bounce & then just ride down that trend line or break back under it. I dont have a Bullish TLT feel right longer term yet . That could change though. A bounce is due, but the weekly is a tad weak.
Thanks Alex.
I will start a position b4 close w stop below the TL. Good risk reward imo.
If the SM’s are selling off into a longer term bear market now Bonds will be bght. as a “flight to safety” ie in 2008.
Hope you don’t mind me commenting but just a couple of thoughts looking at your chart. You’ve got a bearish looking cross with your 9 and 20 ma’s which from a trend following perspective would have you looking at potential shorts rather than longs in this scenario. Also the latest rally was capped by the now falling 20 ma and the RSI is below 50. If as Alex says the weekly chart looks weak as well, all in all this would make me rather wary about the shorter term picture. If for any reason I went long I would certainly employ a stop loss. Just a few thoughts.
Not at all Chris. Thanks for commenting. 🙂
Miners update eod
(refresh)
GDX:GLD ratio at its 10MA. That’s great news.
GDXJ:GLD ratio is above 10ma!!!!
(refresh)
Man. If it ever got back to the breakdown point at .17 AND gold rallied towards 1200, that would be a Heck of a rally. If.
NGD is uber bullish.
The company holds 17.6 million ounces of gold reserves and 82 million ounces of silver reserves (reserves can be produced at a profit). That means we’re buying its gold for less than $60 per ounce. And we get the silver for free.
**
More important, New Gold is one of the lowest-cost producers in the space. With an average cash cost of $410 per ounce last quarter, it is an excellent miner.
thank u wikipedia … i mean frenchie ;o)
good 2 know, I’m in this one as well….
Man, waiting on this next potential leg up in PMs is killing me. So frustrating. Ahhh!!!! Need to have patience, but I don’t. Have to vent. Thanks.