I’ve been seeing differences between my long term view and my short term view for the markets. This could be indicating that we are seeing turning points. Lets discuss why that could be.
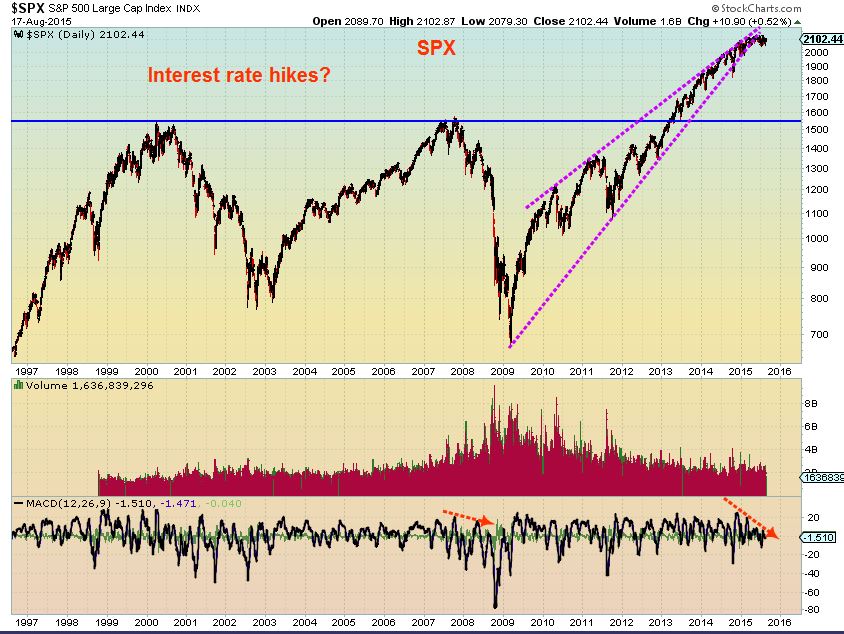
SPX – I’ve been seeing this longer term. It looks like the markets are acting rather toppy. Monthly charts are now showing weakness quite clearly as well.
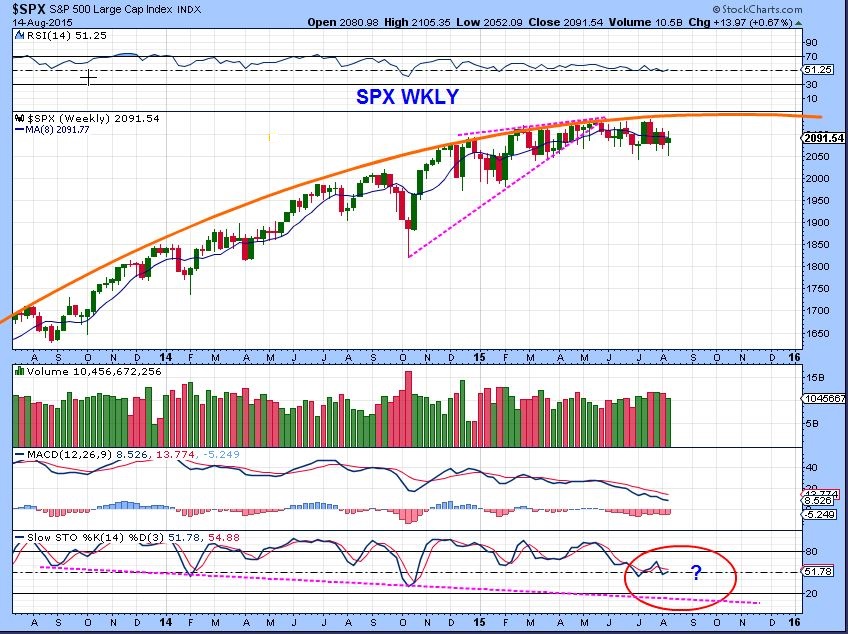
Now looking at things from an even longer term view…
It would be a rather huge drop, but could we be seeing a future “back Test” of the break out? A large wedge has formed and could lead to a pretty decent drop.
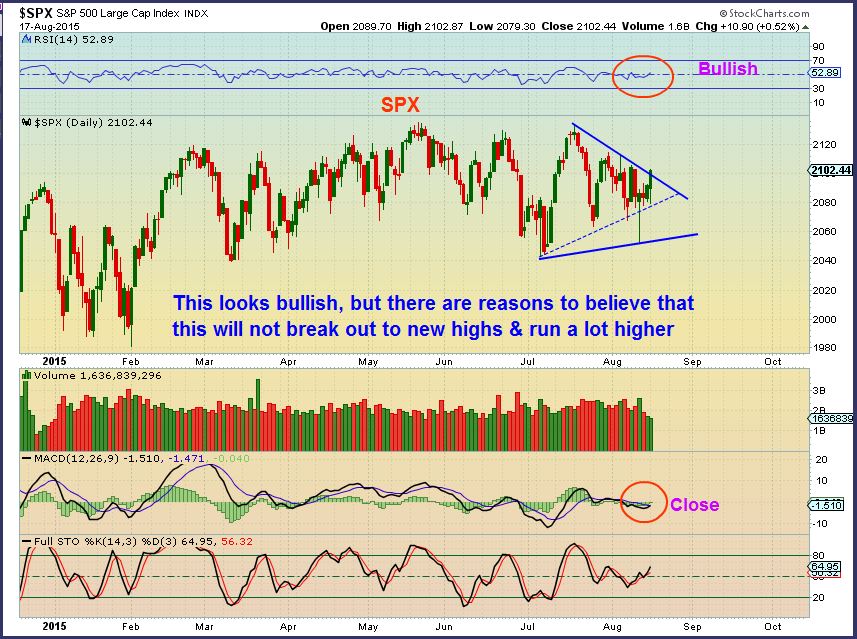
SPX – Short term it looks like it wants to break higher, but again notice that todays price is right around last Decembers price or January’s price. Every time it looks like a good long set up, the follow through is lacking. Also Cycle-wise, this is left translated and I would expect it to roll over soon , even if we do get a bounce.
NASDAQ – Same story. This also looks like it wants to go higher. I actually see some good looking set ups short term, but some that I have seen recently have just broken down, so we need some follow through..
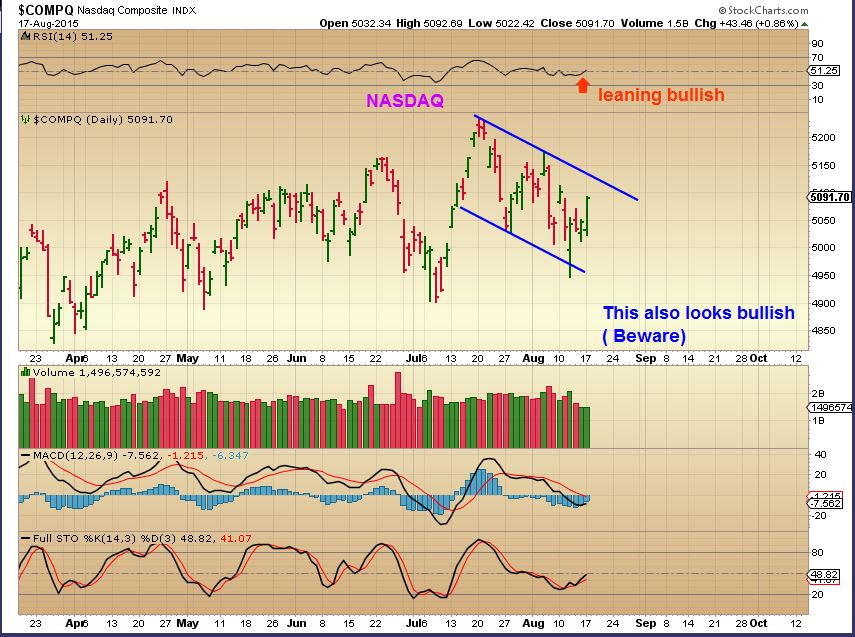
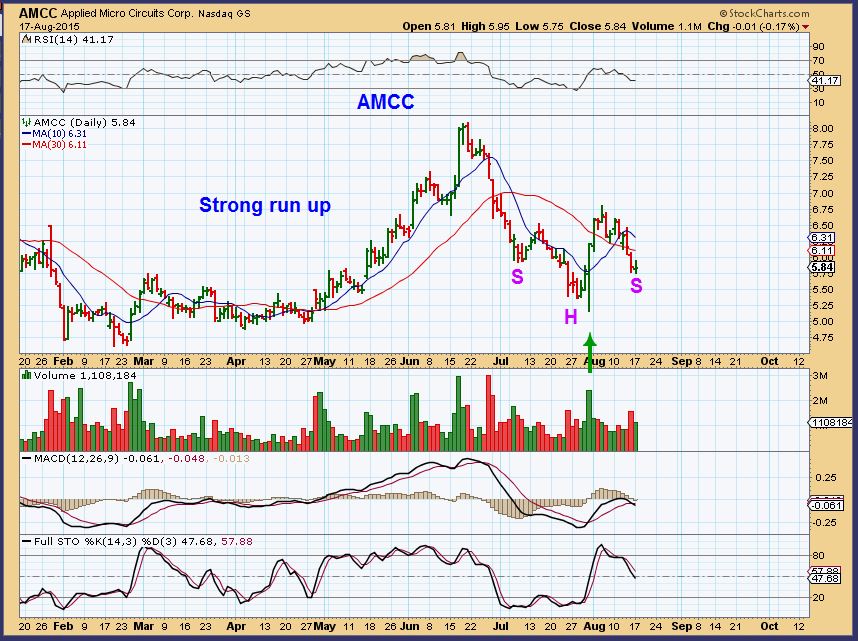
For example- We had a great run higher in AMCC in MAY, but then it fell apart. It looks possibly set up to run again, but as I am viewing things short term, I remain cautious longer term.
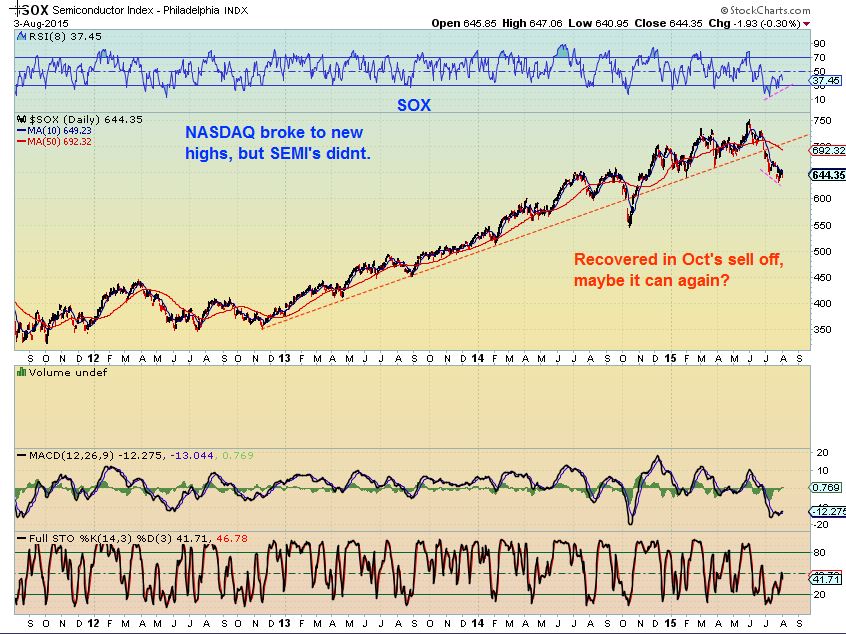
SOX– AMCC is a semiconductor stock, so I wanted revisit the SOX which I pointed out as breaking down weeks ago with this Long term chart in Aug 3. Is the Sox improving?
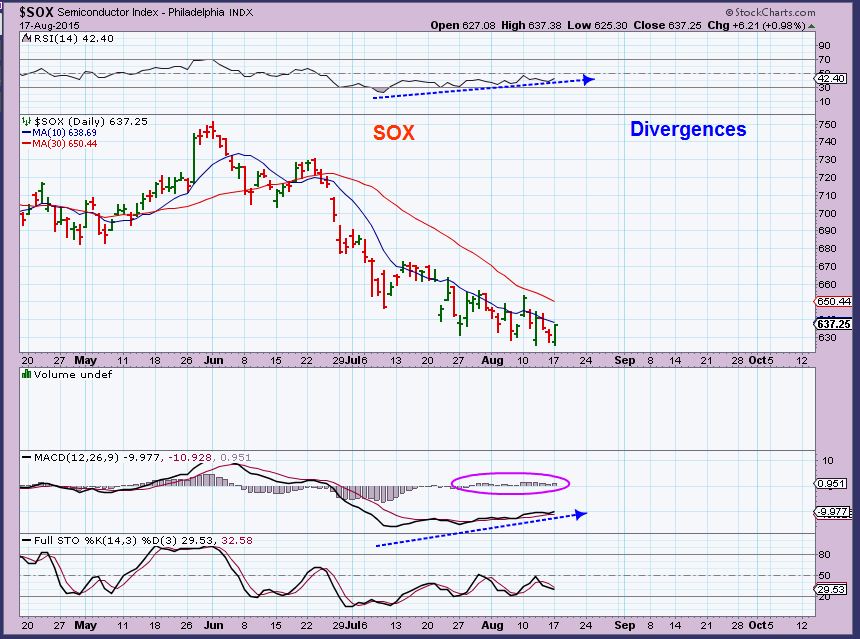
SOX – Short term the SOX looks as though it wants to bounce, I see Bullish divergences. Please keep the long term break down in mind if you are trading these markets.
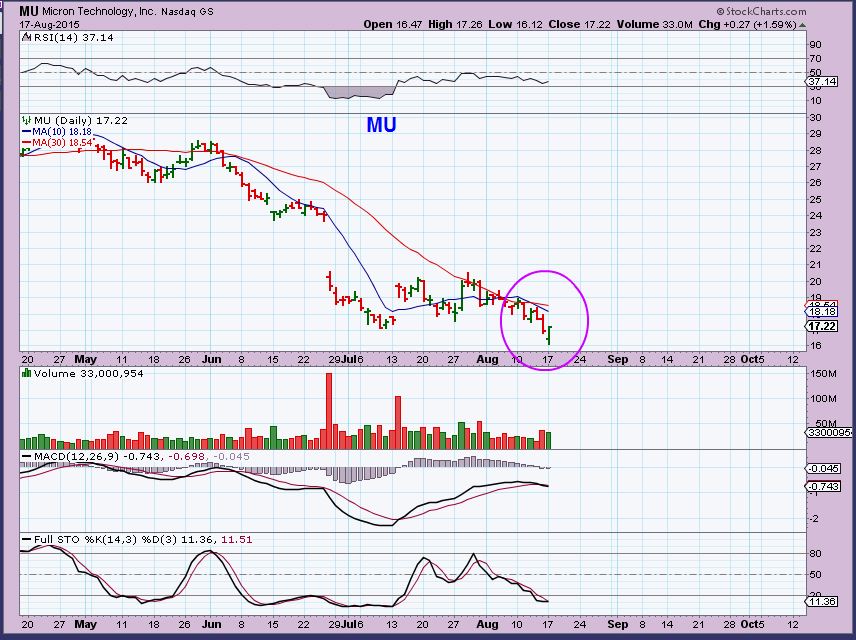
MU is also a semiconductor stock. It looks short term bullish too, with a reversal in place. This looks like a buy and if it fills the overhead gap? Wow.
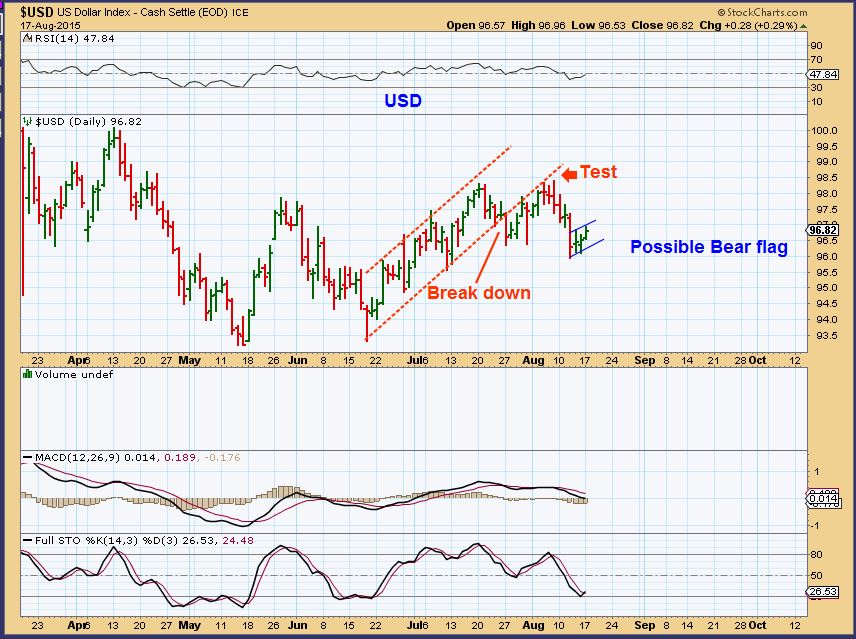
$USD – I have said that the dollar looked internally weak in its climb. It has since dropped and now is climbing again. I do not see strength in this move either. Possible bear flag. ( Good for Gold?)
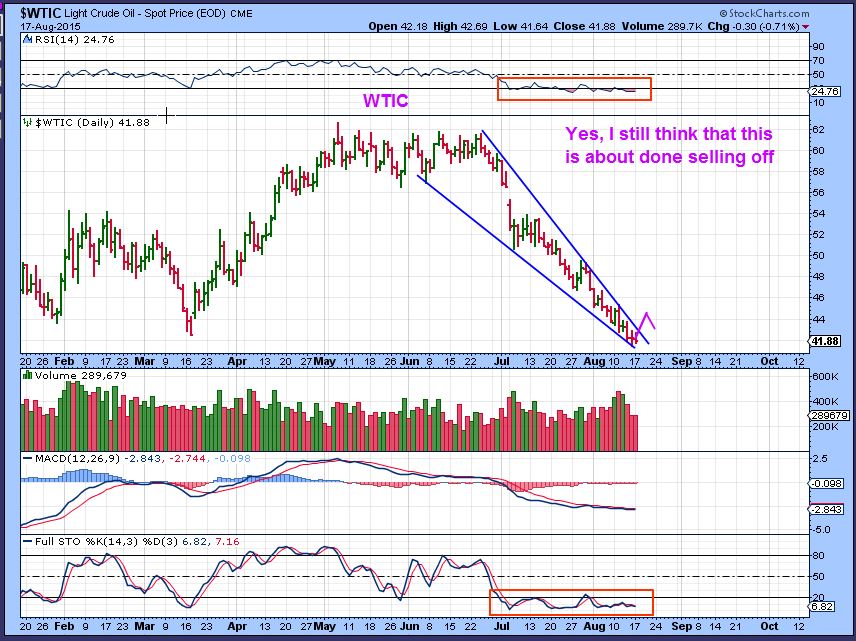
$WTIC – Many Oil / Energy stocks are trying to bottom, I think they are leading oil. I STILL expect OIL to move higher soon. Waiting for it to break above the 10sma or this wedge is prudent. I was tempted to buy UWTI for a trade yesterday, but I held back for now. UWTI is leveraged.
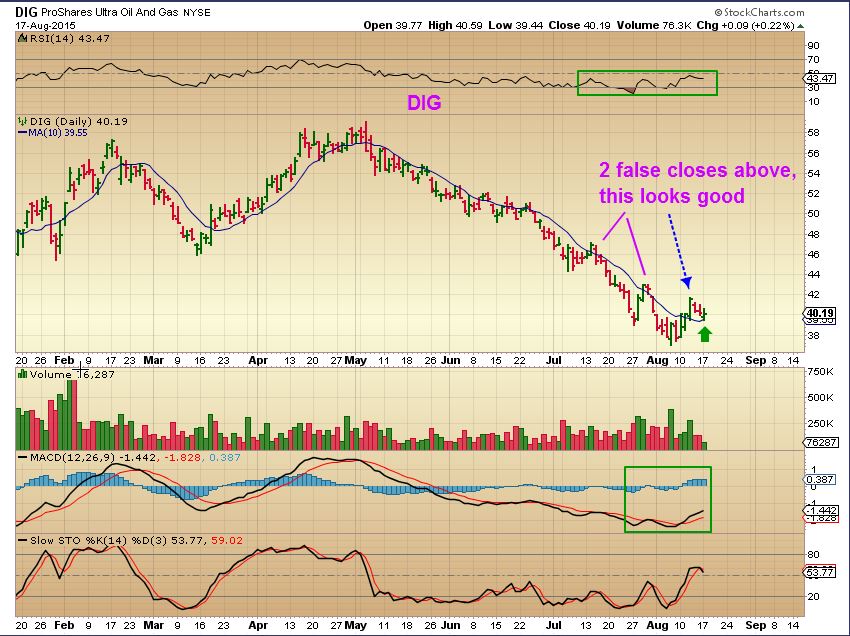
DIG – Trade idea. Dig has broken out & back tested. It is a low risk set up with a stop below the 10sma. (Ultra – so its a bit leveraged)
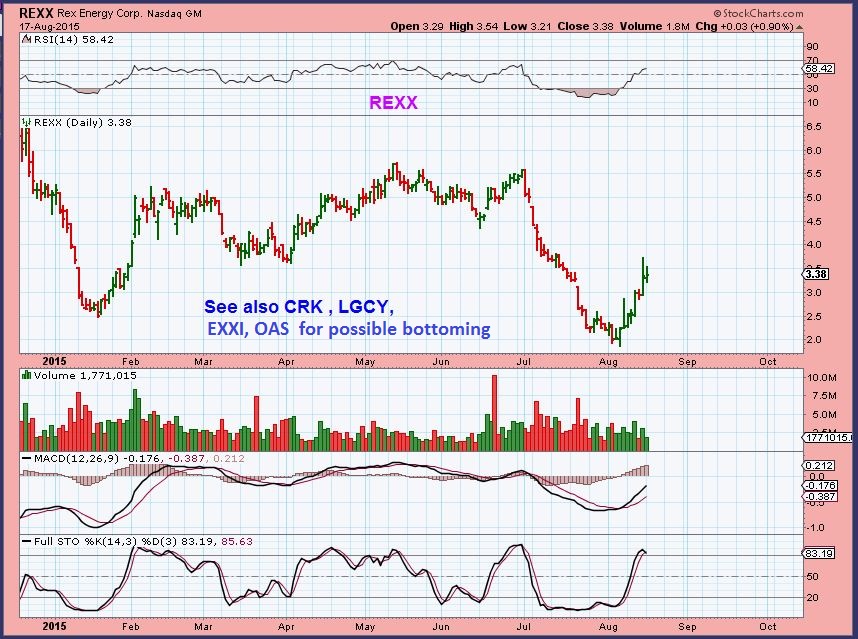
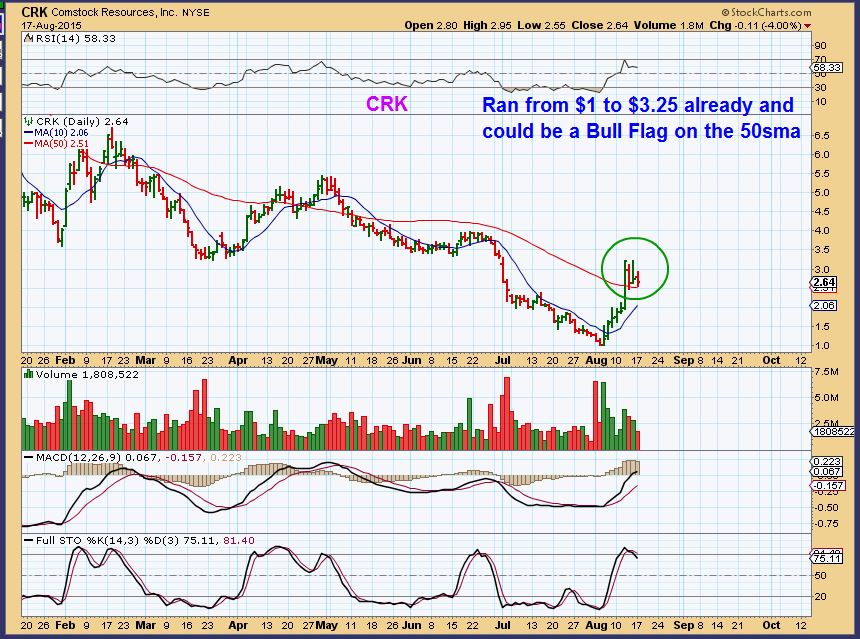
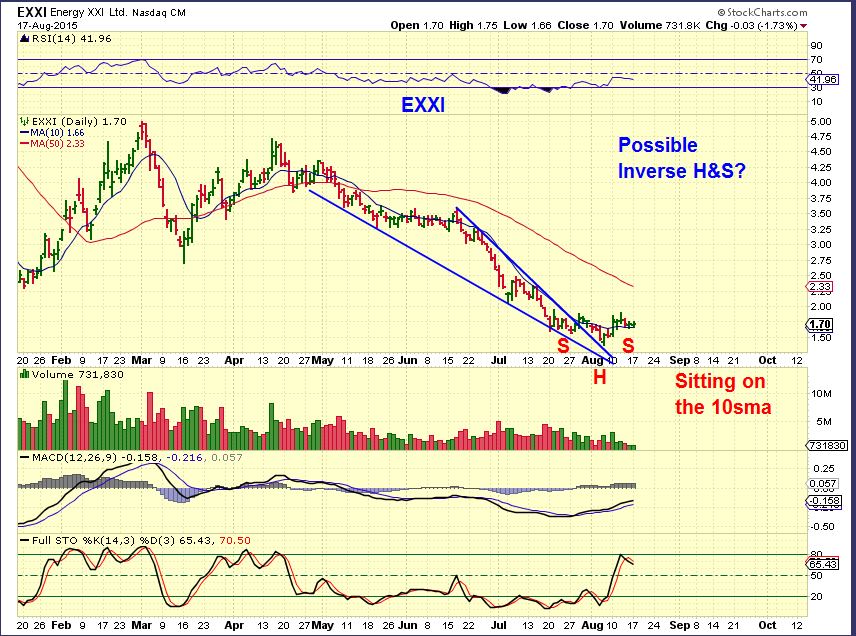
REXX– I just wanted to point out how some Oil/Energy stocks are setting up as bottoming despite Oils drop. See also CRK, EXXI, etc.
CRK sits right on its 50sma, it could be considered a BUY with a stop under the 50sma. It did just run up 200+% so it might go sideways for a bit to relieve overbought conditions, but it doesnt have to.
EXXI – possible buy here with a stop immediately below. Falling oil price is not influencing it, it may be being accumulated.
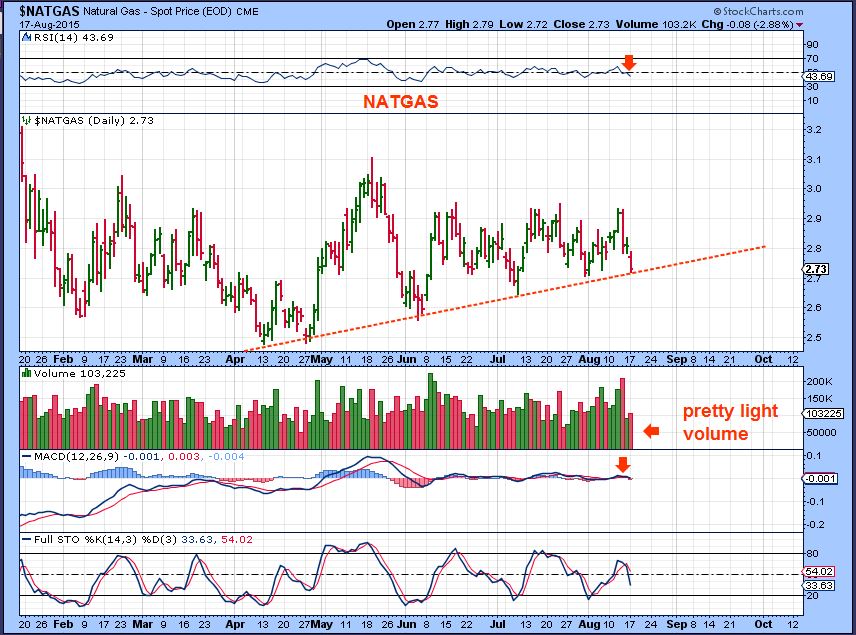
NATGAS – Looks bullish one day, bearish the next. Breaks higher , then turns lower, it is still in a consolidation. It really needs to prove itself with follow through.
GOLD,SILVER,& MINERS
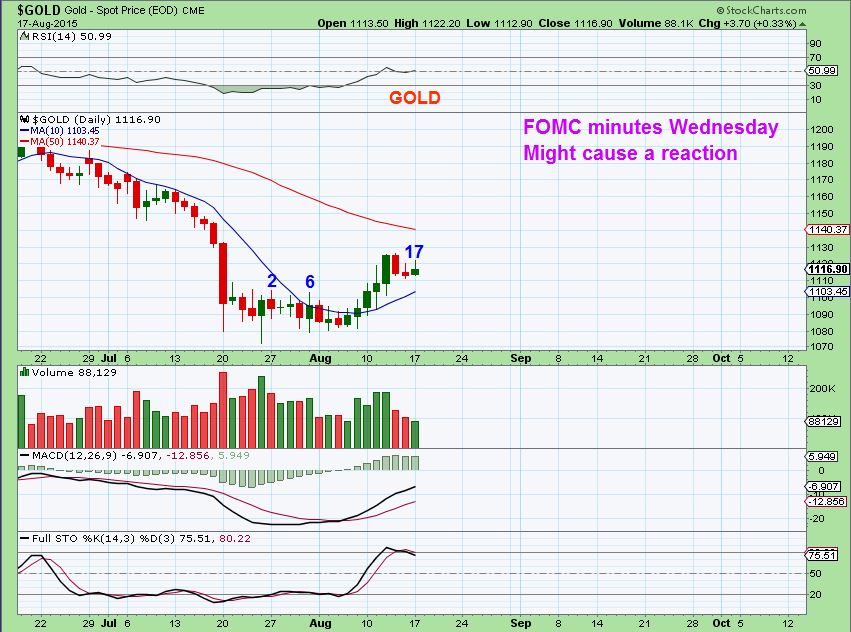
Keeping in mind : Tomorrow is the FOMC minutes release
Nothing has changed here. Gold had such a strong pop off of the lows that it quickly got overbought. It has now moved sideways toward the 10sma, but never reached it. Was that it for the pullback? Possibly. It can also continue sideways and allow the moving averages to catch up.
Could the FOMC minutes stall gold at the 50sma? Yes . Could the FOMC minutes release Push it above? Yes, both scenarios are possible so we must assume that anything can happen.
Gold Cycle Day 17 – Cycles can run from 20 – 30days , so we monitor them along the way. We could be 1/2 way through a daily cycle or late in the cycle. I think its safe to say that this cycle will be Right Translated, and that means that after a daily cycle low is put in, we expect a higher high in the 2nd daily cycle. So we can conclude that eventually we will see higher prices in Gold.
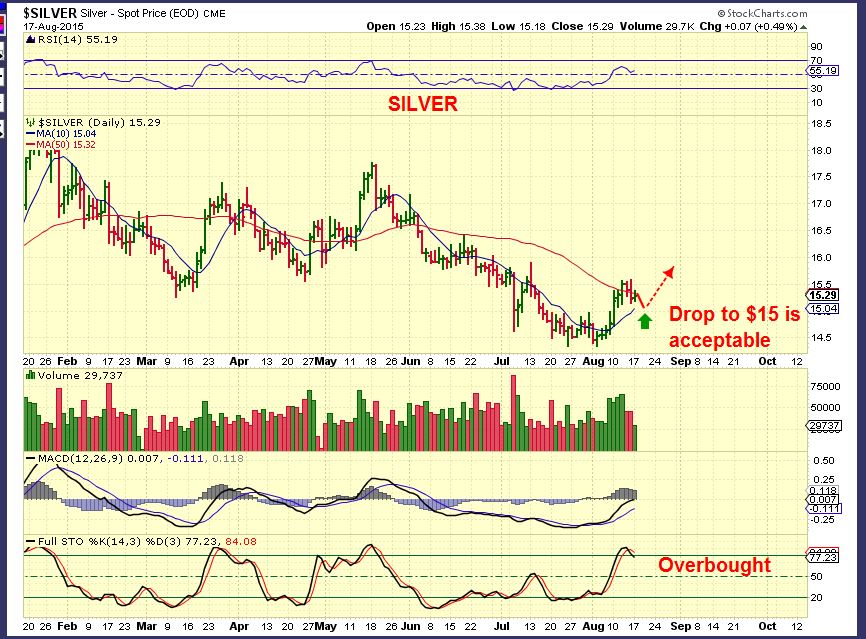
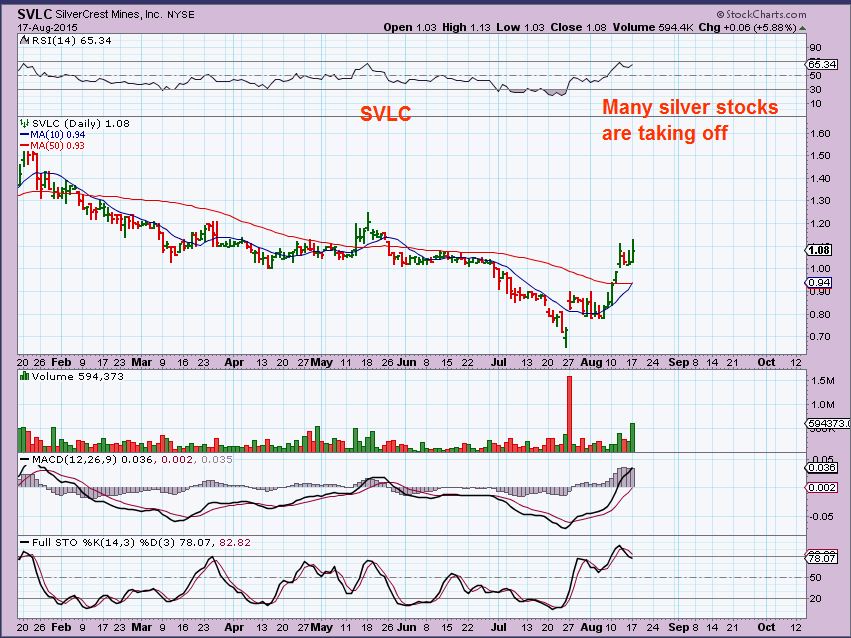
SILVER – Closed back under the 50sma. It could drop to the 10sma now. I think the SILVER STOCKS are acting the strongest. You may get a buying opportunity if they drop . See for example SVLC, EXK, SSRI, PAAS, etc.
GDX – Also remembering that the FOMC minutes are being released tomorrow. We could see a surge through the 50sma or be rejected at it temporarily. I am still Bullish and I’ll show you why.
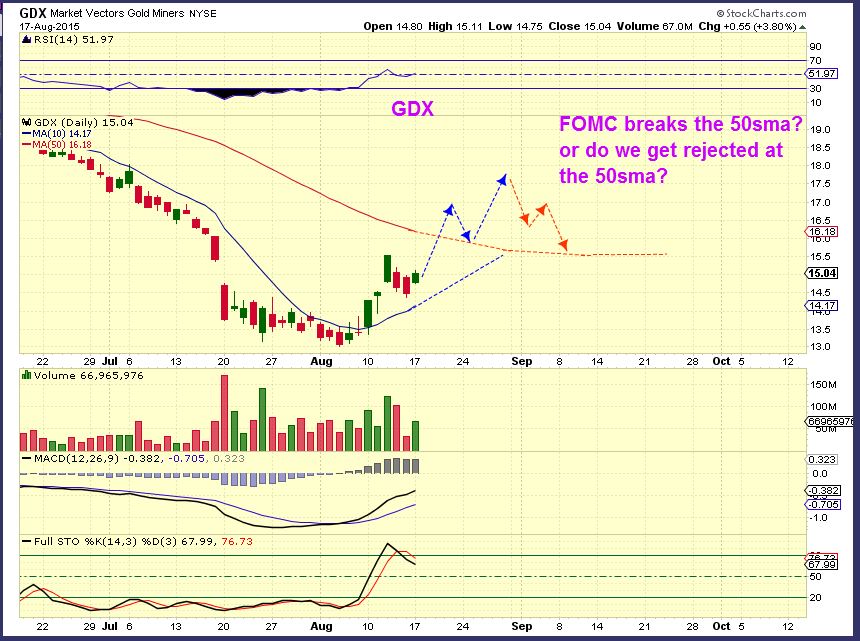
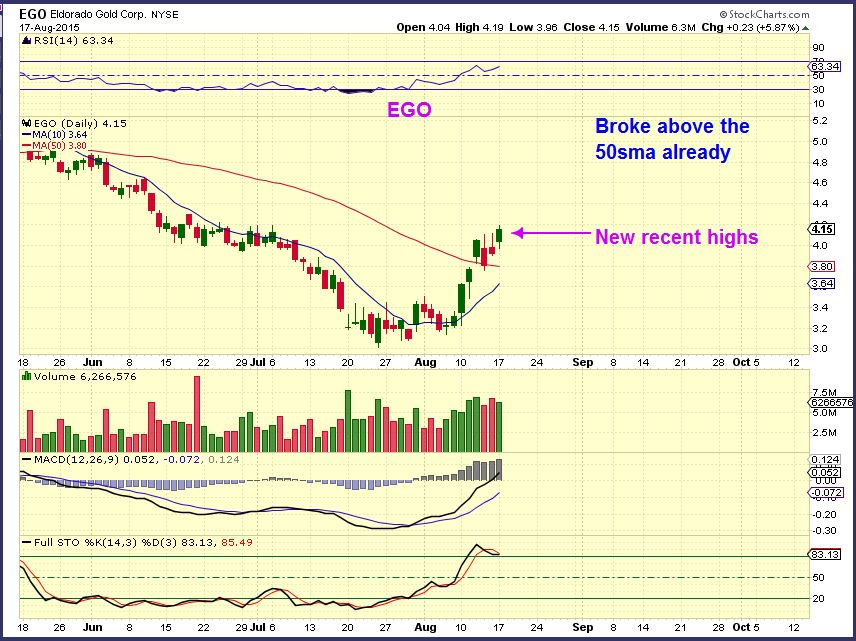
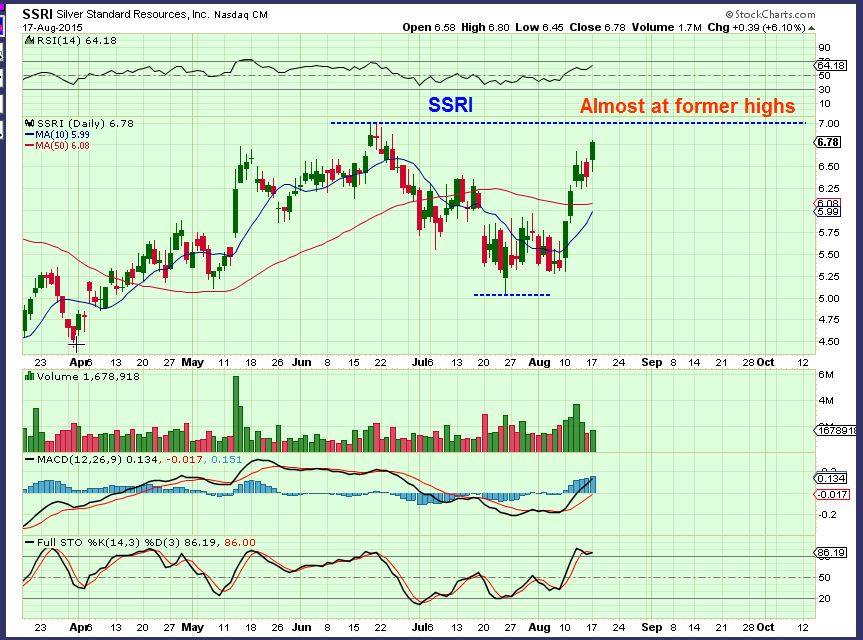
This is one reason why. Some Miners are really looking bullish coming off of their lows. Just look at these 3 for example. You’ll notice that these stocks bottomed in JULY and after a little sideways action, they burst higher. GDX bottomed in August recently and is currently in a little sideways action. Burst higher coming?
I gathered my charts last night and started writing at 6 a.m. When I started Gold had run up to $1121, but now (8:15 a.m. ) both Gold & Silver are selling off. I imagine that we aren’t going to see solid follow through before the FOMC releases the minutes. I cant say what the initial reaction is going to be after that, but the longer term expectation is for a move higher. That means we can look for buying opportunities on pull backs in Mining Stocks. I really like the silver stocks, and as I write Silver is selling off, so look for some of those stocks to either ‘Hold up nicely’ as Silver drops, or maybe they drop to their 10sma or hold the 50sma and can be considered for a buy.
With the FOMC MINUTES being released tomorrow, there may not be much follow through in either direction for any of the markets. There will be a lot to watch between now and then for clues however. I like several charts & ‘set ups’ in the market (MBLY, MU, TSL, JASO, and other solar stocks– DKS, MDT,etc ) but lately I have seen nice looking set ups fall apart, so please remain cautious and honor stops if you are investing there. WALMARTS chart looked good yesterday, it had formed a nice bottom. Todays earnings may kill that chart too 🙂 see WMT
I am focused on precious metals for now. Energy is also on the radar. ( And many Solar stocks are turning higher , see JKS, JASO, TSL, CSIQ, YGE , FSLR, etc).
~ALEX
The Big Picture 
 QUICK POST
Scroll to top

Hi Alex Silver seems to be selling off prior to open. Close to 20 SMA, Any thoughts
Hi Sandy
I was watching the 10 & 20sma too, but if it breaks down further, there is always a chance that it could test the break out from the down trend. ( refresh to see a chart) . I expected silver to be stronger than that, but it can happen.
Pretty much there now..14.77!! Will be interesting to see where we close the day!
Certainly not what I expected at this point.
Look at silver stocks. Still well off of their lows , and still above their moving averages.
And now a rally. Maybe just trying to shake some positions out. I used to think there was a conspiracy with bad price prints and thought that was an indicator to shoe where prices were headed. Let’s see if that happens here.
So you’re saying NUGT at $90 ? Woo Hoo ! 🙂
Something for us to look forward to. Gold now positive! Maybe it was just a shakeout.
Thanks for another very informative report Alex. I have to say it’s already proving to be much more fun and informative hearing and seeing so many informed comments and charts between your reports and other subscriber comments than trying to do this totally on your own! Would have to say I very much share your wariness on the longer term picture for the major indices. I’m sure you are aware but the actual price peak in the Dow Transports was as far back as November last year and it finally broke down from a 7 month distribution top formation in May this year. My understanding it that in recent years it has had a tendency to lead the other major indices. The Transports are currently in a short term rally phase but already approaching it’s now falling 200 day ema, which would be a classic topping are once again. The DJI is also now firmly below it’s own 200 day ema which is also in the process of turning over and to me is also looking increasingly bearish longer term. The weekly MACD has also gone below zero on both indices, which is yet another indication they are in/entering bear phases. Clearly other indices are holding up better than these two right now but I fully understand your wariness and it will be interesting to see whether the rest turn bearish as well or the DJI and DJT start to improve!! I know which way I’m leaning!!
But PM’s a whole different ball game and one of the few areas like you, I feel outright bullish and am comfortable buying especially on a longer term view. Apologies if that comment is a bit too wordy for your discussion board.
Hi Chris, That comment was fine, I am the king of long comments 🙂
I did cover the TRAN and the UTIL and SOX when they broke down. The TRAN I covered off and on from I think January. I mentioned the Dow theory and that if things kept up, it could be a warning sign. And tops are often a long drawn out process, with the BUY THE DIPS crowd keeping things alive for a while, but our recent sideways action looks toppy & a 7 yr bull market without a real pullback? I would say it is due for a rest .
I’m firmly with you on that one Alex. Feels like we’ve been running on fumes for far too long!! But time…and ultimately price action will tell. But it certainly feels like the potential is there now to turn very nasty, very quickly and very much the same thought had struck me about your long term S&P chart and potential downside!! We shall see!
yeah .. THAT’s an understatement………………………………………
Chris what do you mean by PM’s?
‘precious metals’…sorry Sandy just used to my own short hand!! 🙂
Good morning everyone! What is the expected reaction in GOLD when the Fed decides to raise rates? In the past its been a negative, but I am getting the feeling that it will have a negative effect on the general markets which may cause an influx of cash into gold/silver. Thoughts?
Additionally, if the market corrects, where to put the money? Bond funds? Don’t bonds generally travel inverse to the market?
Alex, somebody clearly taking your solar comments to heart this am!!
Really…whats happening? I havent looked yet. I think TSL had earnings ?
Alex, I don’t get your bullish reasoning behind MU. To me, it doesn’t look good. See my reasons on the attached. I’d like to know what you are seeing in more detail so I can learn here. BTW, MU didn’t meet earnings expectations either. Respectfully,
Hi Bill
That MACD shows strong divergence at lower lows actually. Reversal candle yesterday after being strongly downgraded, and a few other reasons. If the markets keep selling down, it will likely falter too. SO far the markets are down, so I’d watch to see if it reverses again today, but I’m not buyer. I am focused on Miners and Energy myself..
Isn’t the MACD cross over generally a negative event?
“generally” a negative ,yes, but Its not the death knoll. There are times when it crosses under from being oversold and crosses right back up.
Look at DEC 2014 GDX. The MACD crossed under right before the strong rally, it had divergence at November lows .
There are times when you look at several indicators and a macd that just crossed under isnt a big deal if other things are showing divergences. If the markets falls, MU will likely follow. As I mentioned in the report, use caution if trading anything in the general markets because I have seen even good & proper set ups fail.
Thanks, appreciate the explanation
A bit of a ‘smack down’ going on in Silver…14.80 as I write. First real test for us bulls!! 🙂
I posted a chart at the bottom of the page in response to Sandy. Yes, test for the Bulls endurance 🙂
Silver stocks certainly are holding up well on a relative basis.
Exactly what we wanted to see. Look at SLV and then look at SIL ( or SIL:SLV)
( REFRESH) I sold all mu JNUG when GDX hit $25 – hope U did too 🙂
obviously just kidding – lol
Ya, whats with that? NUGT is the same, I sold at $90? A little early………I wish
LOL, I wish too . Its just a fluke mis print
edit: They fixed the GDX chart
Aer you kidding Alex?
Wowww…… I was away for 2 hours sell still now?
BAA getting thumped again, and GSS can’t get off its back. You still holding these for long term Alex? I know it’s hard to judge these little guys on a daily basis as they will dance to their own tune. And they still have good longer term charts, with their lows set last year.
I dont own GSS and I sold 1/2 of the BAA . these were based on breaking down to cost . I bought BAA at 15 to 22 cents, and added on the way up. I had stops in place for the stock bought on the way up. Those are gone.
Also look at other small companies making large gains lately while BAA and GSS are still at lows. Even AUMN, VGZ , TGD etc are making nice moves , but BAA & GSS are stalling. They may do better in the 2nd daily cycle, but they are struggling now.
OK
I still own BAA
Yeah, I was thinking of buying both here as a long term accumulation position.
I own both. If they can stay in business they both would be a great long term holding. If gold stocks are good for the next month or so we can see how they react and stay in or get out after that point.
Agreed
Today looks right to buy energy stocks. I bought UGAZ this am. EXXI and CLNE look like sales. I really like RIG
Your buy was on Aug. 9 at the bottom of wave 2 with a risk factor of 1%. 🙂
Ken, Which one you talking about?
XLE
Silver stocks look excellent and that may have been the buying opportunity. AKG went green with silver down.
EXK, SSRI, PAAS, Hl dropped 7 recovering too
CDE is a buy here, could recover all of the 7% loss later today.
careful here. I would buy now ($3.45) or even better at $3.30 (likely to get there)
one more thing. heavy bid at $3.45. (FYI). good sign
Where can you see the bids?
Level 2.
It was doing so well! I expect it will rebound
Looks like a good second chance on SVM
Are you using the 10 & 20sma? Sat right on both & turned upward 🙂
GOLD (refresh), NUGT, GDX all have bull flags forming. AB=CD patterns in all of them pointing to higher prices. $1150 Gold, $5.50 Nugt $17 GDX
Ok. Let’s get started!
now then silver… if you wouldn’t mind finishing what you started…
Would love to see that pan out over the next few weeks! 🙂
oo ooo ooo … me likey :o) sonnnnn ….
EGO hasnt pulled back for long. Looks like it must go higher
Ever since I bought it! Youre welcome
Just noticed WTI (West Texas Intermediate) on a 1 hour chart which is currently banging it’s head on an 80 period ema (42.20) which has pretty much contained all the recent rally attempts. There has been some bullish divergence so maybe this time we finally break above in line with Alex’s thoughts on a potential rally in oil. Above 42.75 would look a little more convincing though as we then would make the first higher high on the 1 hour chart since 29 July. Trying to get above but so far it’s still watch and wait!
Alex.. what are the signs that you would consider a breakdown (for complete exit/ catastrophic stop-out) of this rally in gold, GDX, GDXJ etc…. violations of what MAs & trendlines or price levels?
Im going to guess anything below the 50sma
Hey Bill. What do you mean? Haven’t they been trading below their 50DMA for awhile?
Sorry, yes I was looking at a 2hr chart. On a daily, I’d have a stop below the 20sma
thx Bill
Great question. If GDX and friends are going to retest 13 I want no part of it.
I think that was the largest attack yet. Roughly 20,000 contracts dumped in the premarket and the first 15 minutes of trading. It looks like they are trying to set gold up for another attack on tomorrow’s FOMC minutes. Here’s hoping it backfires and they lose millions 🙂
Gary, where did you get that number from?
Sorry Bill, I deleted Garys comment because in the past he came here to advertise his website and I asked him to stop. His answer to your question should be “Where he got the number” and post that.
The question was where did you get that number for contracts, not can you advertise your website here
You and I have had this discussion in the past. Thanks for respecting my request in the future, since you agreed to do so in the past and must have forgotten?. I emailed you privately and offered you your money back many months ago to go away and you said “I’m here to learn technical analysis, not advertise myself or troll for new subs”.
Post the chart as you have in the past
Sorry Alex, I wasn’t trying to advertise the site. Here is the chart.
I’ve Never, ever heard you say sorry before, and you probably dont remember what you said to me in 2011 anyways, that made me feel the way I do.
So here… no hard feelings.
http://blog.smartmoneytrackerpremium.com/2015/08/largest-attack-yet.html#comments
Long OAS for a swing. Like the action.
Let’s see if /CL can hold it’s spike
PBR red to green battle. Go be interested eod
not happening
Alex hi, any views on going long on USLV?
I dont hate the idea, but for safety sake one might want to wait for the FOMC minutes to be released , just in case we get a little whip saw. That could cause someone to enter today, get stopped out tomorrow in a shake up, and then have a hard time re-entering soon after getting stopped out as we watch it run higher (If that is what happens).
Thanks Alex. Sorry if its a silly question but what sort of correlation do you see with the FOMC minutes to Gold & Silver?
I’m certainly not CF, will be interesting. Watch USD tomorrow. Rate increase bullish $$, higher rates hurt non-interest bearing commodities. But if inflation outpaces rate rise then you still have negative real rates (which is bullish for gold).
Daily Swing in Oil…….
Plus Late in the Daily Cycle…..
Very late and expected, but still a little nerve wracking huh? 🙂
You got that right !! lol
Are you going to test the waters?
I am not at this time…..easier decision for me because I have XLE Calls bought on 9/9.
Not sure if Energy stocks are confirming though?
Not yet 🙂
Looked like today could be lows, but I’ll wait for more confirmation. Oil soaked falling knives aren’t as fun as they sound.
Potential nice finish for GDX eod
I’d like to see it rise into the close, to give it room to drop again tomorrow with FOMC & then rebound . No damage to the charts that way.
the $14.61 area defended… will it hold?
That sounds great. I’ll be looking for that to happen. I dont have the guts to enter before FOMC, although it’s tempting. Thanks for that comment.
Beautiful Bear Flag on JDST… (1 hour chart)
show me … show me… (cant chart now)
NEW POST NEW POST – DISQUS EMAIL ALERT IS DELAYING
NEW POST
NEW POST 🙂