
Steady Balancing Act
If you are a subscriber here at Chartfreak.com, you know what this picture represents. Lets discuss the markets and see where they landed at the end of last week.
.
I will start with the wkly chart of the SPX.
Again we see a LONG consolidation for the entire yr of 2015 really. Bullish if it breaks higher and rallies, but…
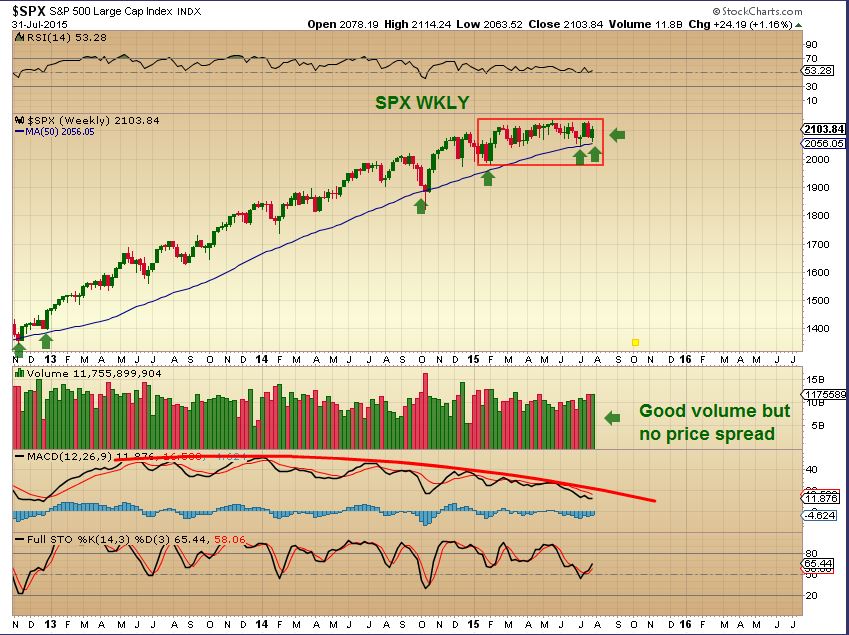
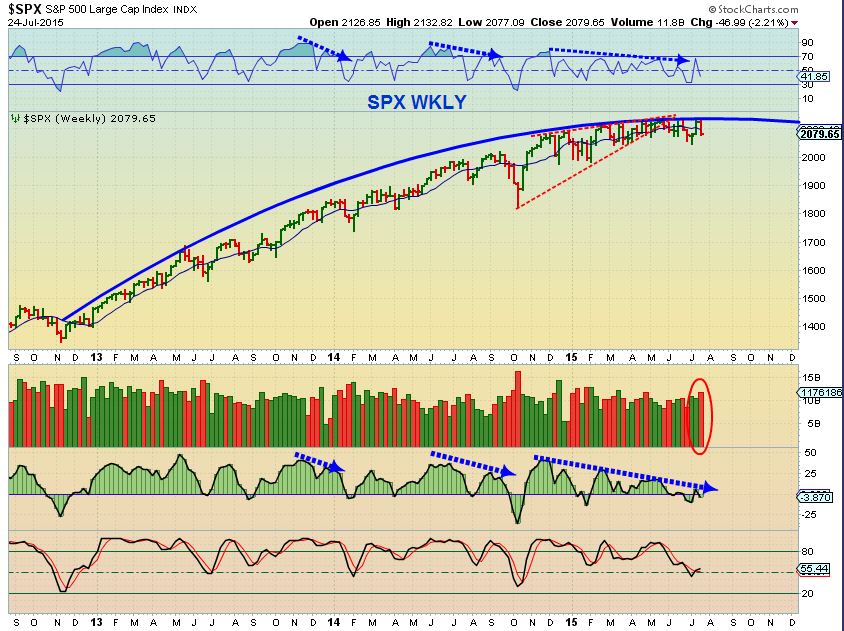
I want to point out the MACD on the above chart and this following chart as a reminder…
SPX long term could be slowly rolling over. Just a reminder.
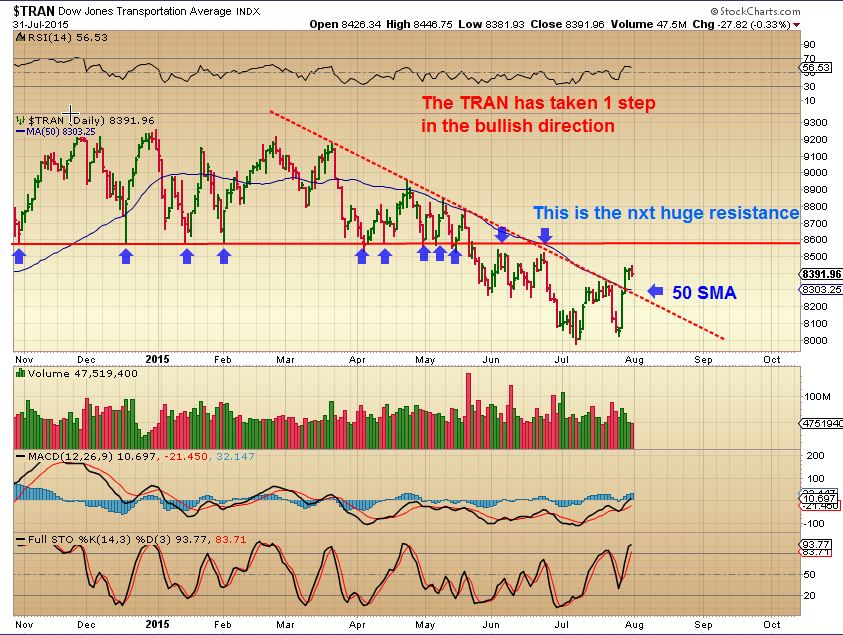
TRAN– I have pointed out that the Break Down of the TRAN should be noted. As the SPX consolidated sideways all year and looks like it is possibly rolling over, we now see an attempt at a recovery by the trannies?
Breaks above the red dotted down trend line & 50sma. Watch that overhead resistance. A move above 8600 is pretty bullish.
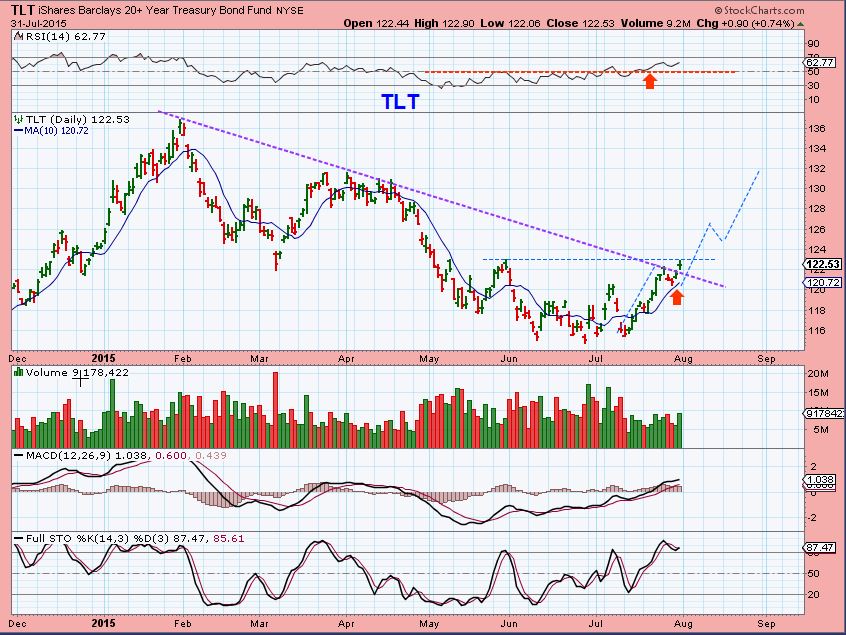
I think that the Bonds – TLT – are bullish in the weekly & Daily chart, so lets just look at that.
WKLY – found support and is breaking out?
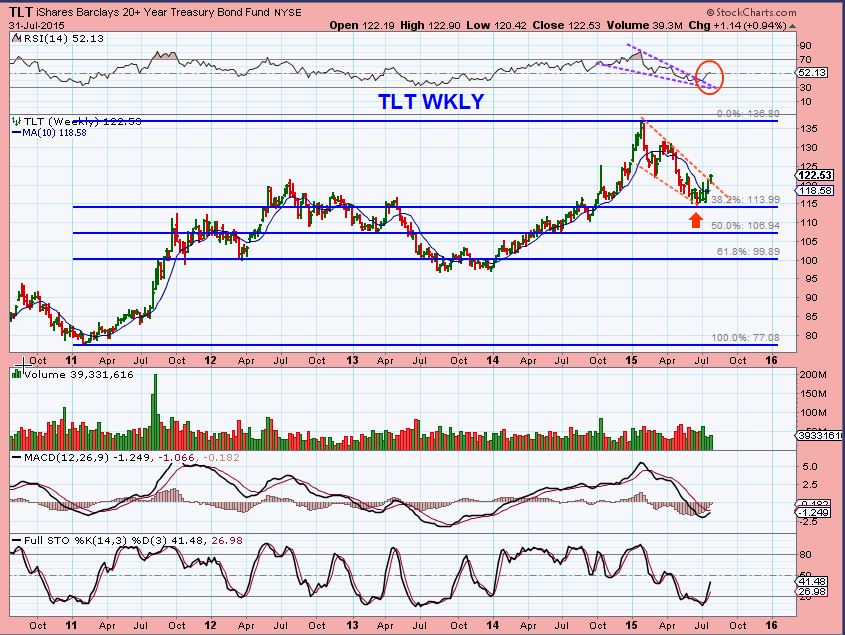
Daily – Breaking out
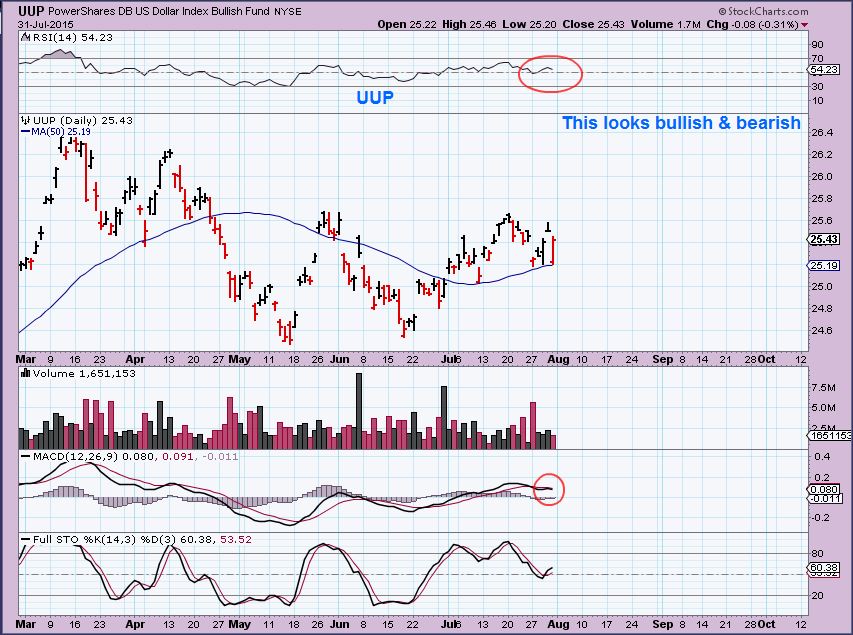
USD – the US Dollar basically looks like a bullish set up, but is at resistance . Also …
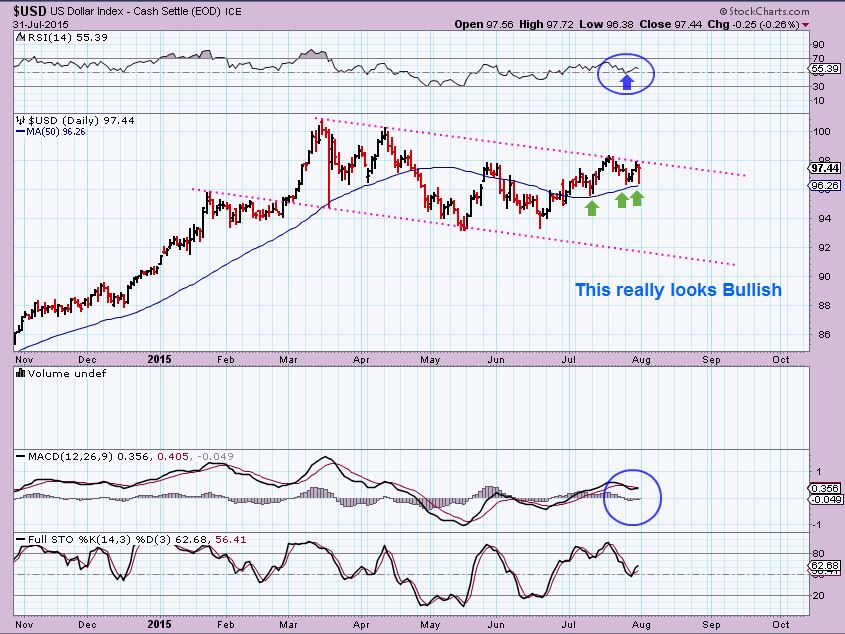
The UUP is not as bullish, so I am “neutral” until we see this weeks actions.
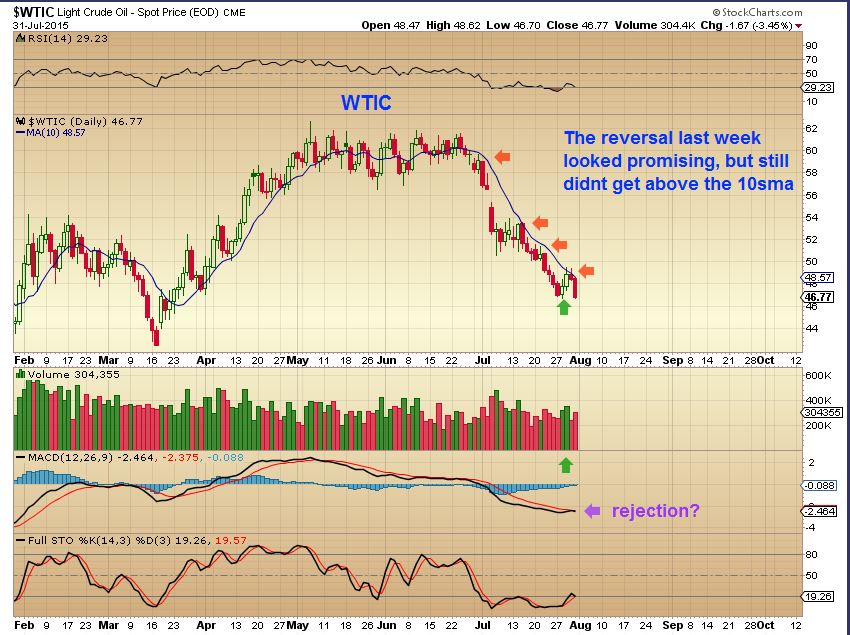
$WTIC – oil looked promising on last weeks 2 day reversal really, but it has yet to show me any real strength. Cycle-wise it is due for a low, but until we see strength, it is involved in a bearish drop. Do not go long with OIL under the 10sma.
NATGAS– Was looking good for quite a while, but I pointed out this resistance on the bigger time frame on July 24.
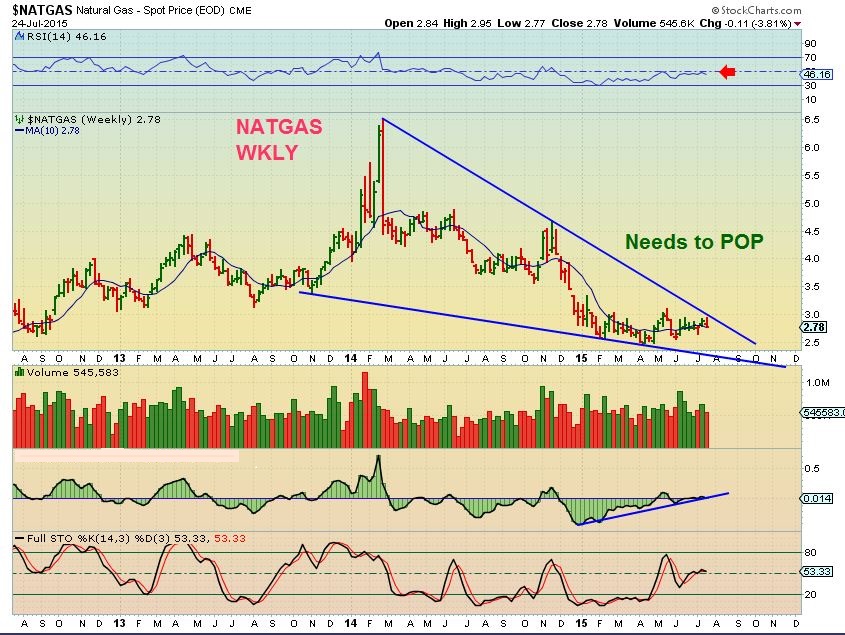
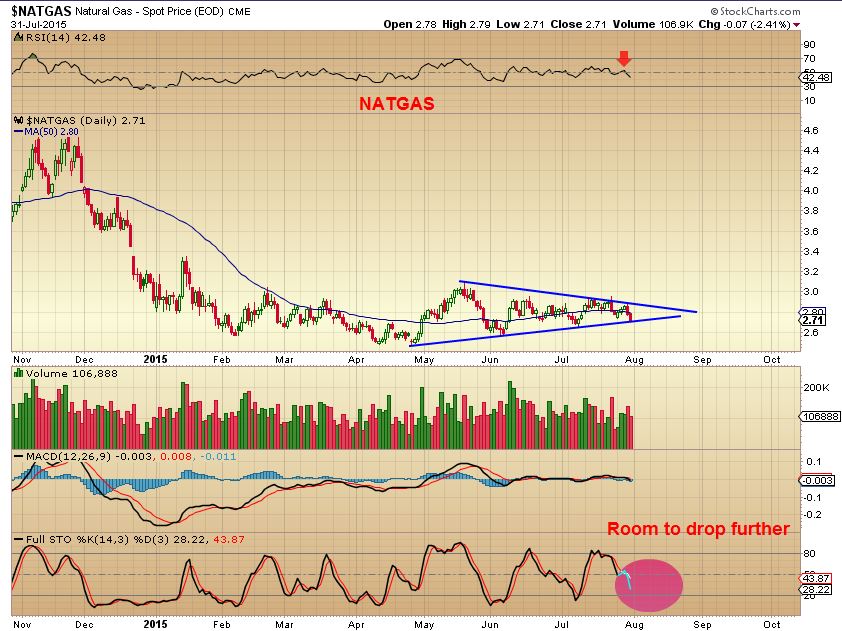
NATGAS has since dropped and could be turning bearish, losing the 50sma last week. Like OIL, it is taking quite a while to push higher and time may be running out (Cycle wise) . Watch support here, there is plenty of room to drop.
GOLD SILVER & MINERS
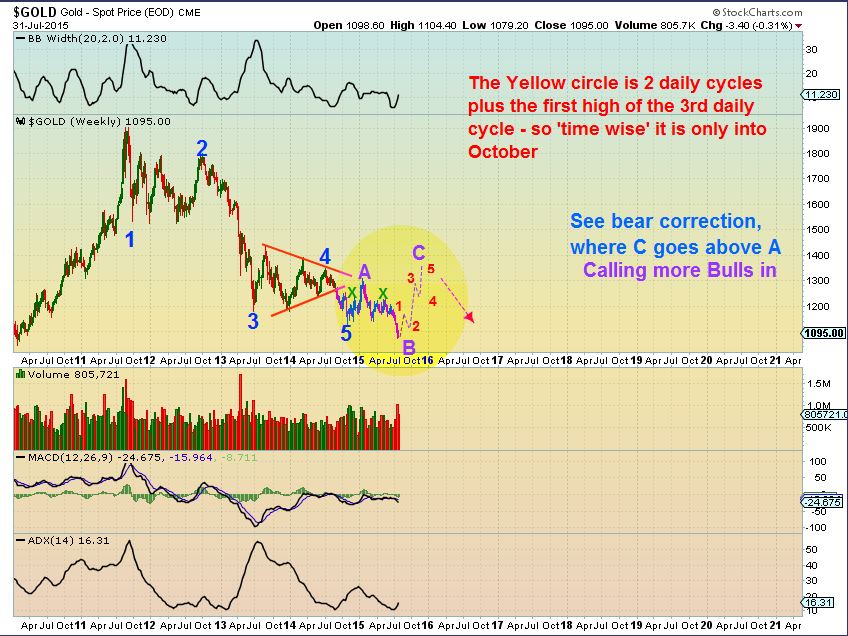
I could just write that “Nothing has changed, it is a very Bullish set up in the next few weeks.” I do expect that an ICL may be in right here and now, with a rally to follow for several weeks ( not straight up, but a stairway higher). Could we slam down to tag $1033 area? Or $1000? Maybe, but it does not have to happen, I will show you why.
I decided to add extra analysis and view points, because what else can I say? Sideways all week, I’m still Bullish. 🙂 I have said that this is an extremely bullish set up, meanwhile all last week we were balancing like the header picture. So lets look at “other stuff’.
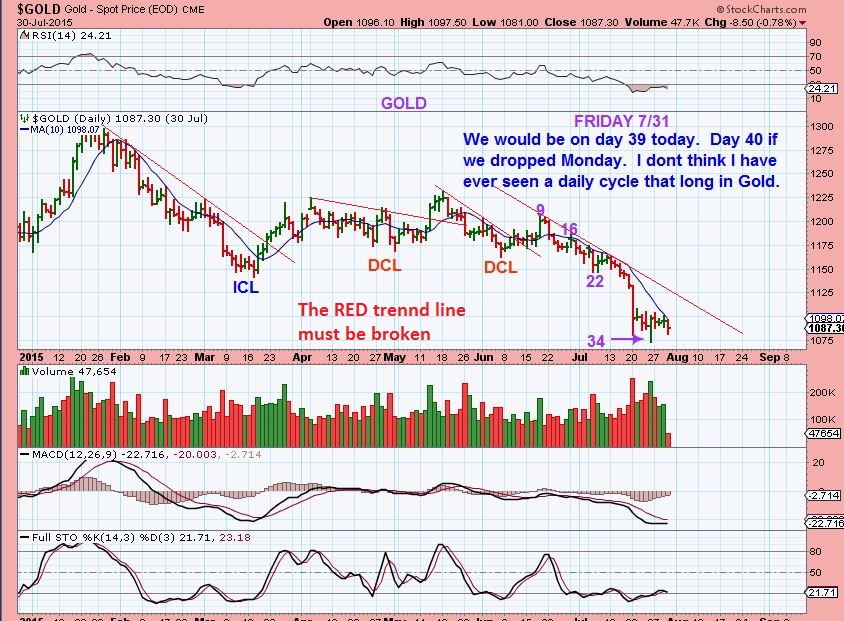
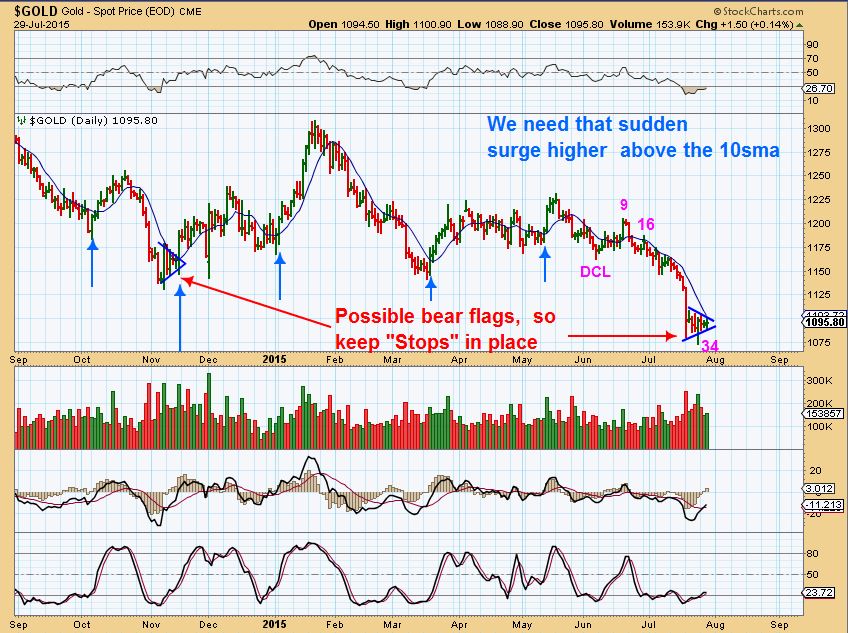
GOLD– Most likely an ICL at day 34, but the Daily Swing from day 34 has not ‘confirmed’ as a DCL ( or ICL), so a break below $1072.30 would be DAY 40!! VERY VERY STRETCHED cycle wise. I think we rally higher this week.
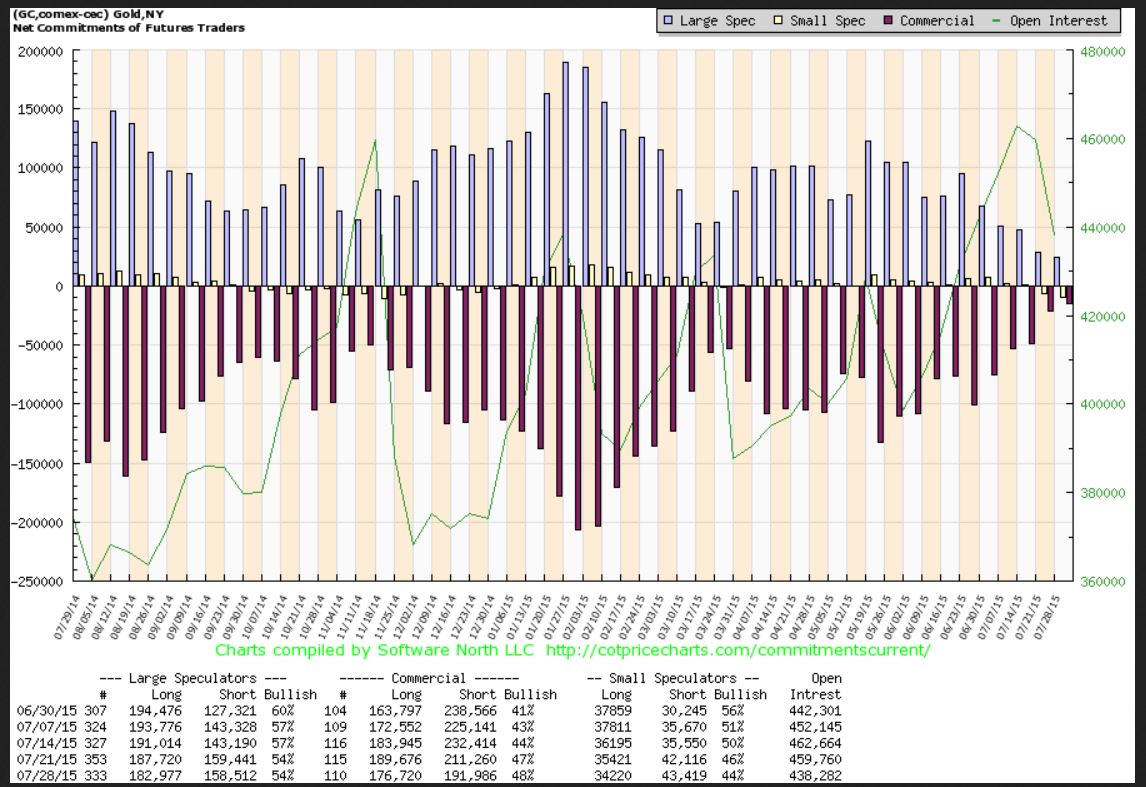
Golds C.O.T. – UBER BULLISH friends. This shows SMART MONEY expects a rally, they are closing their shorts in a BIG way.
GDX WKLY – Oversold and on the trendline support. Lower low and higher divergence in the MACD. Bullish.
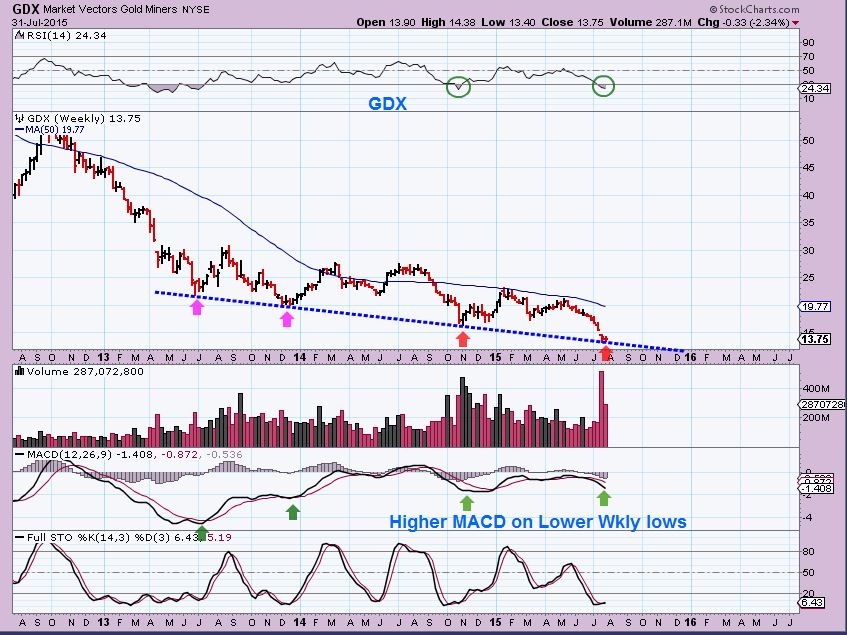
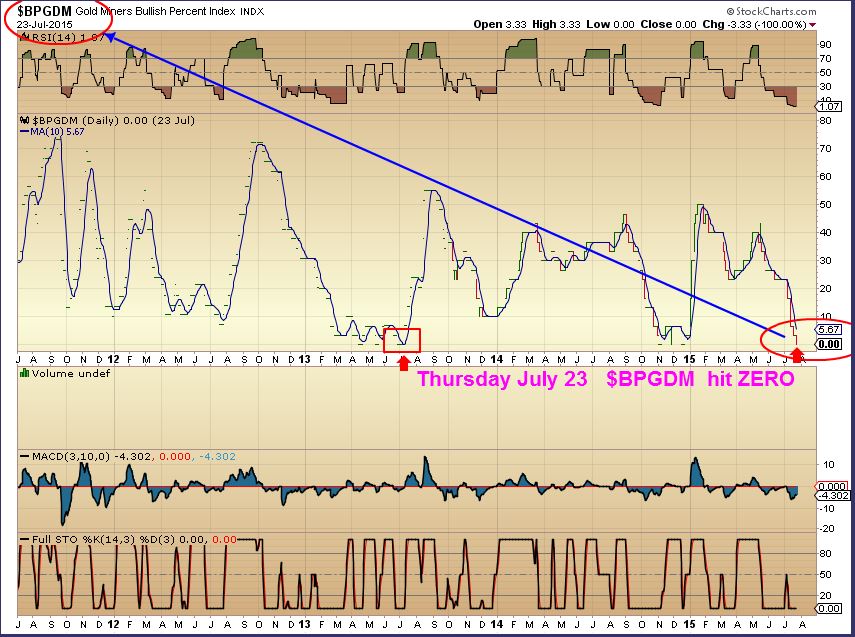
REMINDER- The BPGDM is still at ZERO = BULLISH OVERSOLD EXTREME
OK – that was what we have been talking about all week. Nothing has changed, it is a bullish set up ( currently going sideways). Yes we are lingering at the lows like I warned we could. I showed prior lows and pointed out that hanging at the lows bores people , others cry out “Bear Flag”, people say it “looks so weak” and they start going short. Even a quick ‘shake out’ from here can scare all new “longs” out. Now we continue to hurry up & wait. 
MORE STUFF
Reminder chart from 7/29/15 For those waiting patiently for a safer entry – you want to see that surge above the 10sma.
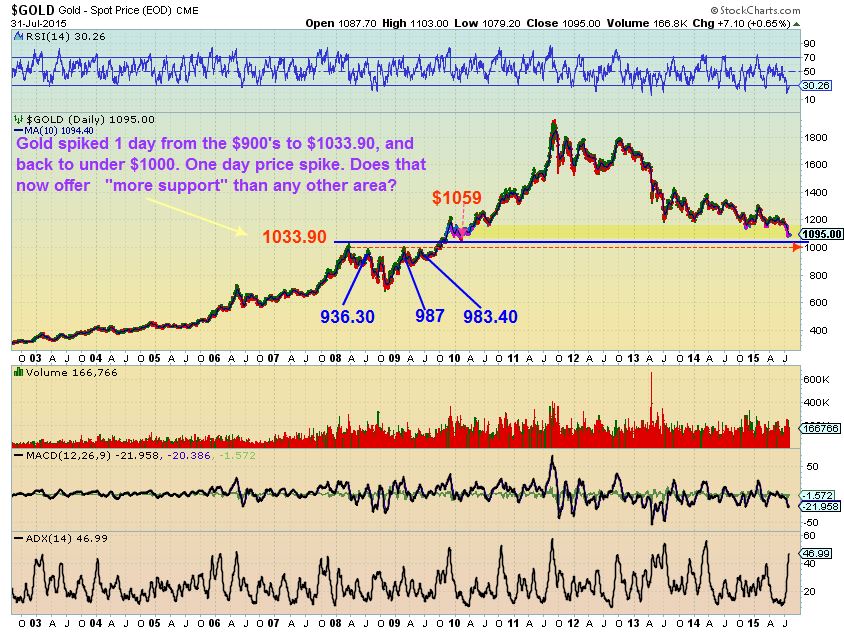
In the past I have mentioned the 1033 area as a possible target. Why? We broke out above that area and often past ‘break outs’ are “tested” later. THAT is why I said that we could go there.
MY CHART from July 28 – I said it could complete a “Back test”.
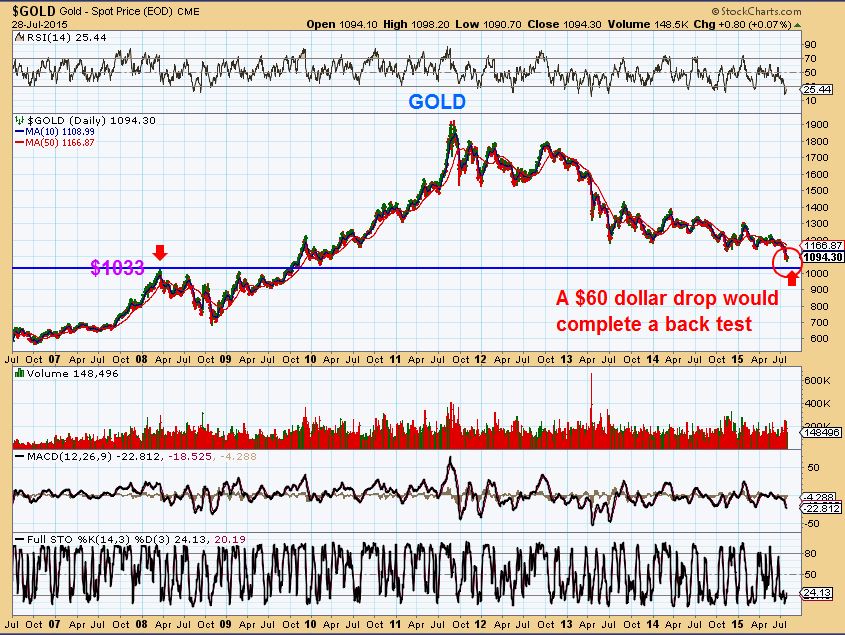
Look at that area. It was a 1 day spike to 1033.90 and a drop . Does that offer “Much stronger support”? You decide.
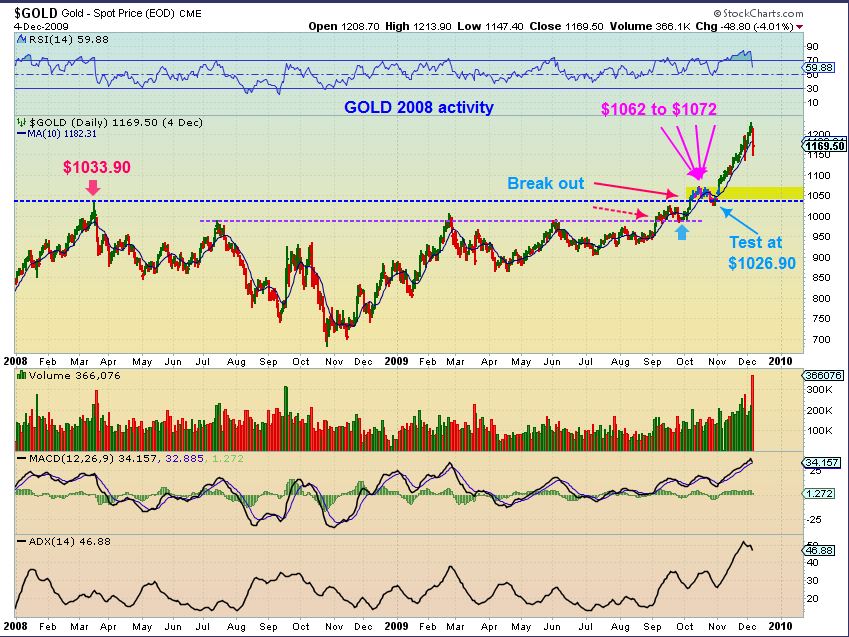
GOLD 2008 “test”. Noticed that the ‘one day spike’ of $1033.90 area may have already experienced a minor ‘back test’ back in Oct 2009’s break out . We bounced around the $1070 area, where Gold is bouncing currently. So we have some minor support right here & below. Stronger support is also below $1000. A one day price spike to 1033.90 does not offer ‘Much stronger support’ in my opinion. The purple dotted line is stronger support.
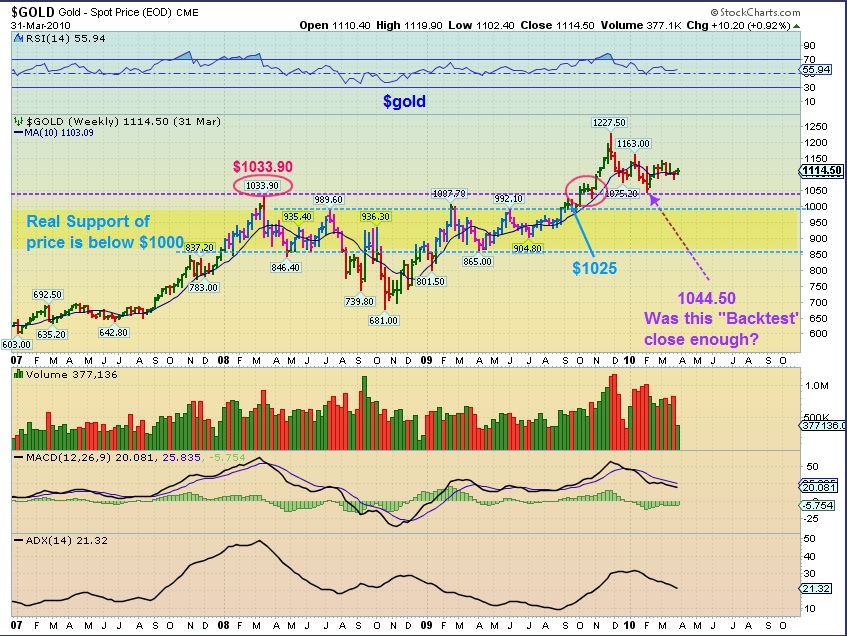
We even did a back test to $1044 later on in 2010. It couldnt even drop to 1033 back then . Support would be higher in that sideways consolidation zone around $1050 – $1160, and we’ve bottomed there so far. Then stronger support is below $1000.
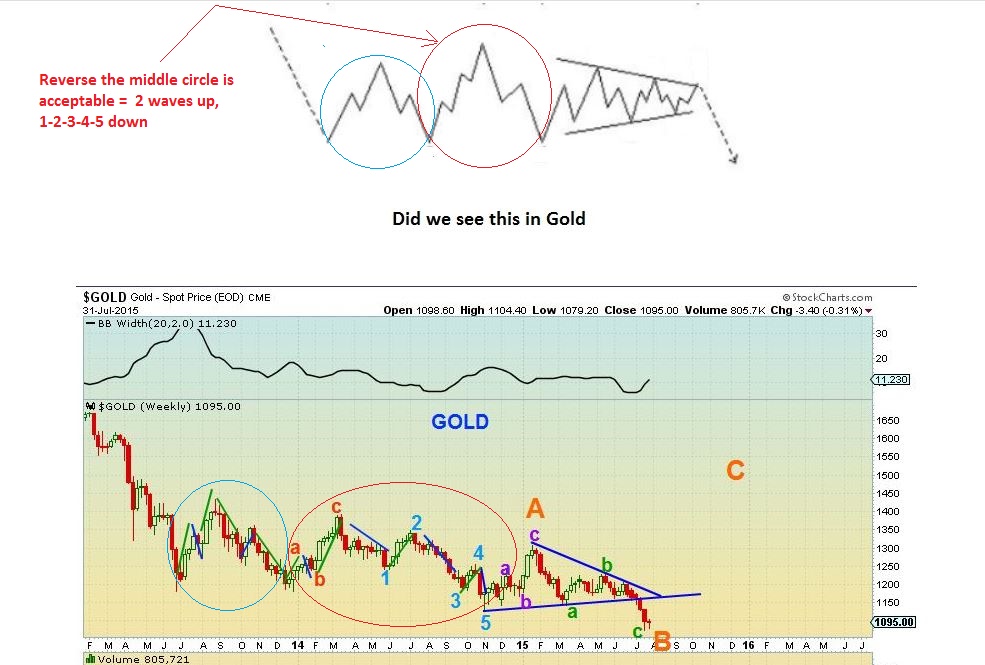
Lets get back to where we are now. Look at this corrective pattern that I found in a “BEAR CORRECTION in E.W.” I added 2 green stars simply for a visual, you may see
1. A small H&S
2. Then a slight Break down to under cut it
3. Followed by a run higher.
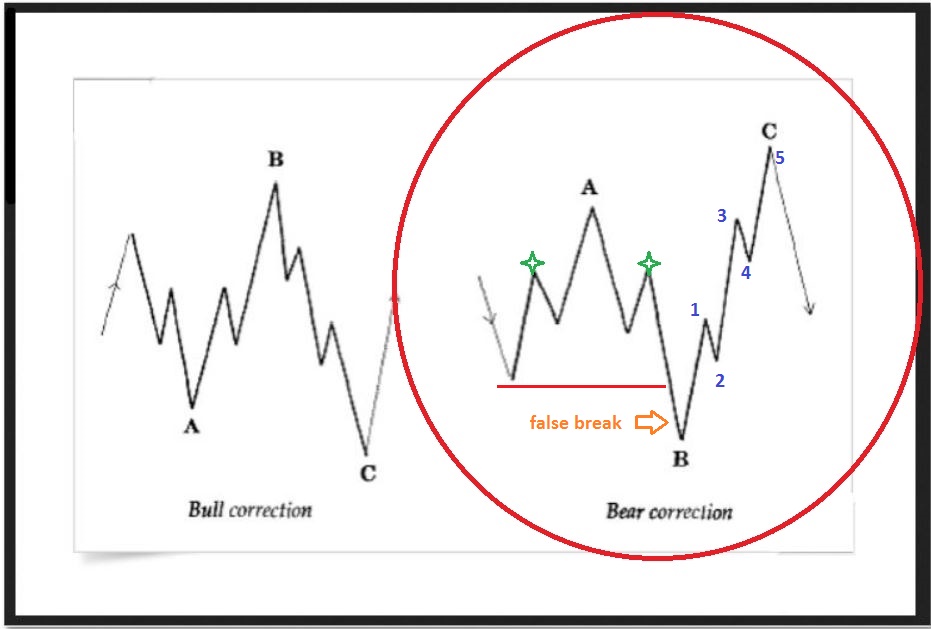
Now look at GOLD 7-30 – compare the last year to the above pattern. Oct 2014 to Oct 2015
This is an extended corrective pattern in E.W. (Click able)
There are many possibilities going forward, I have more charts that I got carried away with over the weekend that I will hold off from posting. Lets just say this…
The current set up has the markings of an ICL. A very Bullish trade-able low. It is extreme in many ways – as I have shown in past reports and this one, so I have to expect it to break higher soon . When it does, it should rally for weeks. I was bored to tears last week, because last weeks Precious Metals report was also expecting a nice rally and I wanted to get positioned in Miners and then just go outside and enjoy the summer, not micro manage my positions.


I hold a position currently, and a slam down Sunday night in Gold/Silver could be an opportunity to buy , add to , or start a position. One would wait for a reversal to be safe. A safer buy is a break above the 10sma. Personally – I think that the LOWS ARE IN. I do not expect a 4th daily cycle , because of the extremes we are seeing at this sell off. My end of the day Friday alert was just to help you all to think about the weekend and how you want to be positioned in case we do get that Sunday sell off, since Anything is possible.
I Hope you all had a great weekend and I hope that we all have a better week of trading. I am focused on the Precious Metals, it should be the best % trades available in the coming rally.
~ALEX
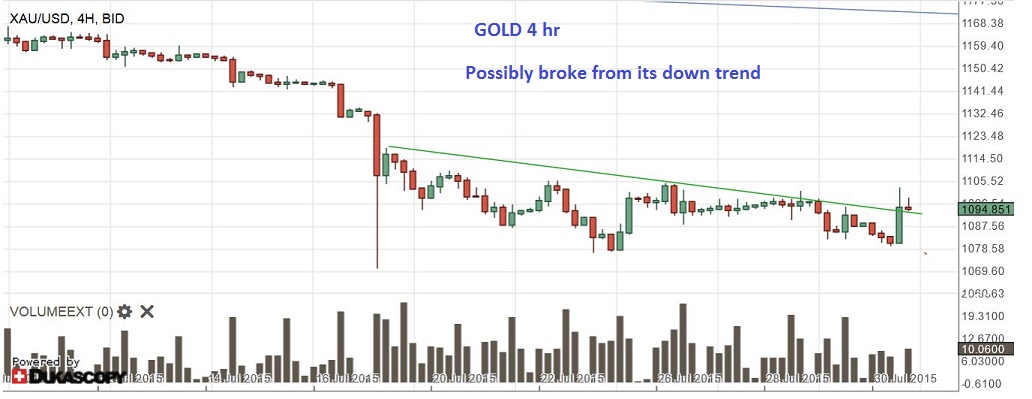
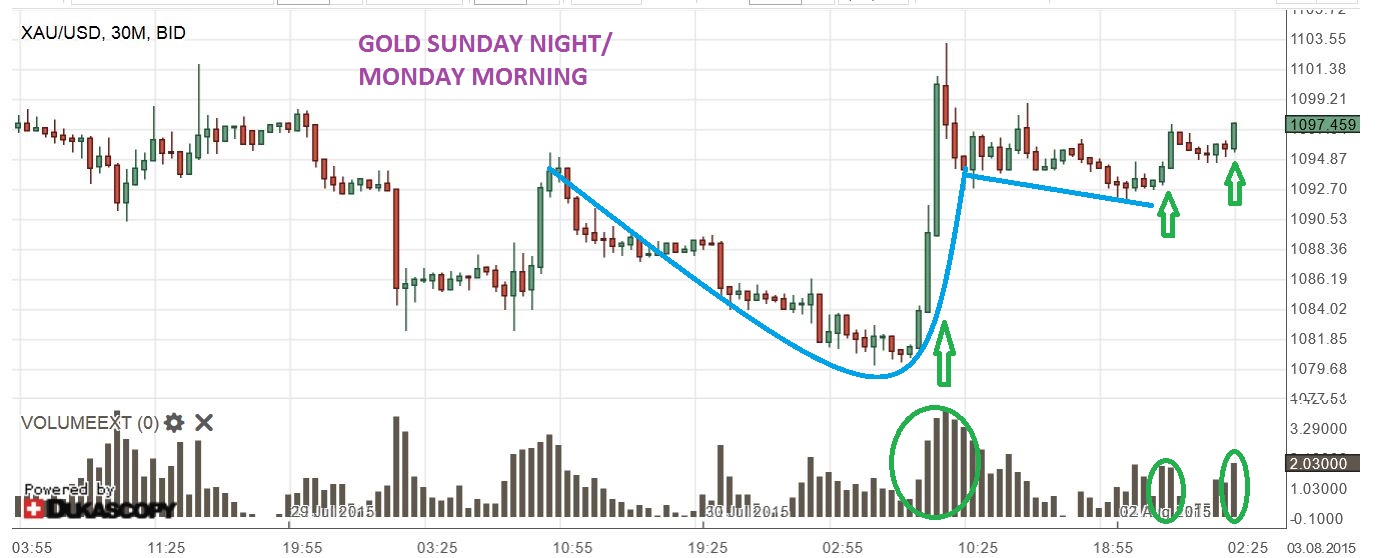
P.S. I think you have seen the lows in GOLD and I posted this possible Break out Friday
I showed this Cup & Handle, with the handle forming
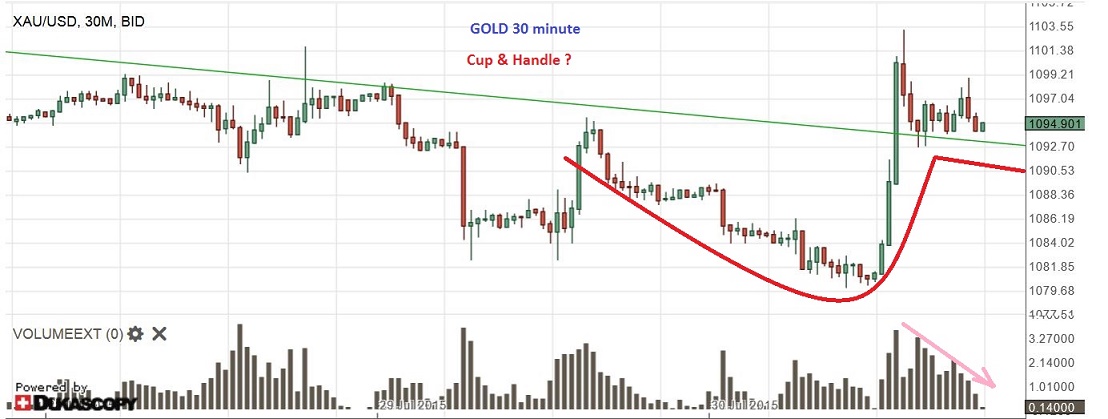
This is at 3 A.M. Monday Morning . We’ve since dropped to the $1092 area again. We’ll see if this $1090 area holds up as a handle.


loooook at CFEW … it’s fun looking for patterns…isnt it? LOL
3am? oh my
..oorah
reminds me of when I was very young … putting together 1000 pc puzzles… i was a bit too engrossed & competitive searching for those pieces think … lol
i should have KNOWN then there was something a little ‘off’ with young Maria … ;o)
Hi Maria- hope ur wkend was good. The 3 a.m. was an insomniac moment, and you want to see intriguing patterns, hit this link.
http://www.bing.com/images/search?q=fibonacci+in+nature&qpvt=fibonacci+in+nature&qpvt=fibonacci+in+nature&FORM=IGRE
: ) I LOVE that stuff in nature.
The answer to the ultimate question https://www.youtube.com/watch?v=2XifmNqBJWw
THATS IT! The answer is 42!
We are on day 40 if the gold market drops, so you are saying that WED will be the lows in Gold.
Nice work JD!! : )
Er, hmmm, yes that’s what um I was saying – if it happens.
Lol
ohhhhh yessss… #Iluvit… i am afraid i am struck w/ the affliction as well … remember this?
i found this while relaxing in my hot tub one day … i was looking up studying the grains in the woodwork of the ceiling … and i found THIS!! among many other animals.. freeeeeeeeaky… I literally jumped… yikes!!
That is kind of FREAKY! Hot tub looks nice though.
hot tub looks nice? lol … freakn me out right now Bill… LOL!!!
every time i sink into the water… I peer up and shiver…ha ha..ha
I am smiling, didn’t mean to startle you!
;o)
…seriously though … i swear i see the eyes move sometimes .HA HA HA …. my electrician told me he put a hidden camera in them…bustin my chops of course…. 2funny
i actually clicked on the image to see if i uploaded the WRONG one…phew .. i was sweating it there for a minute… ;o)
Some people get the face of Jesus in their woodgrain patterns… trust you to get an owl!
I thought it looked like ET’s evil twin…. but i actually did find an owl and a polar bear..lol
Yes i can see ET.
Struggling with the polar bear
Mostly though, it looks like a couple having sex on the beach… and i think you should stop posting dirty pictures to the comments
(oh yes.. the old jokes are the best)
Oh my..
noo.. polar bear is in different place…not in this pic
better just check.. you are familiar with the Rorschach joke??
https://www.google.co.uk/?gws_rd=ssl#q=rorschach+joke+dirty+pictures
Ahh i found the right comment…lol..
Nerve wracking for sure, for anybody with a position in PMs.
The stock market is a tough one. I’ve seen some good arguments from seemingly respectable analysts that the breadth issue (lagging AD line, etc.) that would seem to be flashing classic red warning signals is not a real concern because the weakness is concentrated in a couple of sectors (energy, materials) that are normally strong late in the cycle, etc.
But there’s always some of this kind of rationalization at major tops, even from some normally “smart people”, so who knows. It sure is tough even buying a break out from this consolidation because of valuations and the age of the bull. But the central banks continue to be the wild card and who knows what kind of unprecedented conditions we’ll end up seeing before this is all over.
Any thoughts on that whole breadth issue, Alex?
I actually agree that it would normally be a warning sign. I’ve also pointed out the lagging SOX, TRAN, UTILITIES< etc as toppy action. I think the Fed can prolong things but not prevent the inevitable. SO then the question is when and will we just roll over or is the roll over in the other sectors the warning and we wake up to a flash crash type drop?
Its a timing thing , and things seem a bit distorted at this time.
Yep, it’s a tough one. Thx
Congratulations to AAU, SVLC, EGO, RBY , TC , and a few others for taking the lead off of the lows down here.
AAU up 13 % ?
i like akg for a swing… no? https://www.tradingview.com/x/zBcNpx4Z/
That chart of ZIOP played out perfectly. Now the cup is formed and a break out can come next ( or after a handle forms).
Be careful with ZIOP. Looks to be forming a Bat Harmonic pattern. Just be cautious,
Good report Alex. I’m think we are real close to a bottom. I think the lows are in in miners. UGAZ (refresh) I’m looking to buyt at $1.75 and USOIL at $43. USOIL still following the chart pattern I copied earlier.
UGAZ might get there, but also NATGAS itself seems to be on support (Chart in report).
GDX, (refresh) bottoming. When you go back and look at the bottom process for GDX back in June and December 2013 (patterns in red at page top), it took about 13 days to base out before the move higher. We are in day 11 currently. So we may get a lift off this week. We may even get a new low but I doubt it.
Bill, you looking to play NUGT again here? Down at the lower end of the range you chatted last week. If your chart above holds, this would be,a decent entry spot.
I’m having a lot of trouble with the swings right now as we can’t sustain momentum so am likely sticking to 24 hours and under until we get some new bull evidence in.
Cason, I sold some NUGT last week around $3.58 bought it back at $3.25 just now. GOLD is holding up better than miners. Not sure why the sell down this morning? Taking a chance.
Agree with you. Just put in my JNUG limit buy order to repeat last Friday’s action.
GDX has a bullish MACD cross, and a diverging RSI. This could end any day and really pop. OF COURSE, we have to be ready for the opposite to happen.
This doesn’t look good.
Yeah, clearly I was too early. Pretty much getting hammered today. 🙁
Miners are lower than Thursday when gold was another $10 lower. All bottoms are different, but this one sucks.
Yup, me too. getting close to a double bottom in GDX? I’ll buy there if it happens.
One more thrust down for gold for the always elusive quadruple bottom (dripping with sarcasm)?
I grabbed JNUG for a quick 1 day trade. I won’t add to GDX until I actually see something positive, can’t throw anymore at it down here.
Markets really rolled over after lunch, may/may not support P.M.s Oil almost down to test March lows, absolutely inevitable at this point, question is does that become a buy?
Really upset with myself. Known fact in day’s like today that low point is usually at 3:55 PM or tested them. Broke my own rules to by early and that did not work out well.
Trying to understand fundamentally why this isn’t working, I guess bears are so aggressive they just short any minor move up a new?
Is that true? Lowest point right before close? What about up days
No, no, sorry wasn’t clear. Only on big down days. Look at all 10% or more down days, except for the 1 reversal (which you have to spot), low is afternoon and tested just before close. Remeber COMEX closes at 1:30 so physical metals are in thin electronic trading. Which is why they get pushed down so easy in afternoon. On up days, usually surges back to high near close. On down days, unless there is a huge reversal (2 Fridays ago), buying midday is a bad deal, regardless of targets.
Very interesting. .will ck that out.
Tx C
USD (refresh) looks to be forming a Gartley harmonic pattern which would indicate a drop here.
You can expect GOLD & MINERS to surge in the next hour or so ,
simply because I am bored and I’m going outside to play for a while. 🙂
So true
Recent flush about half hour ago took me out of CDE. Clearly going to have to pick better if want an individual name. It’s down more than 3x leveraged junior counterpart. Oh, well, likely sticking to day/single overnight trades, clearly too early to swing.
WTIC has today fallen below 78% FIB (March low to May high) and currently sitting on it. Last line of defence?
OIH putting in what could be a bottoming candle
For those (like Alex) bored wait for PMs to get their stuff straight, I’ve talked some about trading IMH, good range trading. I sold in the break higher Thurs before it gave it all back on Fri. 10 day SMA spy right now with 20/50 just below. I may re-enter if it goes back on sale. Had a chart but site isn’t letting me post right now (error message).
PLUG POWER?
im liking BAS..looks like it’s in 4 correction, about to start 5th wave now
ERY which is a bear energy ETF may be at a double top, which would be good for the sector. I’m still leaning towards lower oil.
Alex,
GDX: Surge went in wrong direction.
how ugly out there! miners crushed… Dust doing its dance without me…
GDX double bottom. You watching this Alex?
DB on GDX. it was a touch and go.
I see a bull flag on /GC.
entered a small NUGT position to ride the bounce.
Mind you.. HUI & XAU broken to new lows today
Anyone have any thoughts on WNDW?
NEW REPORT POSTED 10 P.M. Monday Night
NEW REPORT