
How’s It Going?
For months I have been pointing out this Rising Bearish Wedge and then a possible topping process ? Just a few of those charts posted are below. March, June and then AUG 17, 2015
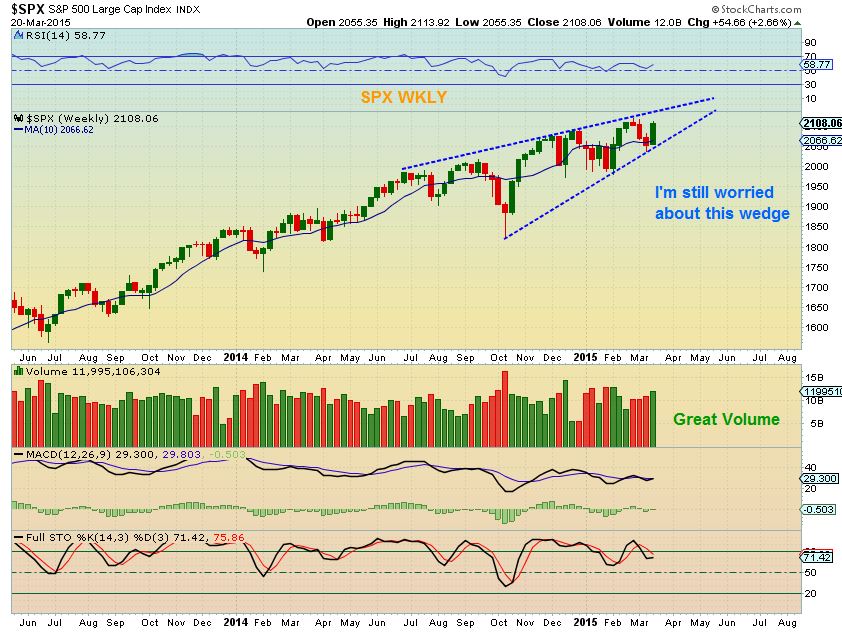
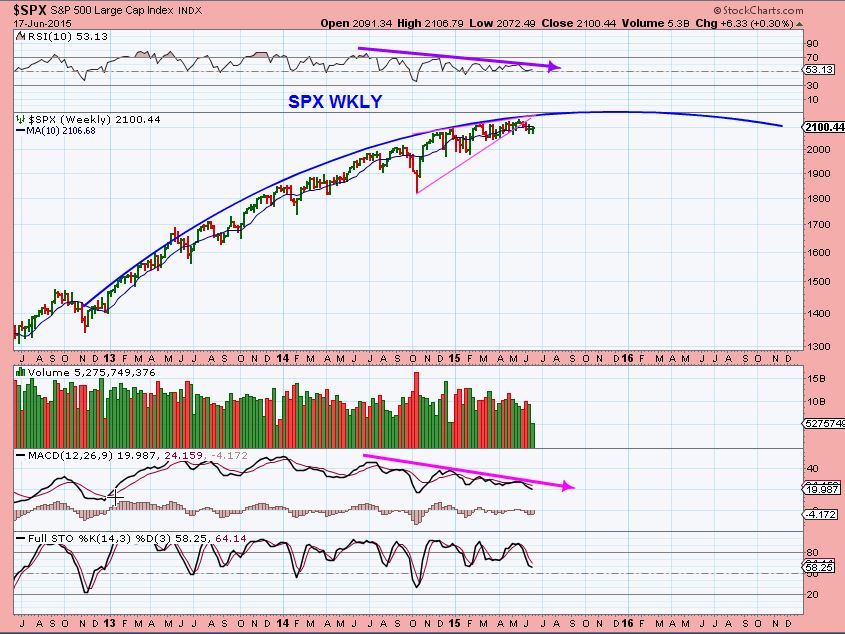
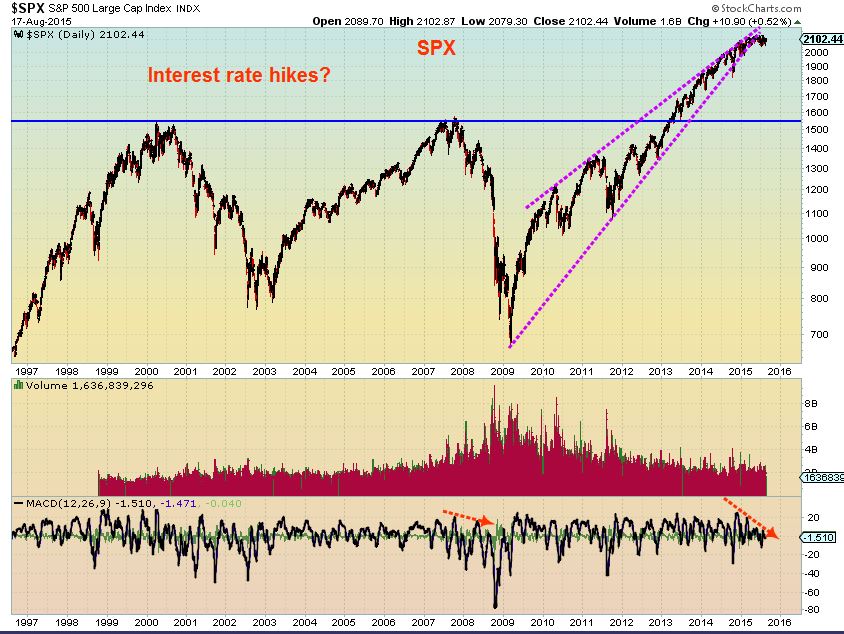
We cant say that this topping process was exactly a surprise…
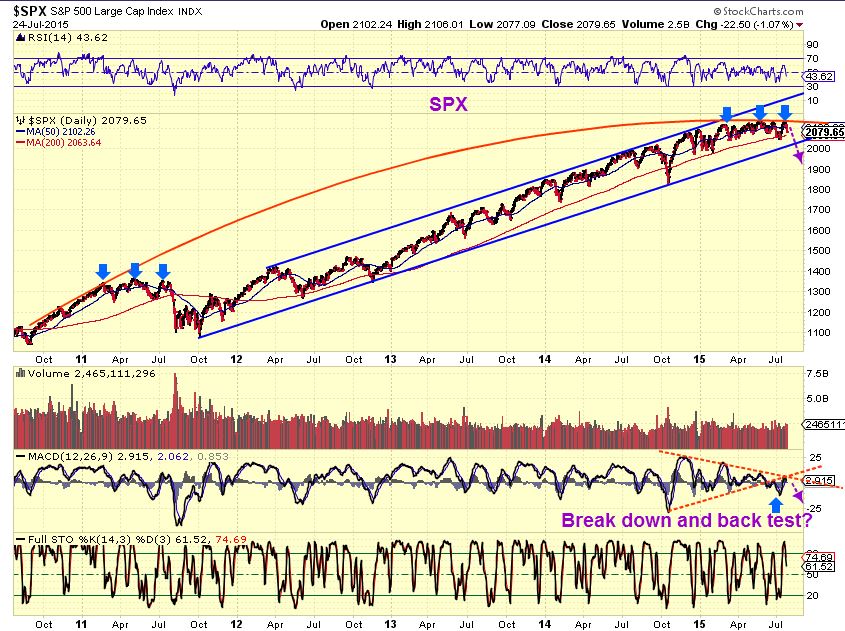
As I have repeatedly mentioned, Topping is a process and I have a hard time ‘Shorting’ the very top. You get stopped out repeatedly. This was my chart from July 24. This was actually the top. So what now?
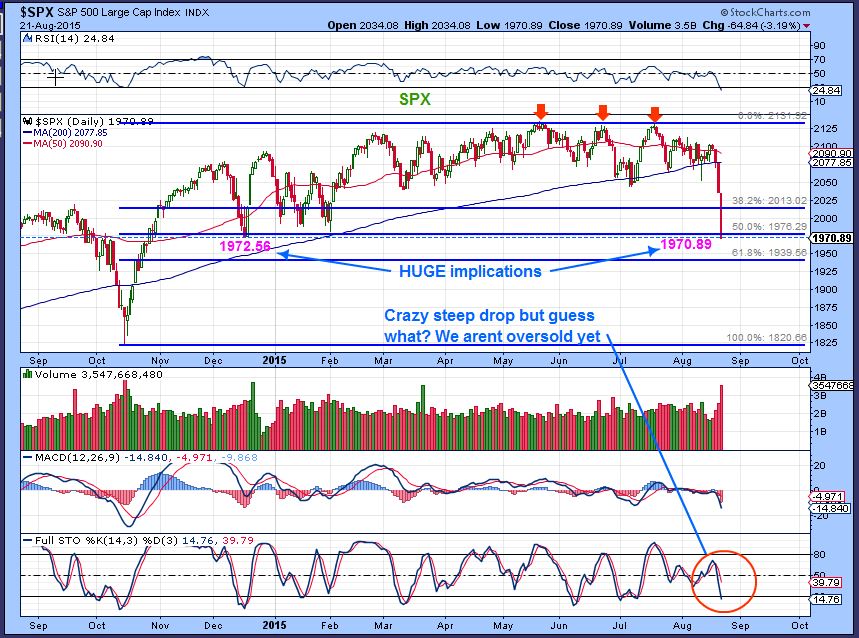
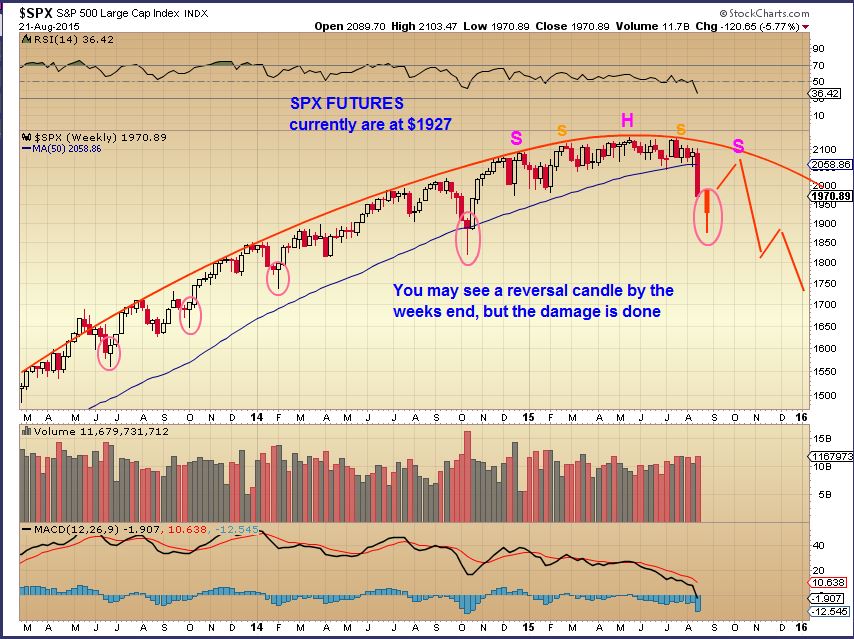
SPX 8-21 – The drop certainly accelerated last week. We are roughly at the 50% mark, but this can keep going. There are HUGE implications to what I am seeing. We broke the July lows and even the Dec lows! Cycle wise this is big. It is too risky to enter short here, but this can continue to drop like a rock. If you went short here, however, a snap back rally can rip your head off. Is there a plan for those that would like to consider shorting? Yes, short the bounce and I will point out one of the best ways to do that.
Let me show you what I have been looking at. A Real CRASH could be coming, or at least a major pullback.
.
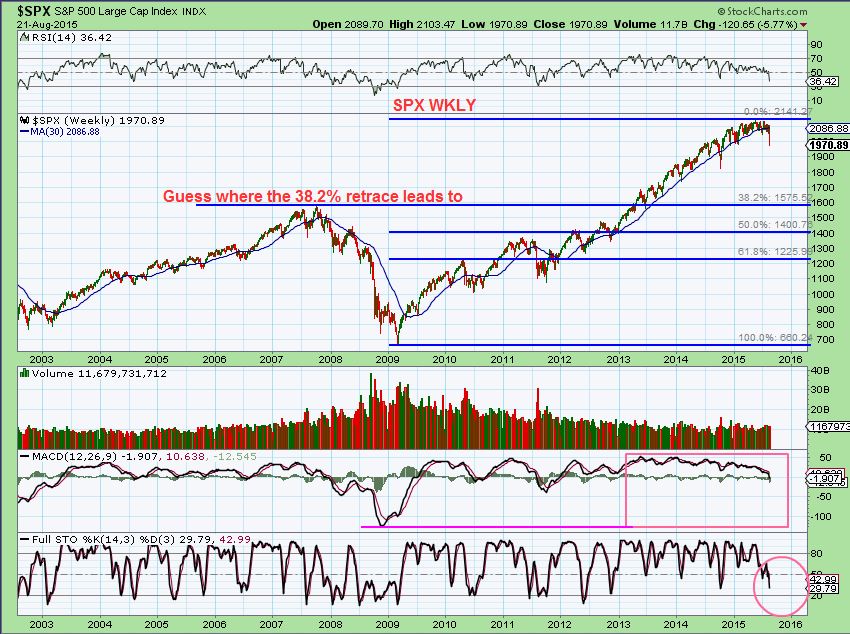
SPX WKLY – Guess where a normal 38.2% retrace takes us?
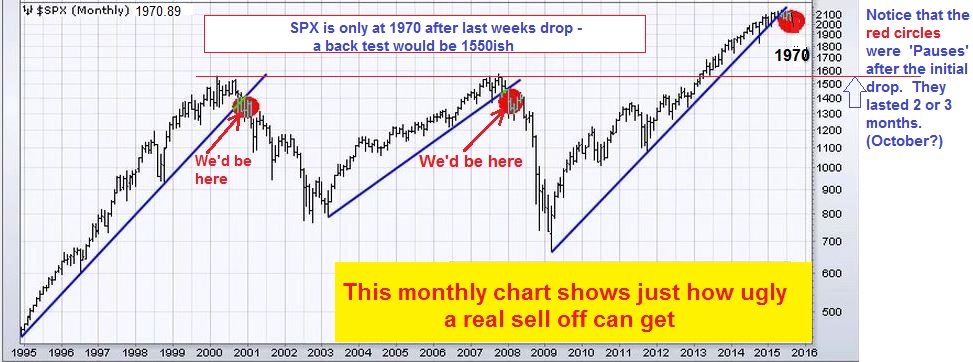
SPX MONTHLY – Could we back test our break out in 2013? Yes. Notice that when a large sell off or even a Crash happened in the past, there was a PAUSE ( in the RED circle) after the initial break down. Since this is a monthly chart, it shows that we paused for a month or 2. NOT a good time to go short.
Note that even in crash mode, the 200sma is often tagged. Short the tag if conditions are right.
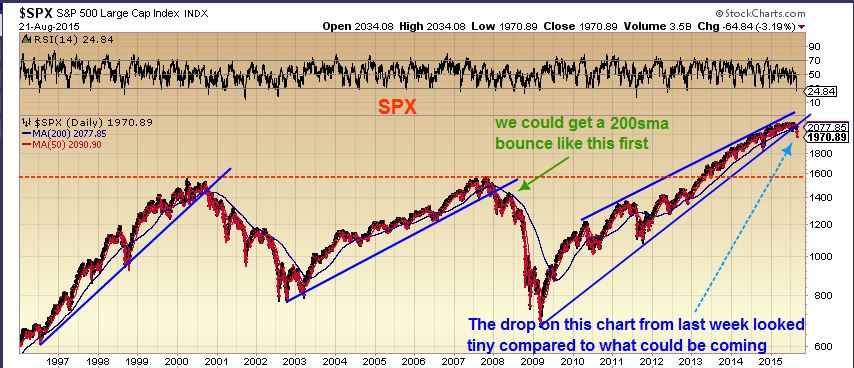
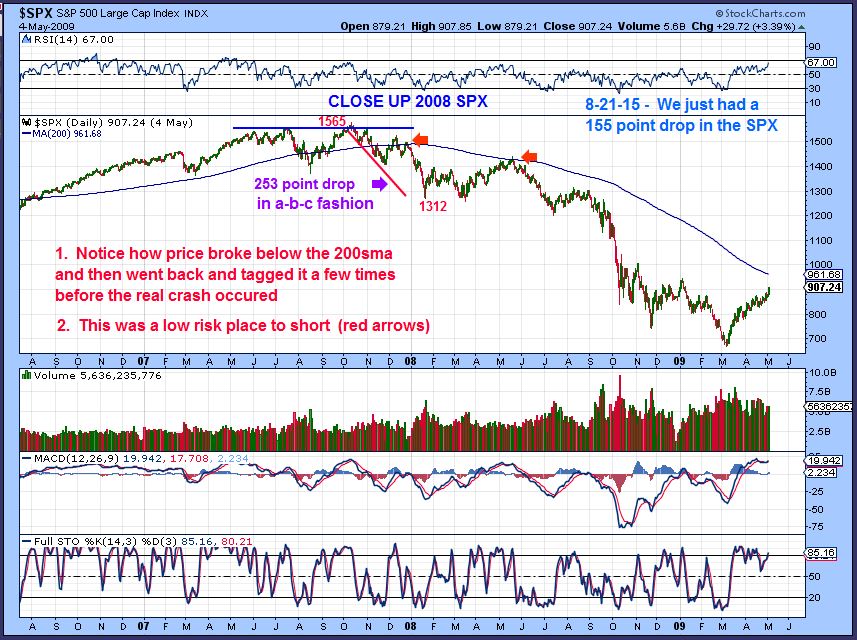
SPX 2008 – Lets zoom in and see how the tag of the 200sma came about. It can be quick or it can take some time to remove the oversold conditions.
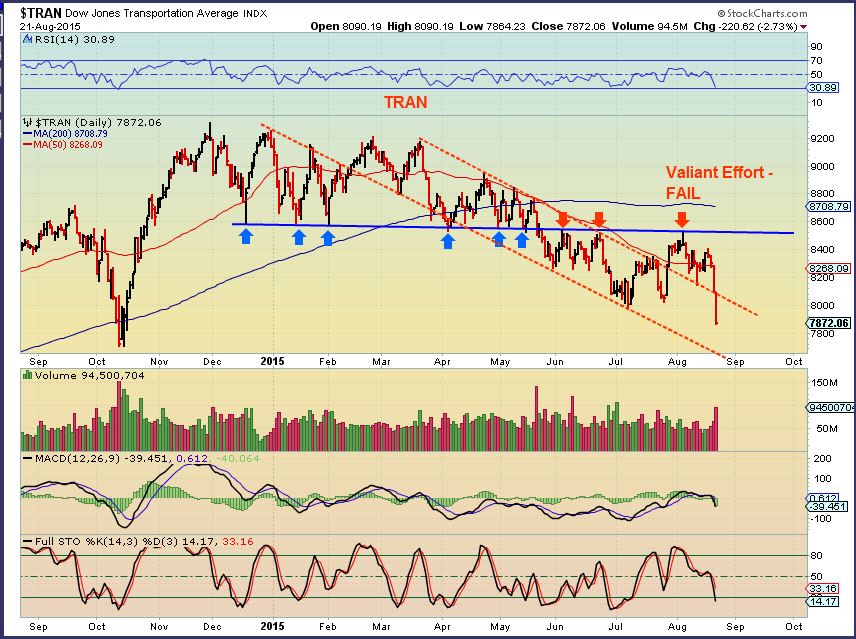
I wont cover all of the various sectors, they are all a bit ugly, but you may remember that recently the TRAN broke down and was trying to recover.
TRAN – IT has resumed its downtrend
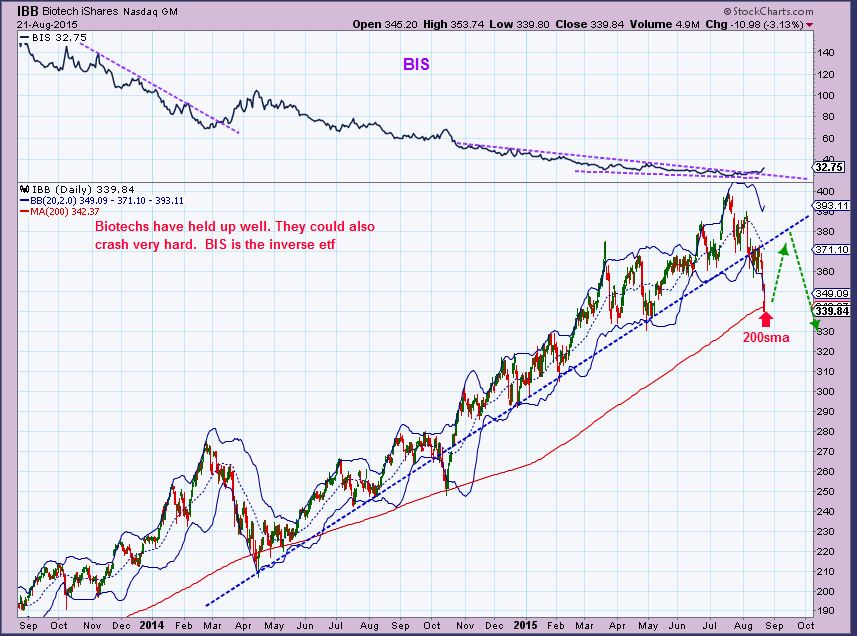
The Biotechs were very strong and have not broken down as much as other areas. BIS is the inverse Ultrashort etf. It looks excellent. IF we get a bounce off of the 200sma in IBB, watch the pullback in BIS.
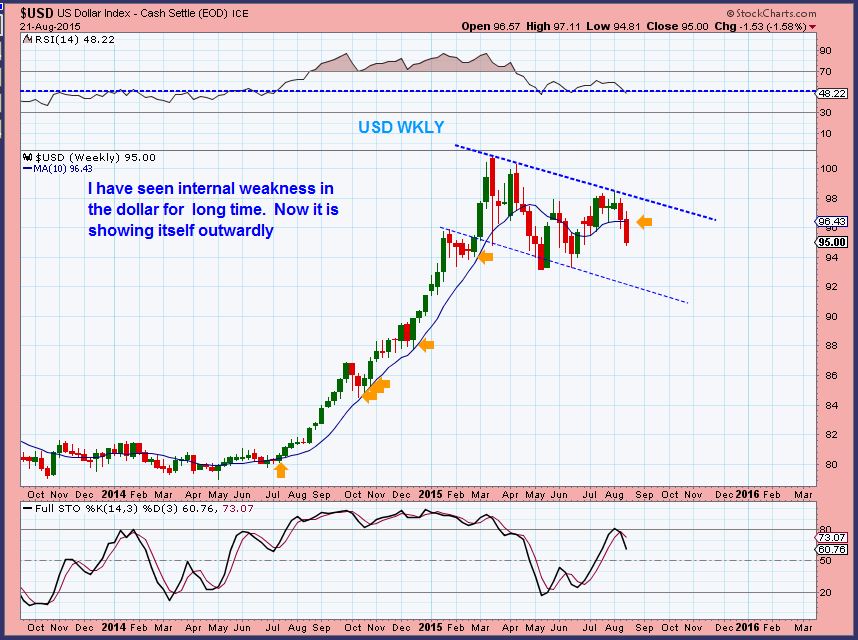
USD WKLY –
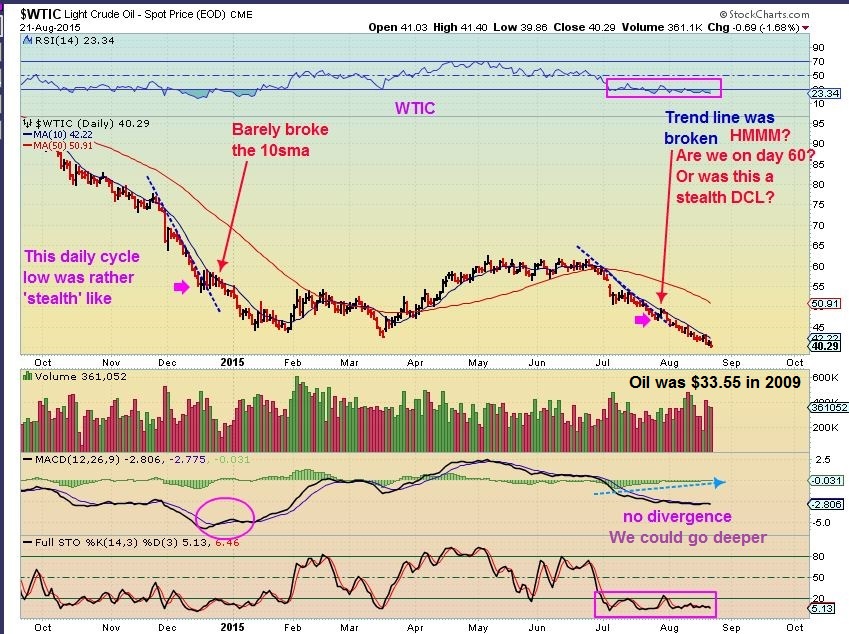
WTIC WKLY – Divergence. Are we heading for the 2009 lows for a true double bottom? I believe that was $33.55
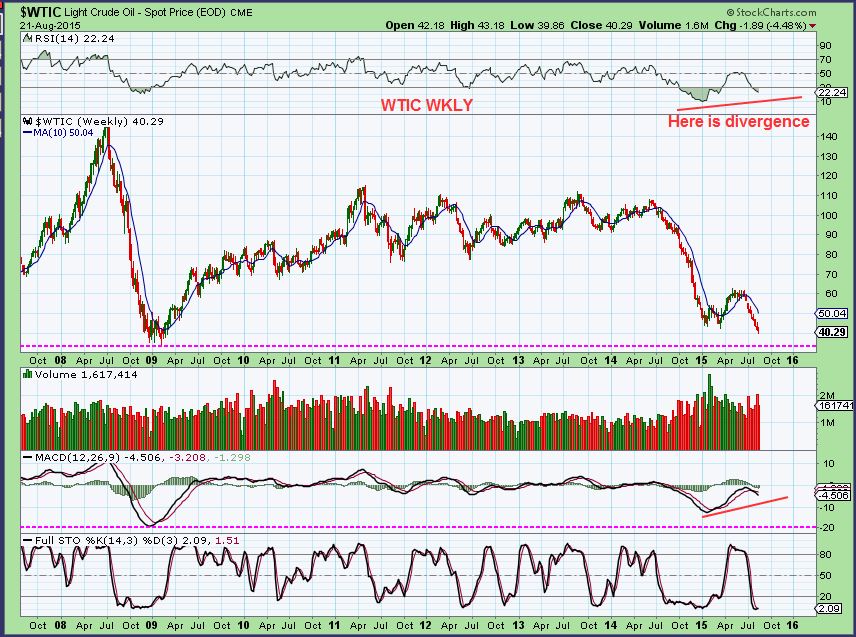
WTIC – I am wondering if we are on day 60?? OR was there a stealth dcl in the middle there?
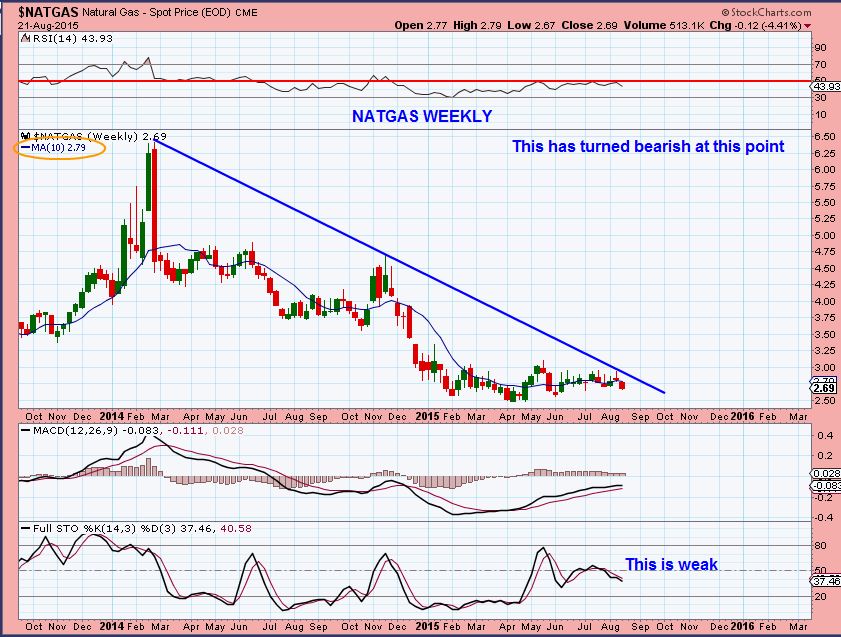
NATGAS looked like a nice bullish set up repeatedly, but it has been more than frustrating in the sideways move. I wanted to step back and look bigger picture and for now I get more of a bearish feel to it. Whether that is short term or longer term remains to be seen.
WEEKLY – Rejected at resistance
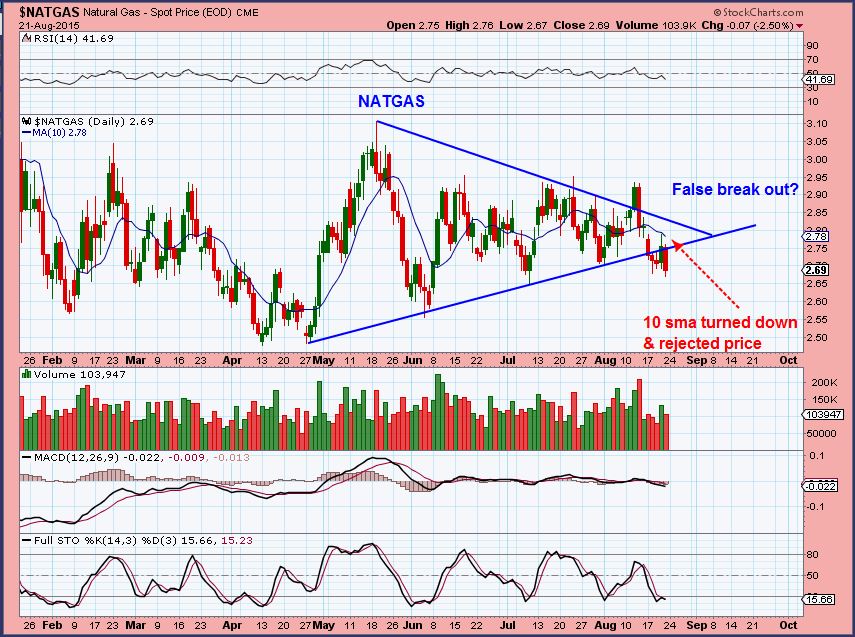
NATGAS DAILY – Possible break down. I am remaining neutral ( not recommending long or short)
GOLD, SILVER, MINERS
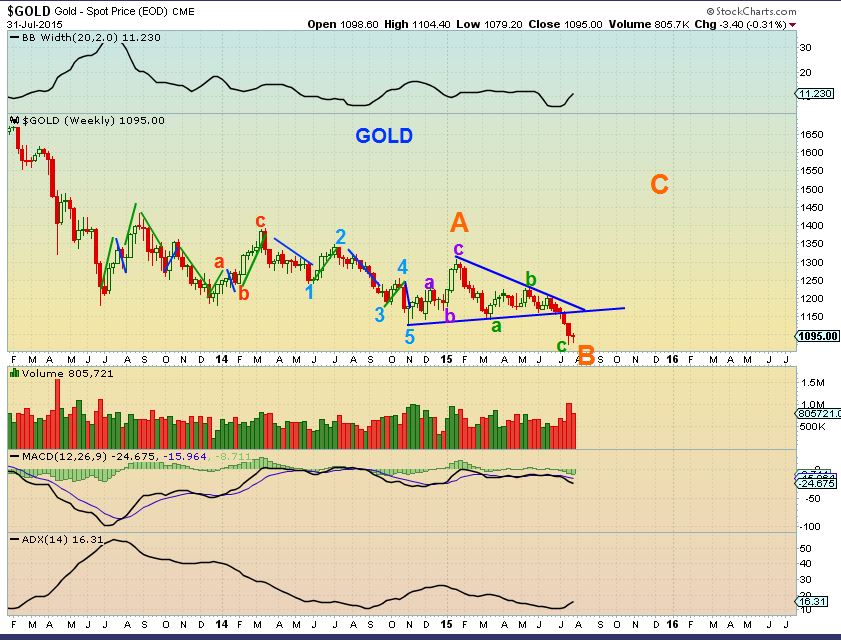
There is a lot to say about this set up. We could have BEAR MARKET LOWS In place, since many are still waiting for the “test” of under $1000 to buy and would be forced to buy much higher. We also could just have a nice strong rally that eventually sucks in the last buyers before it drops to under $1000, and I still think it would look like my old July chart shown here. “C” at $1400 would suck in everyone and then a final drop would cause everyone to “HATE & GIVE UP ON MINERS!”
For now – Lets just take things as they come.
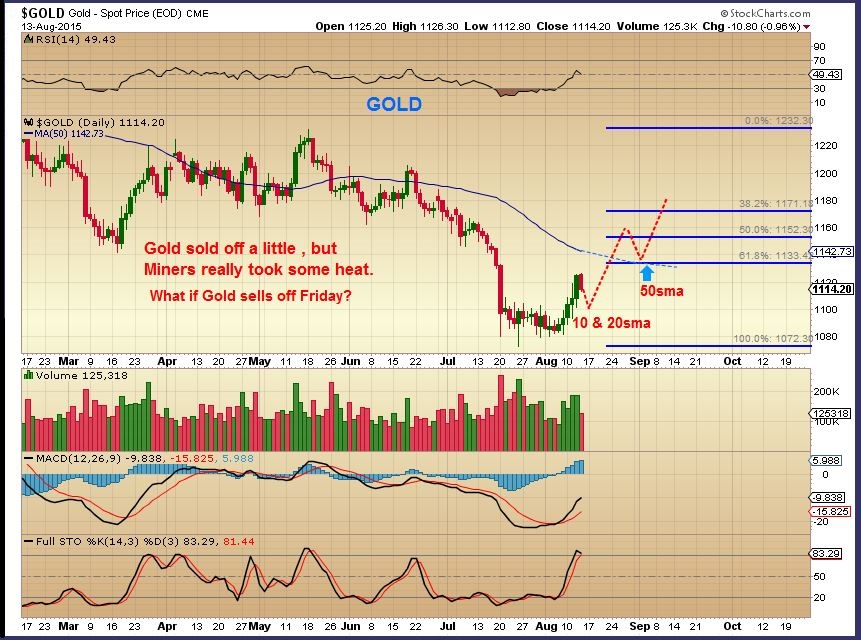
On AUG 13 – I drew the drop to the 10sma for Gold like this, down to 1100.
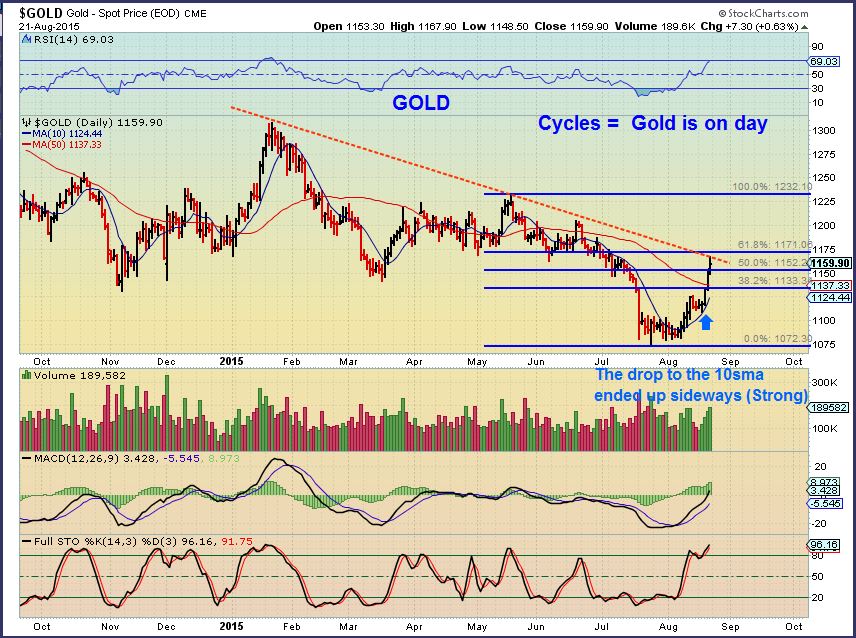
Gold – The drop to the 10sma was a sideways move (Strong). This could complete 1-2-3-4-5 of 1, but we could push even higher. We would have another leg higher to new highs if we pull back.
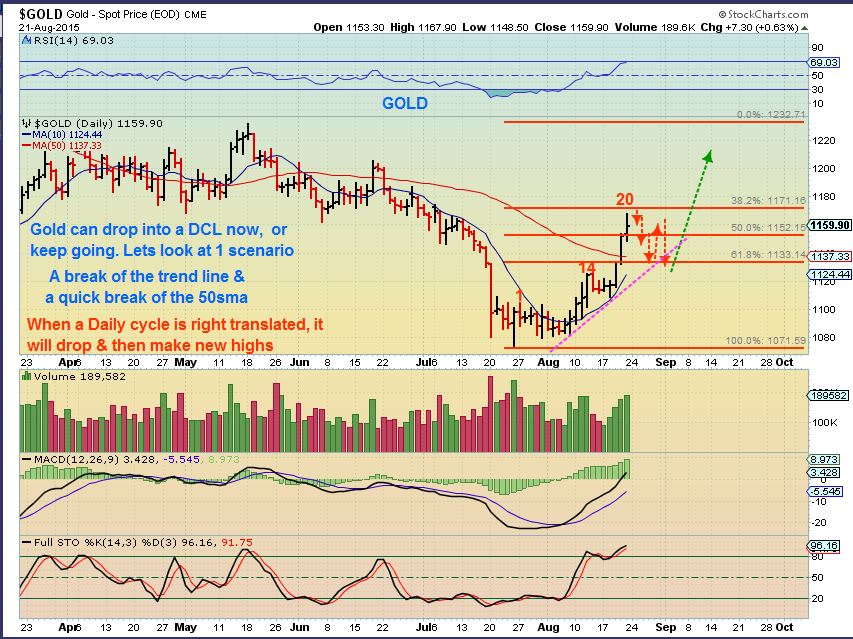
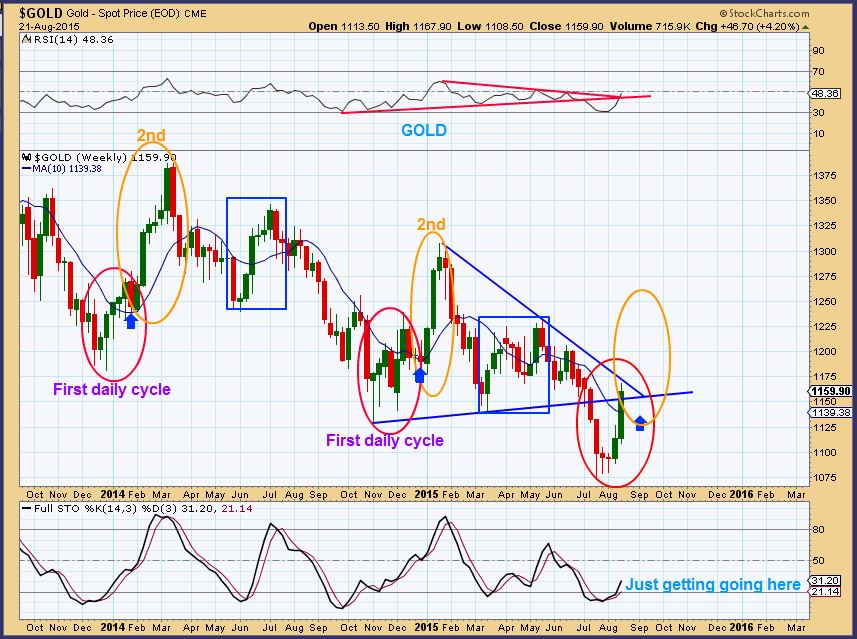
GOLD – Using cycles, we are forming a Right Translated Daily Cycle on day 20. This means that when we dip down into a DCL, we can expect to make new highs. I look for a 10sma break for a dcl. We also could pause and move higher and drop into a dcl later. A break of the 10sma is a solid clue for me.
GOLD – Another view. We are at resistance. Pullback? A flag between $1150 & $1170?
GOLD – I just wanted to note the higher run up, then shorter, then higher, then shorter ( Next higher?).
SILVER – Many worry about SILVER. All they remember is that SILVER is explosive, so why is it lagging now? Some will start to tell “Manipulation” stories of how they are holding down silver and will attack Gold now. Silver explodes in the 2nd daily cycle often. It bases a lot longer than people think is healthy. The entire first daily cycle can be a base.
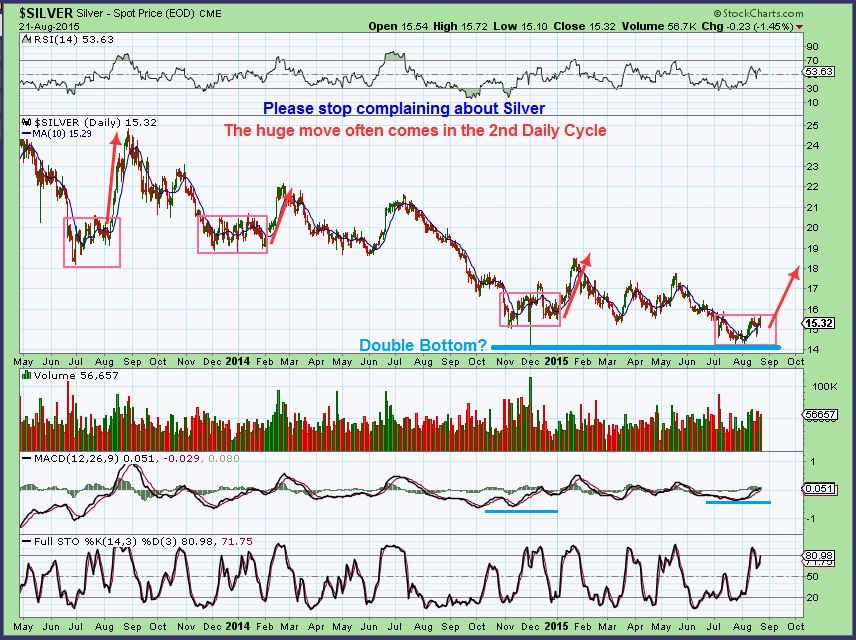
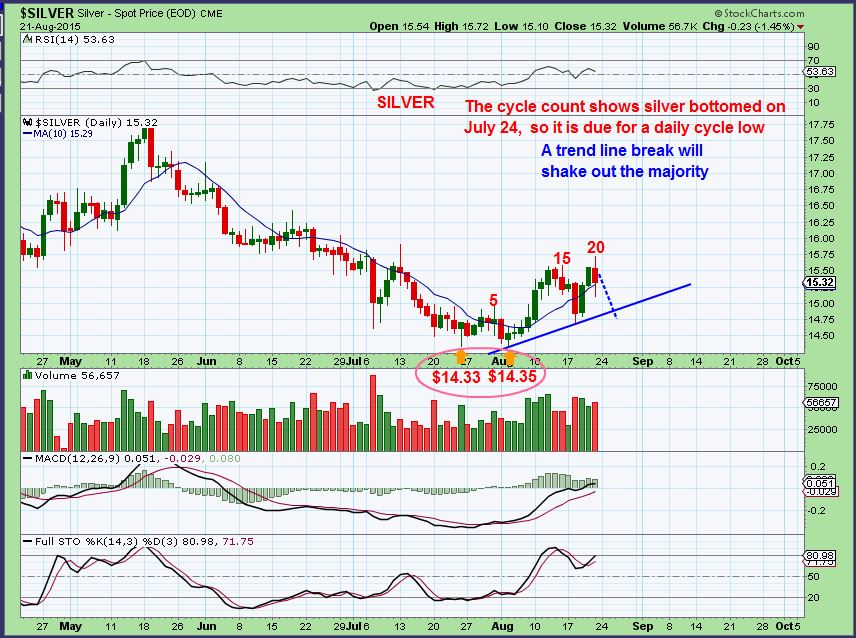
My count for silver shows that it is due to pullback. That ought to get the “Bears” excited , or the emotional ‘Manipulation ‘ stories. Just use stops and keep an unemotional view.
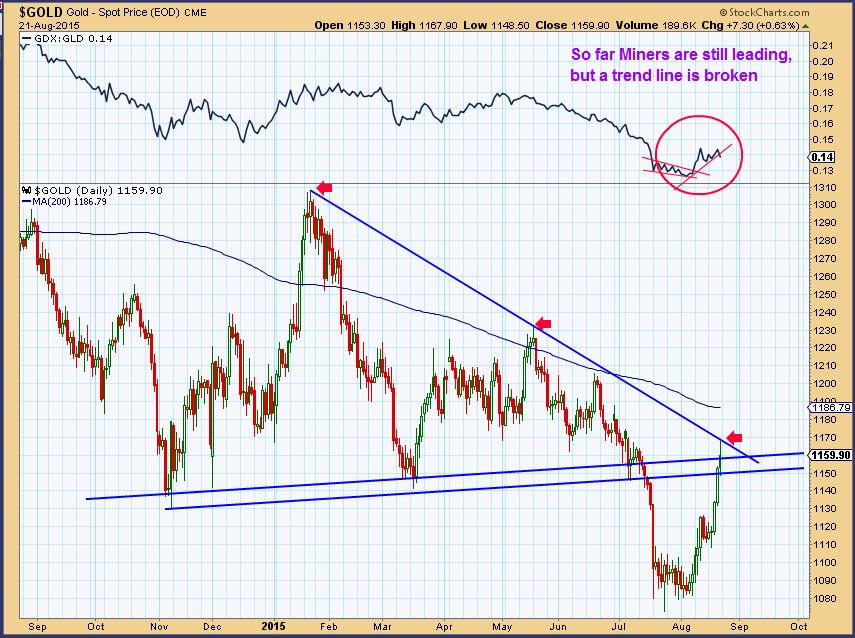
GDX – I posted this chart on Aug 13 as a guide, so that minor pullbacks along the way would be seen as acceptable
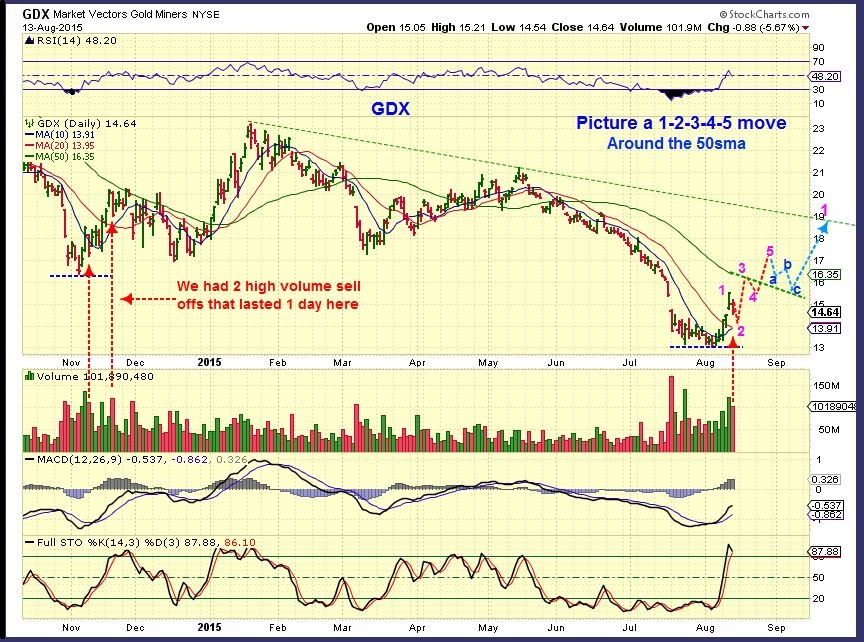
GDX – So far it has been much like the above chart.
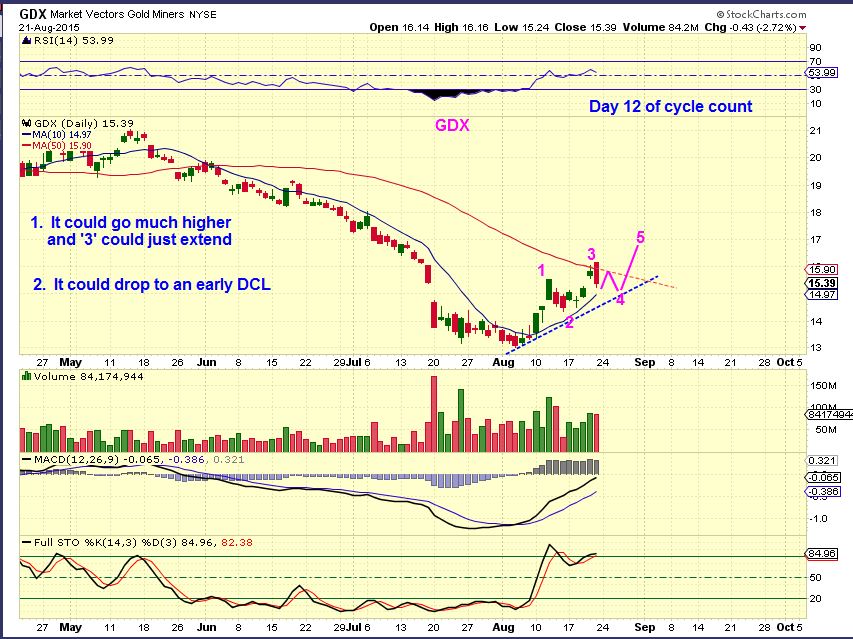
Cycle wise GDX is only on day 12, while Gold is on Day 20. Both can continue higher (GDX could extend the 2-3 move of its 1-2-3-4-5) , or both could drop to a DCL. There is no sense guessing. At this point I feel that every dip is a buying opportunity and I expect higher prices from here.
A dip below the 10sma is likely a cycle dropping into its Daily Cycle Low, and a reversal would be a good entry. I will cover some Miners this week if we continue a pullback, because many good set ups will likely present themselves.
So it was a CRAZY week in the markets and as I write the futures are down HUGE.
The markets are selling off and a snap back rally could follow. Will the Fed do some sort of QE4? Its hard to tell, but these markets are failing and point to a deeper sell off longer term in my opinion. I know that some may want to trade a reversal higher, looking for a possible tag of the 200sma or break down area, but I am going to focus on the Metals and Miners for now. Oil is tricky , but I still expect it to be bottoming soon too. The rally out of those lows , especially in some of the energy stocks could be nice. The XLE rolled over and died, but there may be some signs of capitulation there. So there is a lot to watch this week, and I will try my best to focus on important areas as things unfold.
~ALEX
Futures are down in a big way this morning. We could finish the melt down this week and even put in a reversal candle somewhere. A possible outcome this week would be a relief bounce, but the bigger picture may be that there will still be time to short the markets later.


Morning Alex et al,
Thanks for the review! Quick question with Gold very volatile this morning, possibly we will see GDX below its 10 sma which is 14.97 ish.. How much lower than this you see is a good entry point ? Difficult to be specific I know but your opinion? Mnay thanks. I have no position at present waiting to re-enter into the Miners.
Hi Sandy,Look back at the last 4 ICL’s. (See attached chart )
Dec 2013 & May 2014 they never dipped below the 20sma , barely tagged the 10 sma. (Strong)
last March ICL and NOVEMBERS ICL. The first daily cycle ran up and then dipped below the 10 & 20sma.
What will this do? I have no way of knowing. It feels strong, but anything can happen.
If I had NO POSITION, I would at least start one anywhere below the 10sma, because we’d likely be dipping into the daily cycle low. It may or may not be time for that yet. We could run higher and then dip down. Sorry that I really couldn’t help, but it is a buy the dips scenario, and prices should be higher in the next few weeks.
Thanks Alex.
If the FED raises rates what will that do to GOLD? I’ve heard both up and down.
Probably the opposite of what the majority think
What do you think?
I think the markets are moving down into the 7 YCL. I’m with you on a test of the 2000 & 2007 top around 1550. This should cause the Fed to panic and start QE4. That will set up a huge buying opporunity in the stock market for the bubble phase to begin. This should also be a 3 year cycle low in commodities and the start of the next secular bull market. Gold should lead this bull (it appears to have bottomed a bit ahead of the CRB) as the major driving force will be currency devaluations rather than demand for energy and base metals like the bull from 2002 to 2007.
Wow, breadth opens up at 50-1 down, with volume 180-1 down. Slaughter
And yet the TICK only -450; strange divergence there.
And the dollar just broke the May low. Very interesting.
I knew that dollar had internal weakness, but WOW! Below the May lows is a failure all of its own. his could eventually unfold as very Bullish for Gold
Massive spikes in both the Euro and the Yen but now reversing.
Thanks for another great report, Alex! Do you think silver may have broken below it’s trendline and that it may be signaling the start of the next daily cycle up? Or is this too soon?
The silver Miners just went green, that could be a clue, but I cant know for sure. Its not too early in my opinion, but is it a low , or sideways from here? Cant tell.
GDP up 27%?
Anyone see the VIX? : )
Thats a bit overdone. Along with the $CPCE – We should get a bounce
Agree!
Harvested VIX profits.
UVXY would have been a great 5 day trade. WOW
Yea agree.
My VIX Calls +80% sorry but that is just ridiculous ! Not complaining but…….
gulp….someday when i grow up… immma b just like u ken…
amazing… nice job.
Thanks Maria. I use those VIX Calls as a hedge. Very low risk around 12.00 VIX. I have been trading that for a few months now.
To be honest I was concerned the “market makers” wouldn’t write and that would leave me being forced to hold. Took awhile to get filled. Yikes Matie!
JNUG….THAT WAS SWEET
Sold my last short on SPX at the open – but I’m not brave enough to go long! Waiting until the end of the day to see how things look might work well for someone who is
Sounds like a great trade Cal. I suspect it could get VERY volatile now with some viscious whipsaws as it tries to find a more stable foooting. As you say, probably very wise to wait and see how the dust settles. But well done on holding your short. Did much better than me who bottled it far too early.
Thanks, Chris. One cycle guy I follow thinks we’ll have a more meaningful low in mid-September and I was going to hold this one until then, but I saw the highly emotional selling this a.m. and decided to bail now. I would like to reload to the short side at some point to prepare for that. Another cycle guy is looking for a big low in October. And of course, our Master Chart Freak has been pointing out the potential for this change in character that we’re seeing. Now the hard part will be looking for that point to reload – I hope Alex gets the test of 200dayMA that he pointed out!
I’m totally with you Cal on mid/late Sep before this rout in markets is finally over. But highly unlikely we will go there in a straight line and at this rate!! Ultimately I see the Dow around 14,500 by then but the speed of these drops make it very dangerous right now I suspect to keep holding shorts. There will be some kind of bounce I’m sure before another downleg but in the very short term I suspect the whispaws could get truly viscious. Get caught in one of those and it will hurt!! Sometimes sitting on your hands and watching can be a very good decision. I would enjoy your recent success, take a breath and wait for the next decent looking set-up. Looking for a short this oversold makes little sense to me but equally trying to play a possible bounce against the larger trend is also fraught with danger right now. But hey, maybe I’m just a coward. I did take my profits way, way too early!!
The hard part about the tag of the 200sma that I pointed out on the chart in the report , is that it wasnt a direct run up to the 200 and then a drop. It took weeks to get back up there and it started to look like a recovery, so it cause one to think that maybe we are going higher. At one point it went above the 200sma .
Tricky, but we should see a drop sooner than later this time. This move accelerated fast.
Hi Alex and Cal. Over recent years I’ve taken a very close look at the start of bear markets and how they develop technically. Speaking for the ones in particular since 2000 one thing I have noted and very similar to your point about the 200 sma Alex is a 60 week ema (or 300 day ema). What I have seen is that we tend to get a gut wrenching opening shot across the bows. This could be the moves down into Sep/Oct which many people I know are expecting and we have arguably started! This creates the time and the drops required to start making the longer term averages turn over and start falling. Markets then start to recover after perhaps 20%+ drops and the ‘talking heads’ start encouraging everyone to buy again and how you will never see such an opportunity again etc. However, if a bear is truly developing we have just suffered a wave 1 down and the next rally (maybe a year end rally this year!) is only a wave 2 and normally stops at or very close to the the now falling 60 week ema ( or 200sma as Alex rightly points out). Once markets turn down again from here this would normally be real confirmation a bear is underway and we are then in the wave 3 and really viscious part of the bear phase. This is the time to short the pants off the indices and a solid stop loss can be placed just above the recent high which should also be at or very close to either the 200 sma and 60 week ema. The gains in a x2 leveraged ‘short’ ETF can be truly breathtaking in a very short period of time in that section of a bear. I have all the detailed analysis here to prove it. So I’m consoling myself with my recent misses that if a real bear is starting the real fun has yet to begin!!
wow……………..
TD Ameritrade servers are down. If I were trying to do something this morning I would be totally pissed.
Bless his heart, EW guy Robert Prechter does get some really bold calls right. The TD Ameritrade / ThinkOrSwim servers being overloaded may be a preview of one of them: servers going down and people not being able to sell when they need to. He also pointed out that stop losses will give people false security during a time when the markets have huge gaps down & kick people out at prices much lower than they’d entered.
I think so. Perfect example this morning. They are back up now. Everything is online trading these days and with xtreme volume it does definitely pose a risk. Best to be on the right side of the market!
Scottrade was bogged down too. Trades werent going through for quite a bit .
ABC correction in GDXJ?…. maybe
What wave SOG?
I’ve got it as a main 2 (of 12345) or main B wave (of ABC).
so your wave 1 or a was on Aug. 21?
I have wave 1 or A, ended on Aug 21.. so now we are correcting the past months rally
Gotcha……thanks.
You have us in a wave 2 correction where I have us in a wave 4 correction. Very plausible.
Something along these lines Ken
(my targets are arbitrary)
Yep I see it…….very plausible.
You could well be correct on the wave 4 scenario.
$GOLD seems much clearer
in an expanding flat at moment
Horribly accurate, but can we correct 2 weeks of gains in a day and a half.? Could we retrace 100% like last Nov? 🙁
If its wave 2.. it could certainly be super deepy
SOG what time frame? Hourly
15 mins period
hello to all, my first post. CRK is holding pretty well among broad market & energy sector sell off. it could be one of the stocks that would run the most after OIL bounces.
Hello Bostjan, Thx for posting.
I was looking at some Energy stocks and CRK was one of them. It tripled on the way up and now has a nice reversal.
CIE & GEVO have very nice reversals too
SFY, WG, EROC, QTWW, DOM = look interesting too, but I’m going to wait a bit
good to be here, very nice analysis. I enjoy reading them very much. I was comparing CRK to other energy stocks you mentioned an this one holds up against sell offs. thanks for the tip on others, will check them up.
before enetring need to wait for oil bounce first though. this is what I have for oil (see chart). trgt 36 area, several technical support areas. I think it will bounce together with market.
Yes, I agree. It could break the support like it did in 2009 ( the tails that extend below) but a reversal in that area would be likely, especially with that divergence.
Hi Bostjan. Nice post. As Alex pointed out today and as you are showing here some very nice bullish divergence on both weekly MACD and RSI. So potentially getting close to some kind of low. If you wanted to be a real optimist the whole pattern from 2009 to now could potentially be some kind of major corrective Elliott wave with the move down from the 110 peak clearly showing five waves. To be really bullish this would have to be some form of ending C wave I believe. Others here will know far better than me. But if that was correct and 2009 to now was a major corrective wave then the low we are looking for would be a MAJOR low and would point to much, much higher levels to come longer term.
Hi Chris, thanks. I do not know anything about EW :). I saw you guys discuss about it but did not have time to study it. Could you post a chart showing what you meant?
I’ll try. Will try and post shortly
I hope this will work OK Bostjan and I only know some of the basics of EW so this is a very basic interpretation and probably not correct. But from 2001 to 2008 looks like a major impulse wave which would move in 5 subwaves. This normally points to the direction of the even larger trend. Once 5 waves are complete then a correction follows but to my knowledge there are something like 13 different correction patterns so mine is probably far too simplistic. But the most basic correction is know as an ABC. A is often an impulse wave which 2008/09 looks like then B is often more overlapping which 2009/13 is and then you would need an impulsive 5 wave move to form C which it looks like the move from the high at 110 in 2013 does as things look right now. Also you will often see bullish divergence between the 3rd wave low and the 5th wave lower low,which you do here. So if my very basic interpretation was correct (but don’t bet on it!!) the move from the peak in 2008 to now is a huge corrective wave that may be close to ending and would suggest a new bullish 5 wave impulse wave to follow to new highs in the long term!! To be honest that looks highly unlikely in the current environment but maybe could be possible long term if we went into some kind of new inflationary or even hyper-inflationary environment. Those who believe in the demise of ‘fiat’ currencies might believe that scenario, which would likely take years to unfold if correct. But in the much shorter term a very interesting possible set-up to watch for what could be at least some kind of meaningful low if nothing else. Hope that might make some sense and as I say there are some really good EW people on this site who will have far better opinions than me.
Thanks for posting this, I will study it tomorrow. It is bed time for me now 🙂
thats a pretty darn nice chart chris.. ;o)
Thanks Maria but very amatuerish based on my limited knowledge of EW. Even if remotely correct that major B wave is clearly a complex one, maybe something like a triple zig zag or one of the other 13 or so correction paterns!! However, if there is any credence to my above counts at all I see two major possibilities. Under the most bearish scenario my C wave is incorrect and in fact it’s the first major impulse wave of a larger downtrend. But even in that case we look like we could be closing in on the end of a major 5 wave move. If that proves to be the case then we would be due a significant bear rally next which would classically target the area of the prior wave 4 high and a price target around the mid 60’s. Rather a nice % move and that would be the bearish scenario! However, if my suppostion is correct and it is some kind of ending C wave to a major multi-year correction then a major new 5 wave impulse wave would be due to the upside over the coming years and theoretically to all time new highs!! But either way and as Alex keeps mentioning we should keep watching for evidence of a low anytime soon and then we can climb on board and just enjoy whatever ride the market gives us. 🙂
Thanks for explanation Chris, it is a bit more clear now on what you meant. Will have to study EW more though…
My pleasure Bostjan but as I say i’m certainly no expert. I looked into it quite a long time ago but found it so complicated and so many different interprtations of the same patterns by so apparent ‘experts’ that I eventually gave up on it and now just concentrate on simpler things like moving averages, support/resistance and MACD and RSI. At the end of the day though it’s finding something that works for you personally and if you do stick with it. Sometimes, simple is best!!
agree, I also like it simple.
I could well be wrong but on a day that EUR and JPY gained sharply against the USD, the CAD continues to weaken. There seems to be a reasonable correlation between gold strength and CAD strength, so the current weakness looks to be a short term head wind at least. Maybe lends credence to the idea of more correction/consolidation to come in gold and silver short term?
Is it ok to take a small starter position in Oil yet -Just in case it bounces a bit from here? Alex.
Hi Ash
I cannot say 100% , because it is not a ‘safe’ entry. A small starter position is ok if you can take some heat or stop yourself out if Oil does decede to go to $33 ( 2009 lows).
Personally, I think that It looks close because DWTI looks like a topping candle and UWTI looks like an exhaustion , but right now the trend is down until that changes and it starts with a move above the 10sma in my book
I have almost done that 2 or 3 times now, thank goodness I didn’t. If markets sell off again after kissing the 200 day, will that drag oil with it? They have had some corrrelation.
Did I miss the exit bell? What just happened?
If you mean Miners? Or markets in general?
Gold is reversing off of the highs, but Miners are giving it back for sure. ( Anyone in leverage or options is feeling the heat today). Gold would be ready to fall into a DCL ( It looks like a bearish engulfing top on GLD) . Miners and Silver are overdoing it , since they started the drop.
I hate to think that this is going to act like NOV ICL, where Miners gave it all back before the strong run up in Dec to Feb
I can take that, I can’t take a drop to 1000 in GOLD
But Gold looks fine unless Miners are leading the way down. Refresh for a chart of Gold at the top of this comments section
and miners typically lead the way.
I stated above in more detail, but how much of that was exacerbated by EXTREME market conditions and what was the ‘real’ move during a normal day if that makes sense
Against my better judgement I started buying mining stocks 2 weeks ago (I think it’s a sickness)…….got stopped out today for a small loss……Alex, you were supposed to hit me over the head when I started thinking about buying miners again
I’m right with you, I didn’t expect this severe of a drop. Fib right at 61.8% on JDXJ
I forgot who asked for that slap.
62% Fib Retrace on GDX.
Yes, but are you brave enough to buy with all this blood out there?
I picked up more today.
GOLD ready to head into a DCL, see CF comment to me below. Could be more dangerous.
Yep
Carl, Ken you guys looking short term, or do you believe this is a dip on the ICL rollercoaster?
Bill,
I am playing for the Second Daily Cycle Top.
Ken, Based on the EW patterns above, aren’t you buying a little early?
For me, I am building a position in case I am early……that just me Bill.
But I do want skin in this game for sure.
I shopped too, for some GDXJ down below $20.
Dunno if catching that dagger.. may hold all the way to & back thru the reversal, rather than set a stop to dump me out in the wrong place
Hard to know, isn’t it? Am I protecting myself or selling at he lows?
hoping GDXJ won’t drop beyond lower trendline.. but a possible stop-run?!
Same with me. I think the PM’s sold off today (and maybe will tomorrow morning) as a result of the broad market decline, margin calls, loss of liquidity, etc.). But I also think fundamentally things have changed. Regardless of short term market volatility I think things have changed. The general market has shot its load and the dollar as well. There won’t be many places to park money and the PM’s will be one of the few sectors that will do well. And it should be explosive when it takes off. It’s a small sector. The GM should rebound soon and stabilize everything before a more significant downtrend. At that point I think the PM’s will really take off. Lots of value there particularly when gold/silver start moving in the right direction steadily.
No
BTW the drop in Nov/Dec was 78.6%
Gold on a hrly chart looks fine. It looks like it did a stop run, but it is due for a DCL. Miners are acting a little overly sell offish
Right now when I look back on the chart, today “Feels” like Nov 28 when the Nov ICL was in and GDX & GDXJ dipped below the 20sma sharply.
That was followed by a bounce and then some up & down sideways downward slope. The second daily cycle saved the day.
Alex,
could the GM drag down the pm into a late ICL in September, like this is a 4th DC and now we get the final washout together with the GM?
Gold is not acting like a 4th daily cycle. It is a confirmed ICL , and is actually holding up well.
The Miners had a scary sell down , but so far it looks a little like MARCH selling down near 61.8% area, only in March it took a few days, we just did it in 2.
I’m not sure what to make of the speed of the selling, but so far Gold is acting correctly.
The overwhelmingly negative breadth in the broad market has to be weighing on the miners today. When breadth is 25-1 down (and worse) everything’s being sold.
And we know that miners can often do just this kind of thing, as you’ve pointed out. Good to get a bit of fear back in too; shaking many out to chase later.
Troy just made the same point I was going to. I mean gold started nicely and ended down, USD down, TLT ended down (though fractionally), silver, oil and copper got rampaged, dont need to mention Dow amd Naz, that was inhumane.
So, I decided not to add to miners at 10 day as planned. I figured S&P down 70 points just wasn’t the right time for that!
So, only question, gold still looks ok. How much do we ‘discount’ the crapfest is GDXand friends today b/c of that? Will they participate in the glorious bullish bounce when that happens (go check out futures right now) or will everyone stomp on miners to buy more APPL NETFLIX and FB?
JDXJ Harmonic Patterns show up a lot. One of them is the Shark. Attached is a common shark pattern that tends to change direction higher at 88.6% or 1.13%. Let hope we don’t have to go that low.
How does GDX look to you know?
HOLY CRAP. Just HOLY CRAP.
holy crap indeed! I am still in shock
Barfola …
I just threw up in my mouth a little bit. No, wait. Some of it got on my shoes.
giggle…. be thankful I didn’t ‘share’ what i was REALLY thinking… you’re eardrums and eyeballz would burn out …. ;o)
No kidding. My language wasn’t so clean earlier in the day. There was nowhere to hide.
Man, I’m glad I dumped NUGT on friday (early) for gains. Wish I had kept my DUST daytrade into Monday. 🙁
Still holding AUY and FSM but niw back to entry point, all gains given back at this point. Did not add GDX Sep calls, waiting for more clarity in general markets. If we have that and still ‘on sale’ will likely buy. Pending CF updates also, of course.
Gold levels at DCL.
I got out of gold at the MACD crossing on the 4hrs chart.
Now I’m looking for the the same signal to get back again.
I have a bad feeling that we are going to test back 1110.
MACD crossing and RSI come out of oversold territory