
Beat The Clock
Today at 2 P.M. Eastern time, we get the release of the Fed Minutes. Today could amount to a lot of “Hurry up and do nothing!” until then. Lets review and see where the markets currently stand.
.
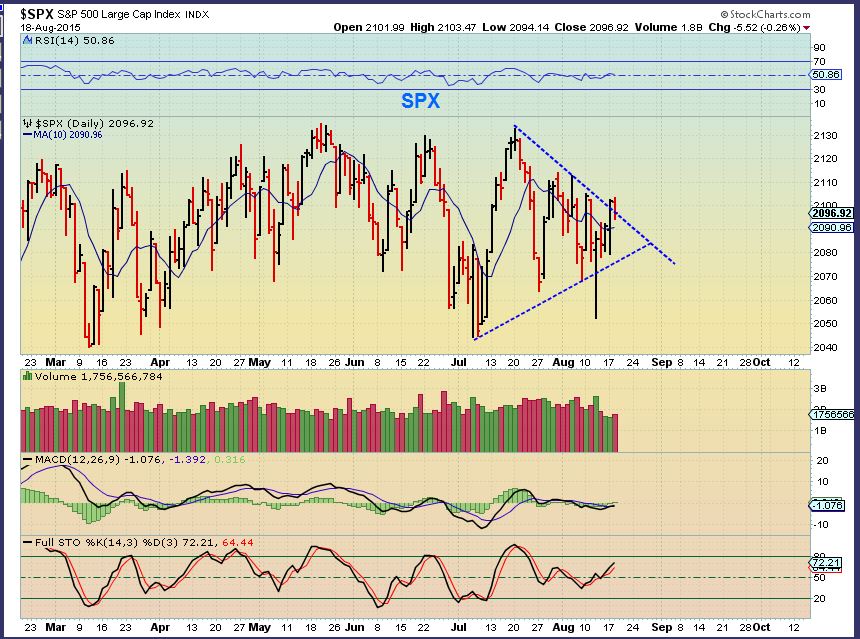
SPX– yesterday I showed this break out, it looked bullish short term, but I noted that it looked weak internally
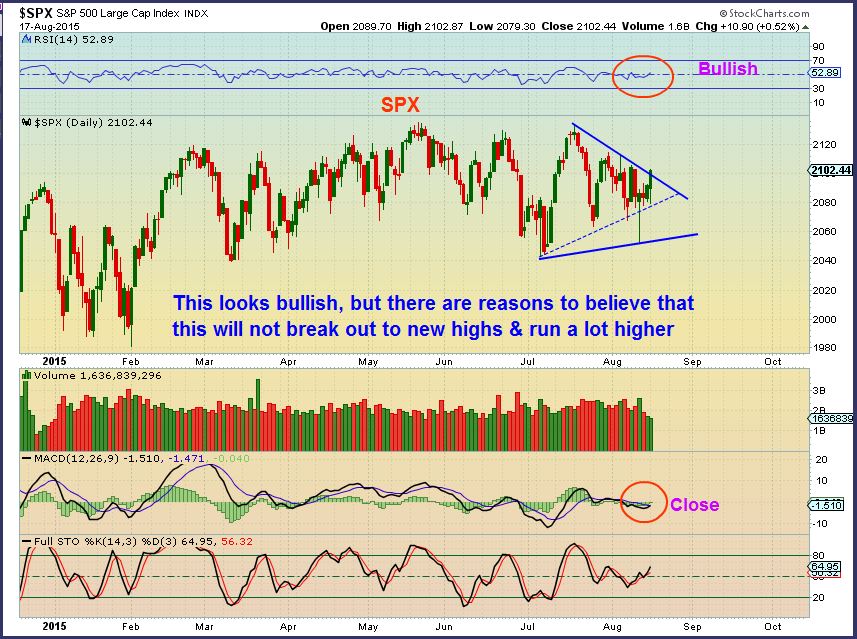
SPX – Price dropped back inside yesterday
How did the other markets fair?
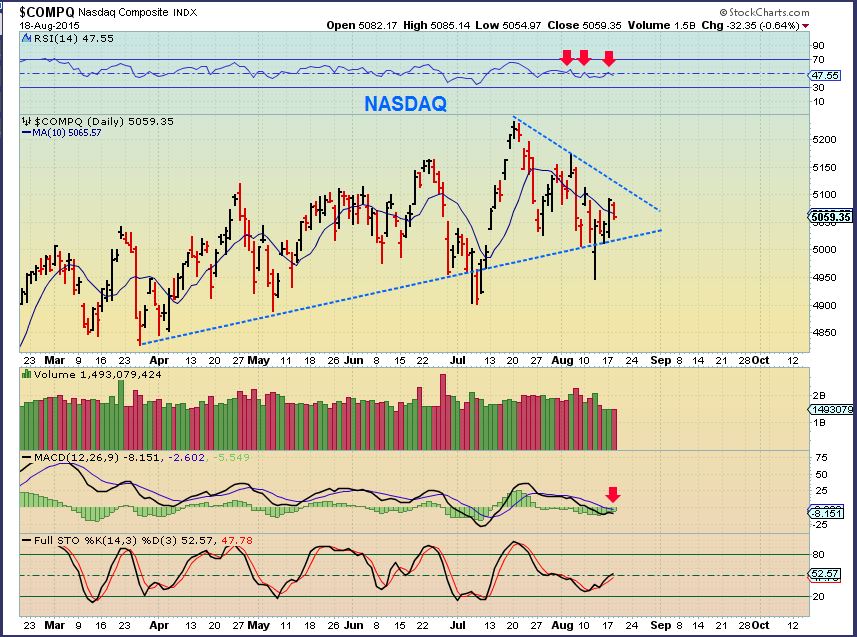
NASDAQ
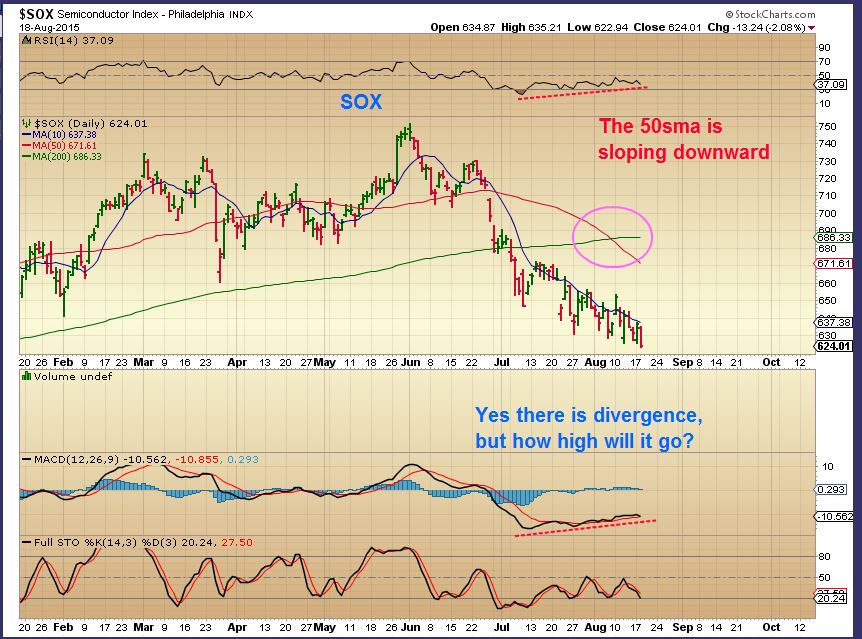
SOX –
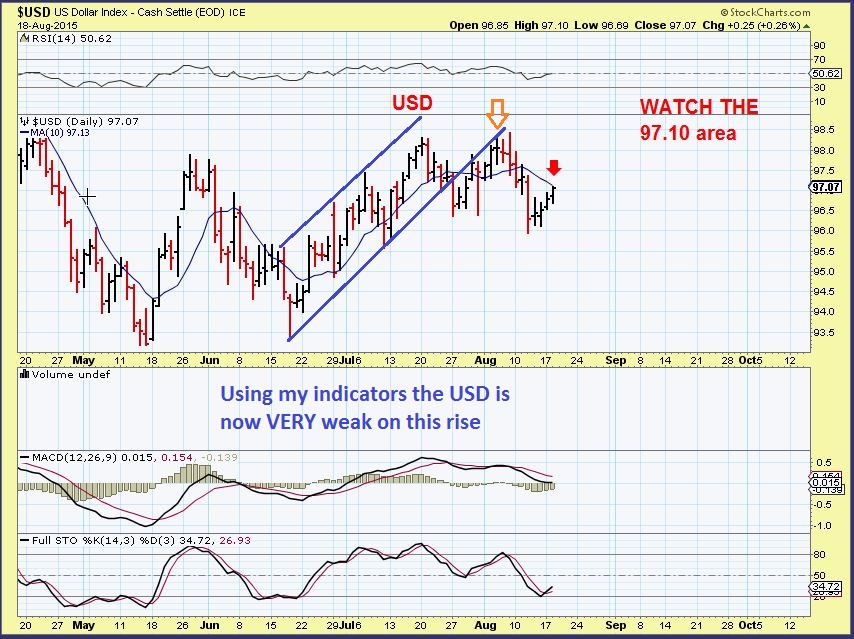
$USD – I have seen weakness internally for weeks now. Can the release of the Fed Minutes boost internals? I doubt it. A drop in the dollar would help Commodities.
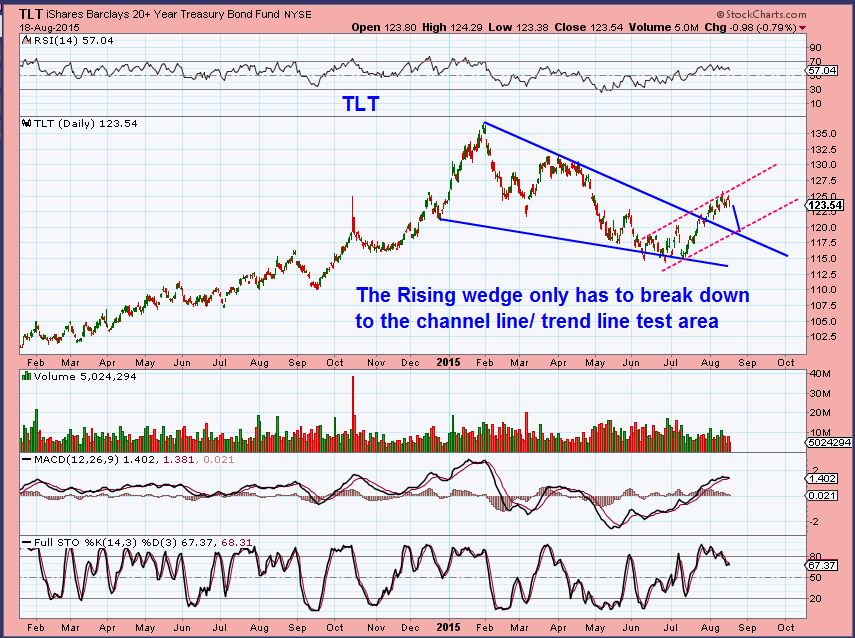
TLT – I know of a couple of Investors / Traders here that trade Bonds. If you invest in the TLT, this is probably not a big deal, I expect at least a small pullback, maybe to $1.20? What if I was just trading it ? Traders may want to sell and buy lower.
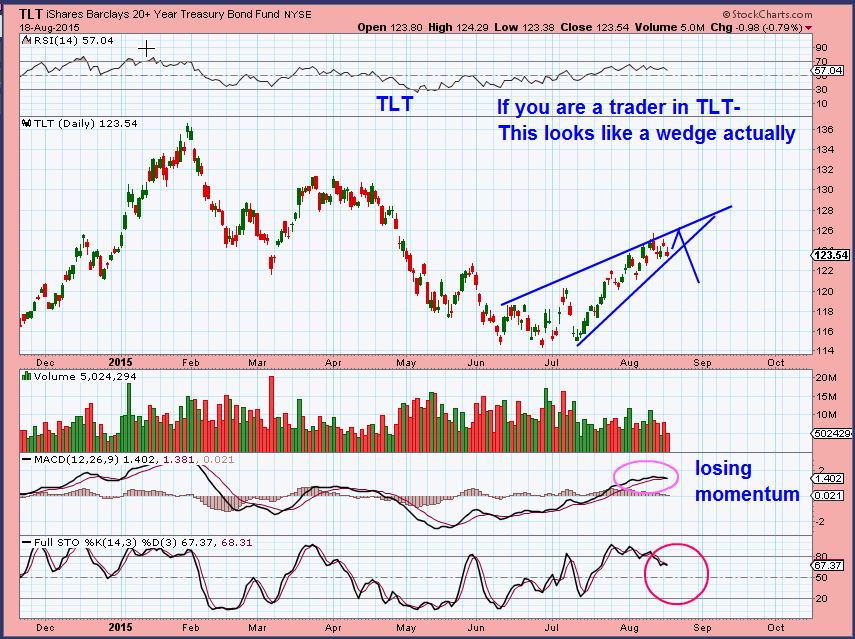
TLT – This shows why Investors may just want to hold. At this point I dont expect a large drop.
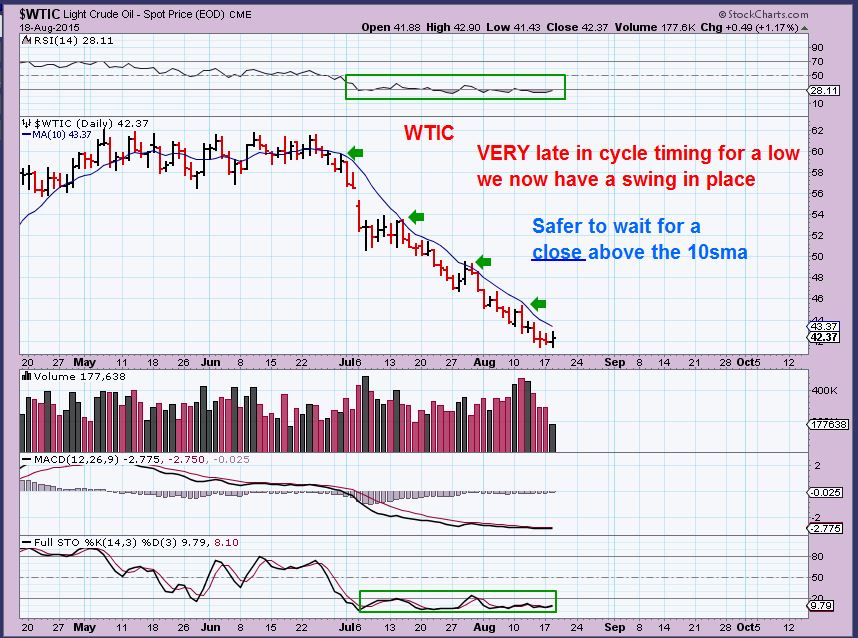
$WTIC – Oil is late in the cycle and has put in a swing. This should be the lows.
XLE – Leading the way. I forgot to finish my sentence on this chart. NOT ALL ENERGY/OIL STOCKS are trading the same.
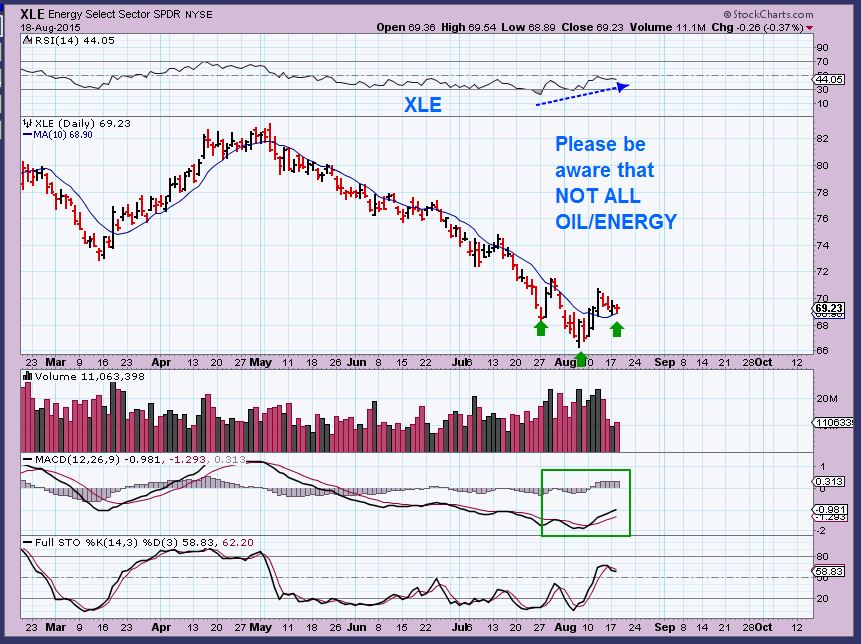
For example, REXX has moved higher and looks great. CRK tripled and looks great. Others are losing steam fast ( LGCY for example).
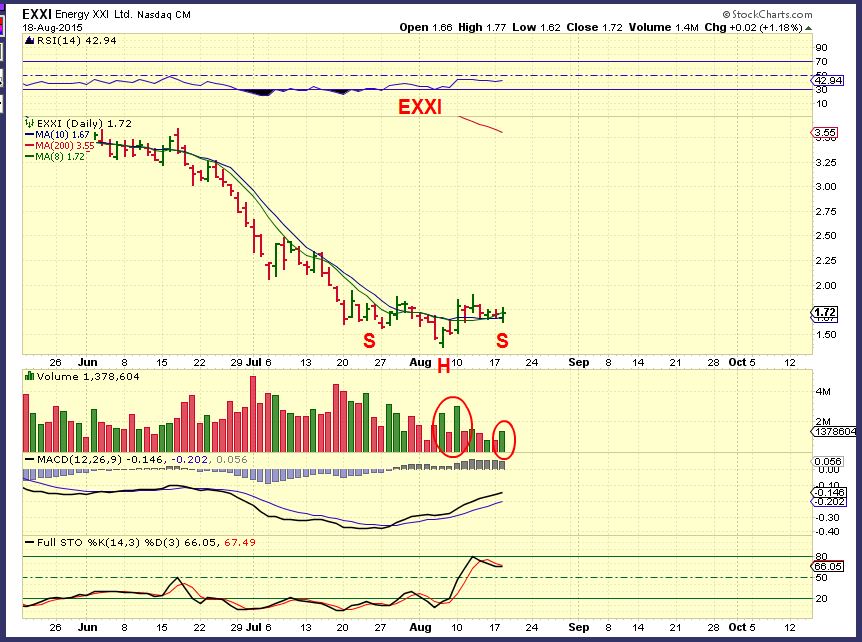
EXXI – I posted this chart and it is now up 2 cents more!! 🙂
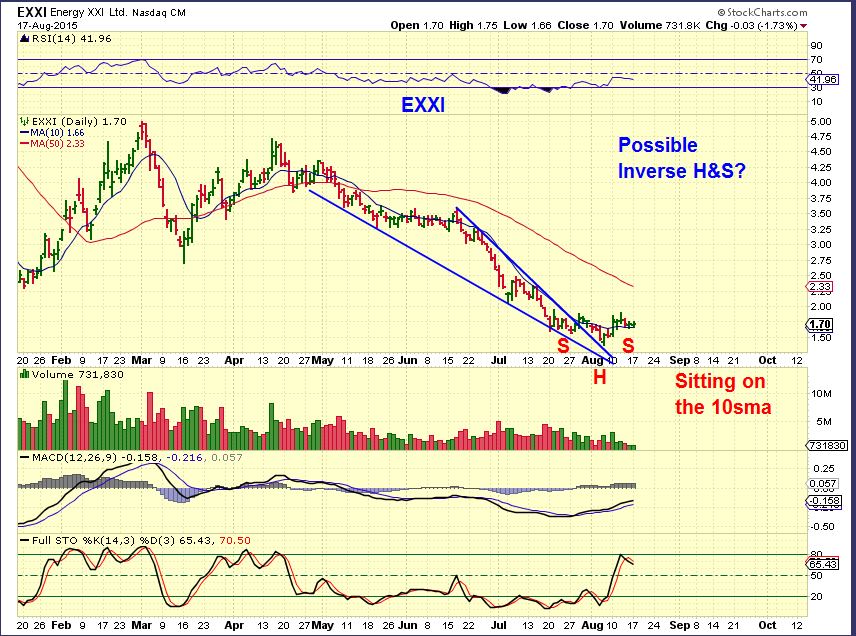
Actually, EXXI sold down to $1.62 and reversed, regaining support with increasing volume. This is a good sign.
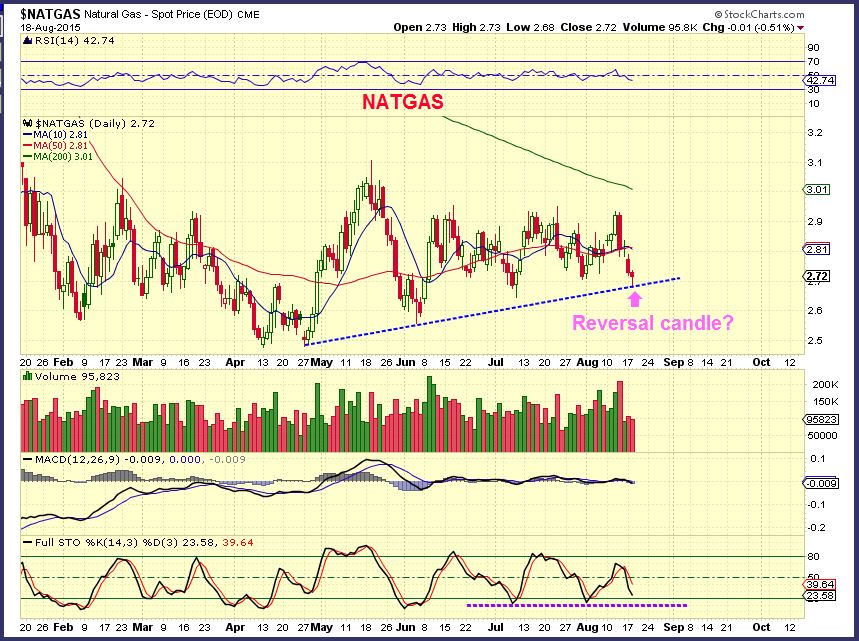
NATGAS –
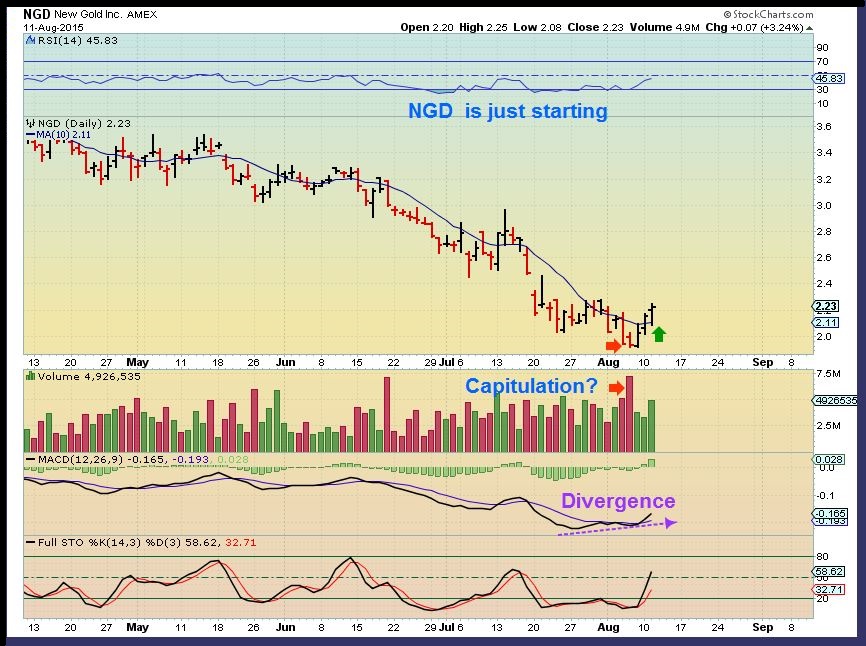
GOLD,SILVER, and MINERS
I had an update last night, not much has changed since then. This is a review and a few additional thoughts.
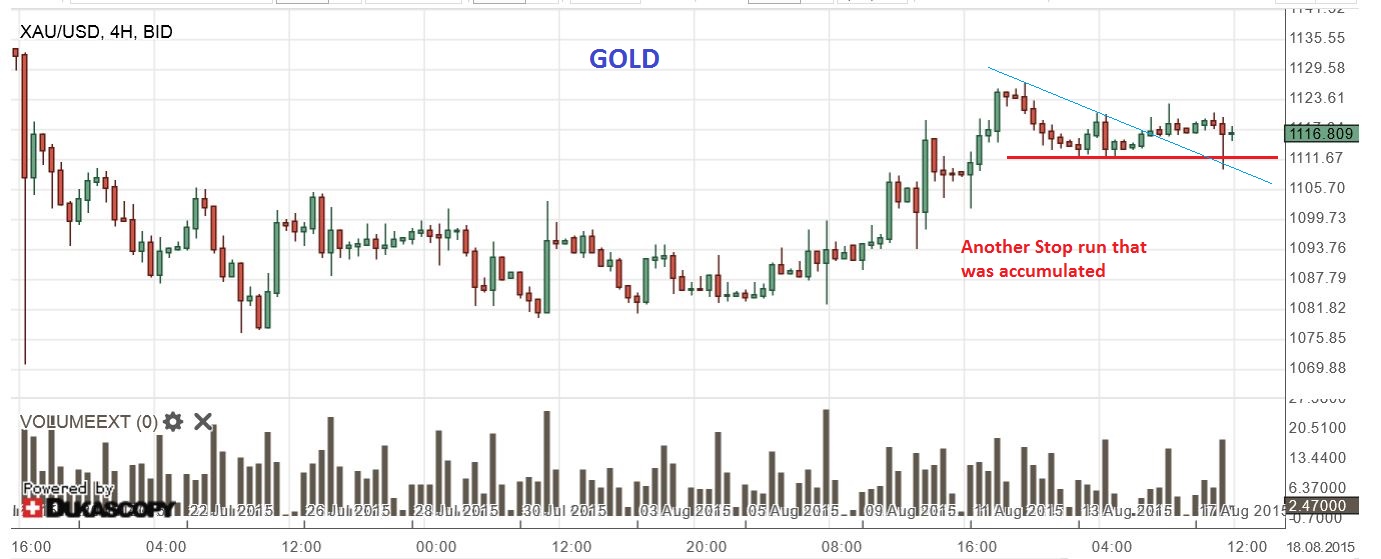
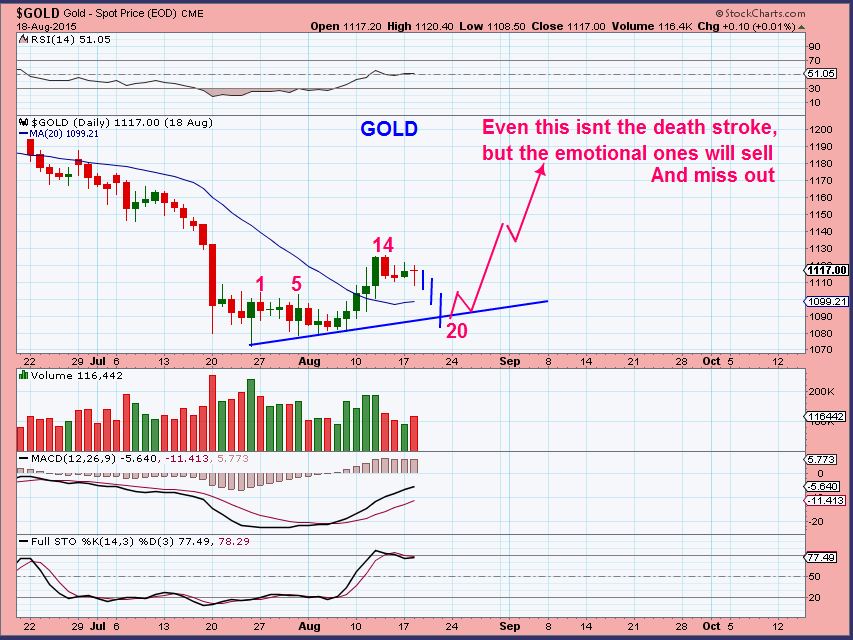
Gold shake out / Stop run yesterday. Shows Bullish action.
Currently as I write Before C.P.I. #’s being released at 8:30 A.M. Today. ( Edit: Gold jumped on the C.P.I. release initially)
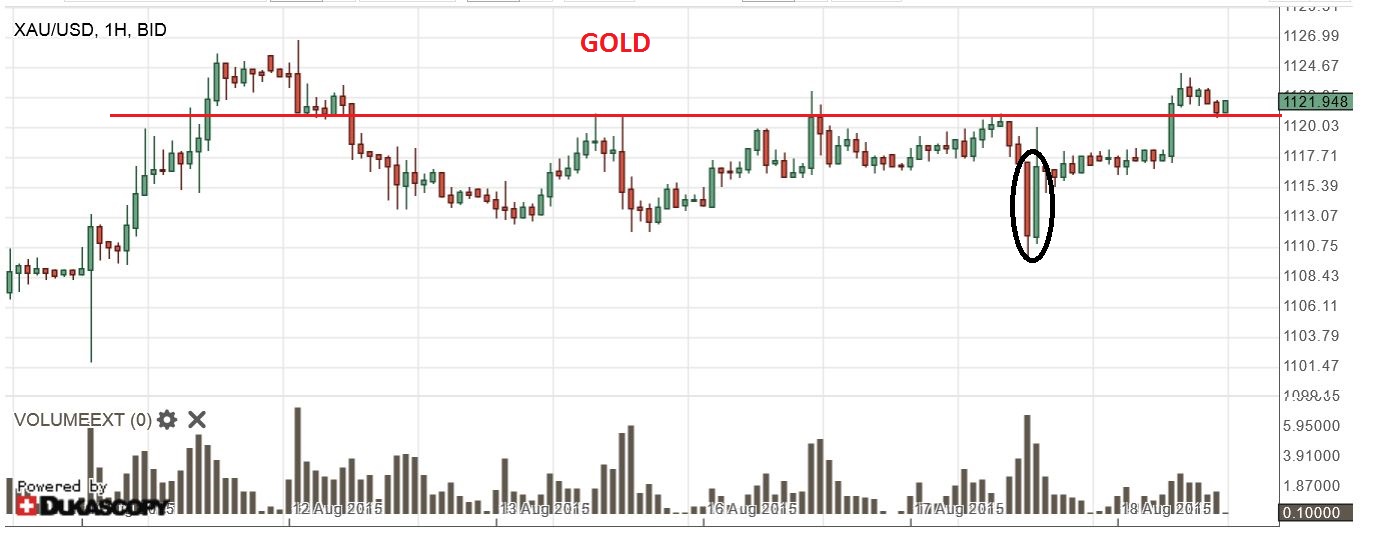
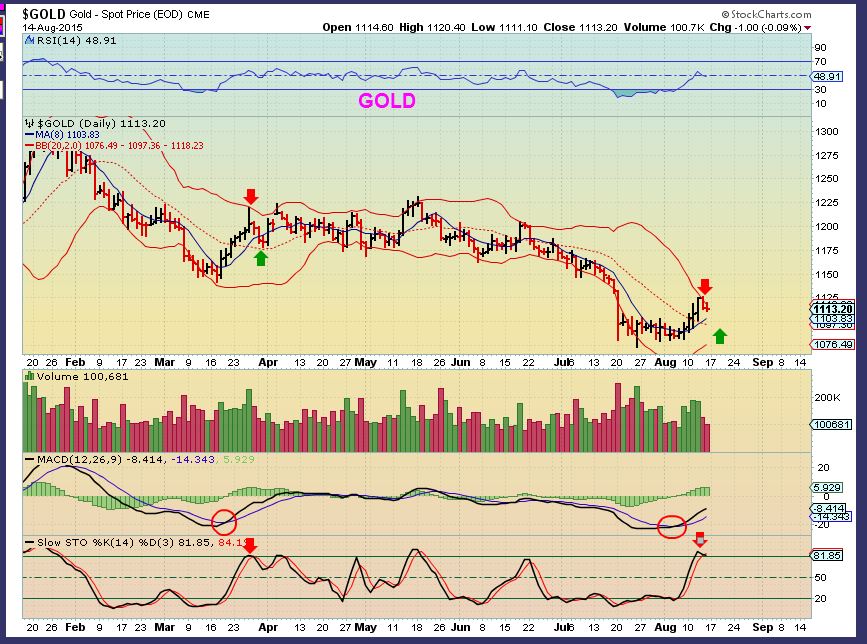
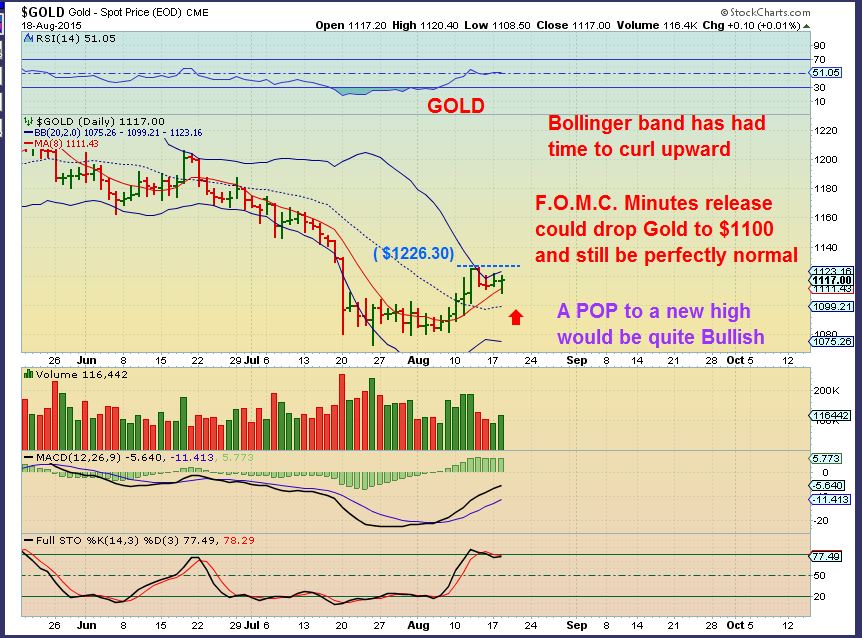
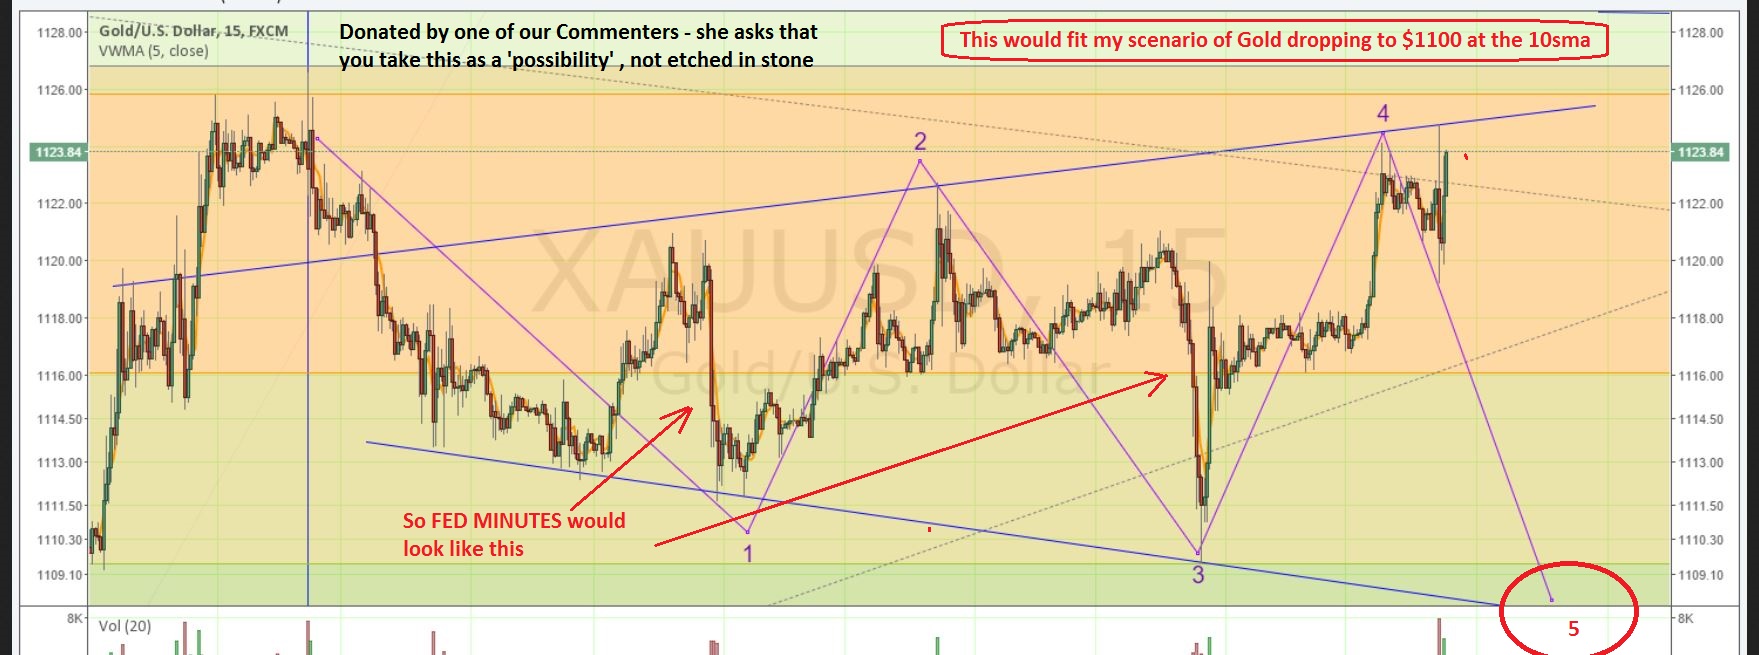
GOLD ON AUG 14 Gold hit $1226- I stated that GOLD could fall to $1100 and be perfectly normal. It has held up nicely. Gold is $1122 as I write. This means that if GOLD drops $22 with the release of the Minutes, IT IS STILL NORMAL. No need to panic. Dont let the emotional reaction of others to price wiggles sway you. We know where the lines are drawn.
SILVER – This chart was posted yesterday. It happened. Notice the high volume drop on July 6. It recovered and may have formed a left shoulder to an inverse H&S.
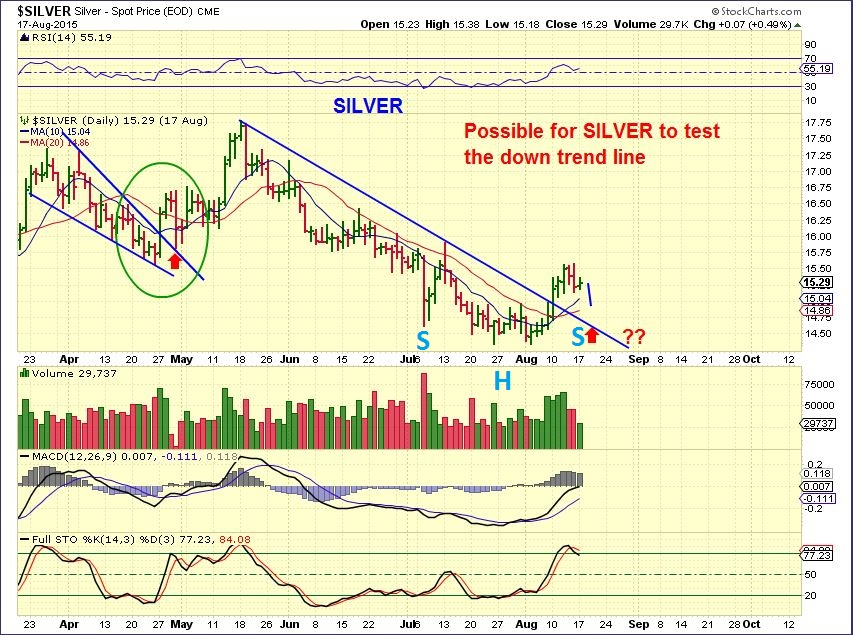
SO , If the Fed Minutes causes any selling – I have pointed out that a good amount of selling in Gold, even down to $1100 is normal ( 20sma). Even $1190 is fine , as shown below. You may stop yourself out & wait for the dust to clear if it makes you more comfortable. Some sell before the Fed Release, and re-eneter later, higher or lower and are happy with that. Even with the scenario below, we would be in a Bullish Right Translated Daily Cycle.
Silvers sell off yesterday….
Some people saw Silver sell off without Gold and act like that has never happened before. Blaming manipulators, they stir peoples emotions, placing doubt in peoples minds as to whether this is ‘normal selling’ or ‘ something much more’? Sadly, this can make people overly nervous and possibly cause one to over react to the Fed Minutes movement of the market this afternoon.
What to do? What to do?
How about do the work 🙂 Instead of just spreading fear & doubt of unnatural manipulation moves, gangsters and banksters, , do the work and look into it more. Research. Offer some rational facts to counter the fear that some are causing. 1. Has Silver ever dropped while Gold didnt in the past? 2. If so, what happened to Gold? That might ease some fears and emotions.
Look closely & Compare the 2 charts below to each other:
1. Chart 1 – Silver drops near lows in Aug 2013. Chart 2 – Gold is well above the lows = Silver dropped more than Gold
2. Silver dropped to new lows in Dec and then in FEB, Back at the lows / Gold is well above the lows in Feb. Silver dropped much more than Gold, right back to the lows.
3. Silver was back at the lows in Jan 2015 , Gold was almost $60 higher than Nov lows
4. Silver dropped yesterday / Gold didn’t, so that means what? Silver has dropped back to lows in the recent past while Gold didn’t. No emotions, no worries, honor your stops in the event of an irrational sell off, or sell now & re-eneter later.
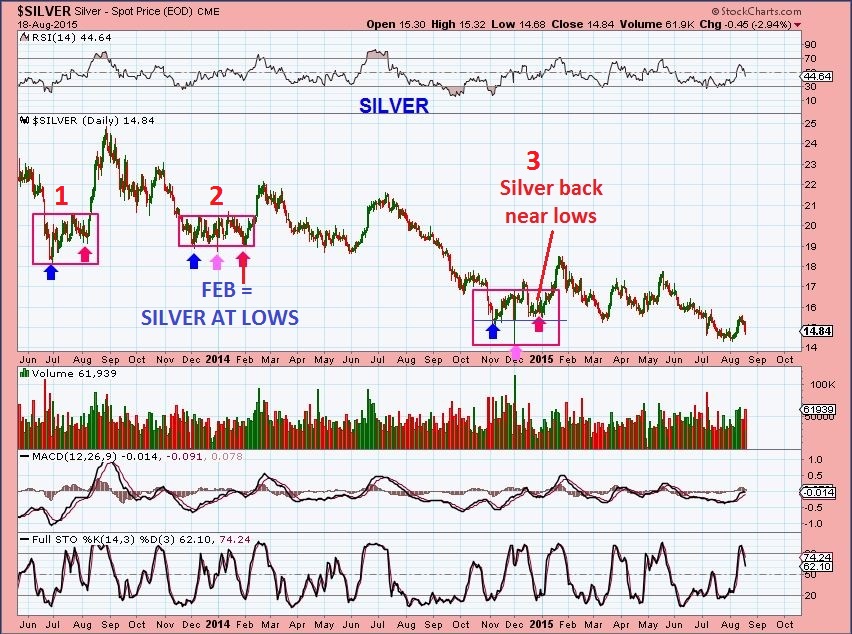
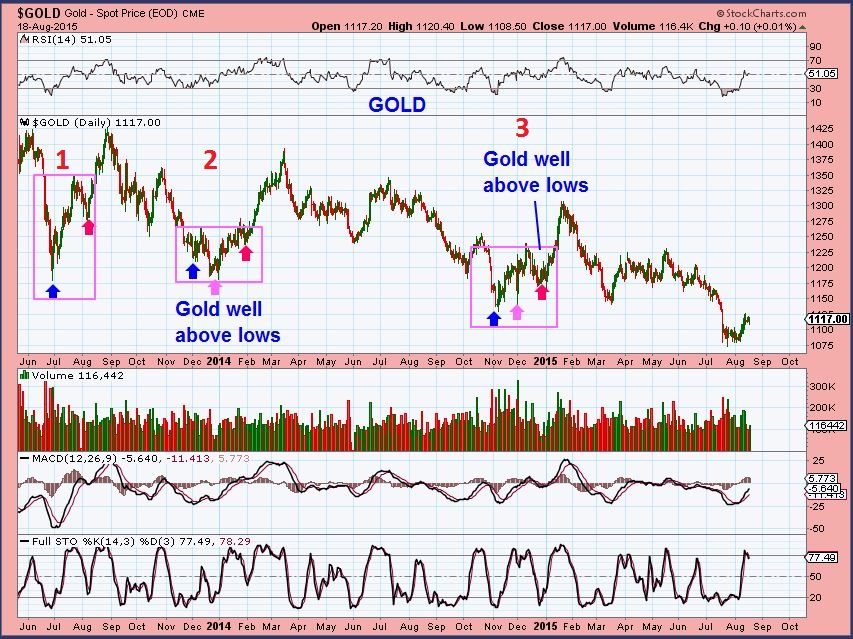
All 3 above examples are recent and show that SILVER dropped further than Gold during Rally phases. Oh, thats comforting. So yesterday may have just been enough to shake out people before the Fed minutes are released.
Many Miners that Popped and ran higher now seem to be low risk buys. You buy them with a stop somewhere below, and your risk reward is in your favor.
GDX yesterdays alert.
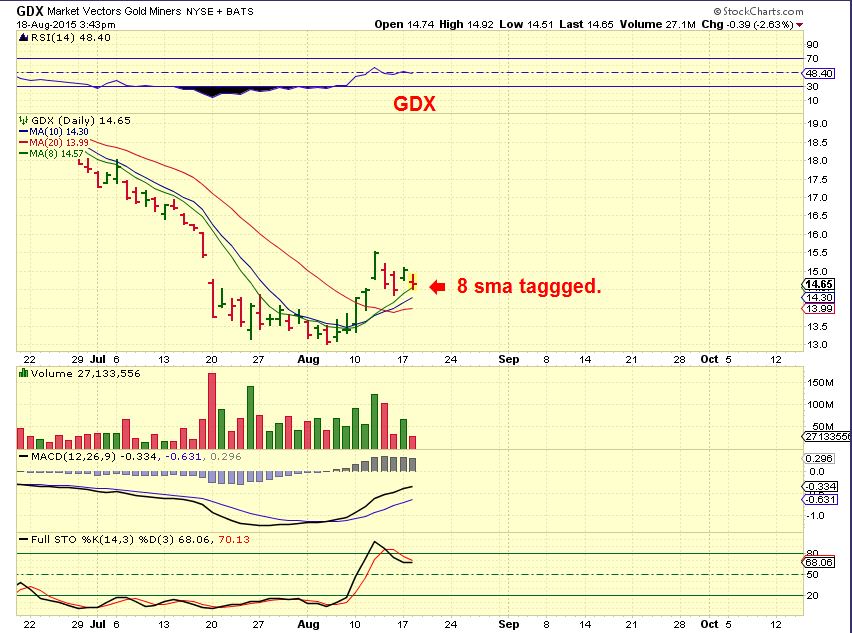
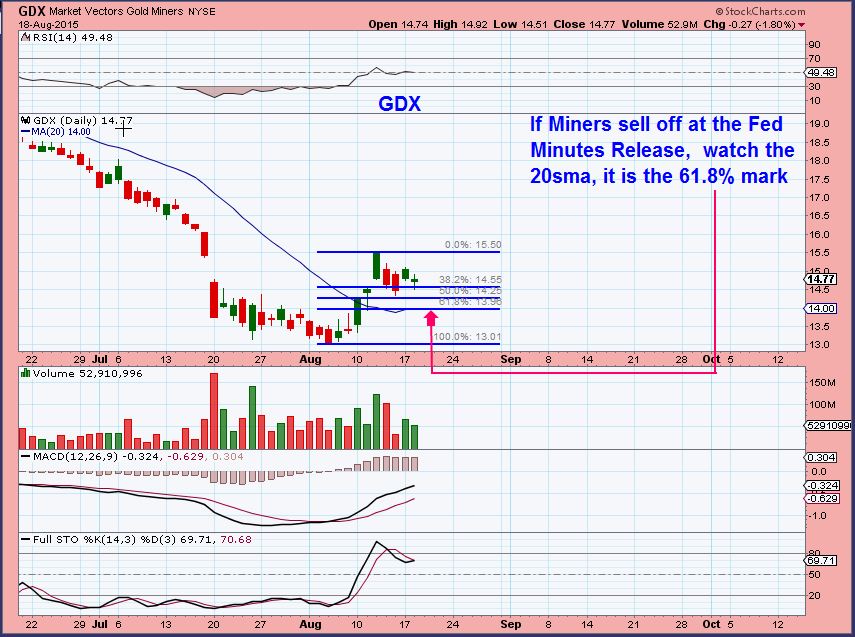
GDX – If we sell off today, look at targets. This could drop almost $1 and still be fine.
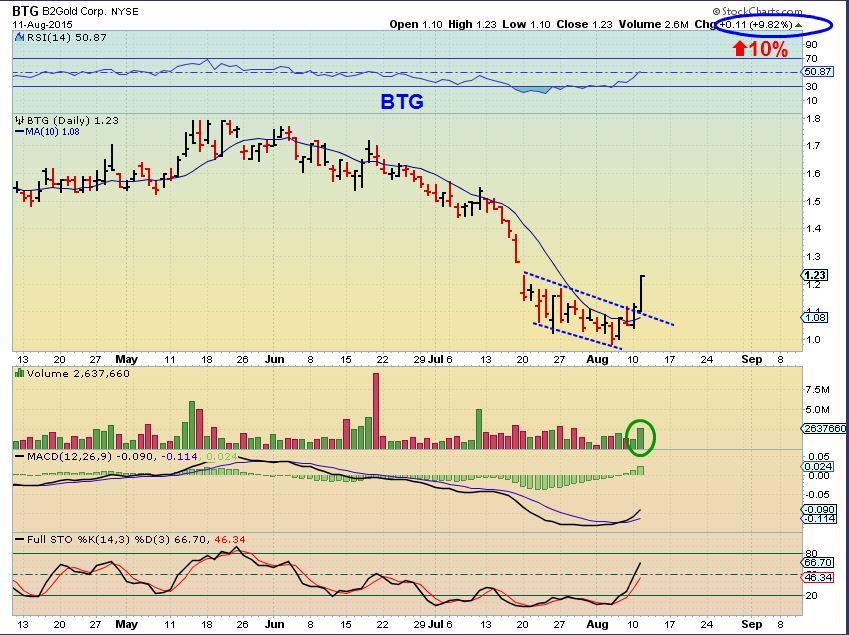
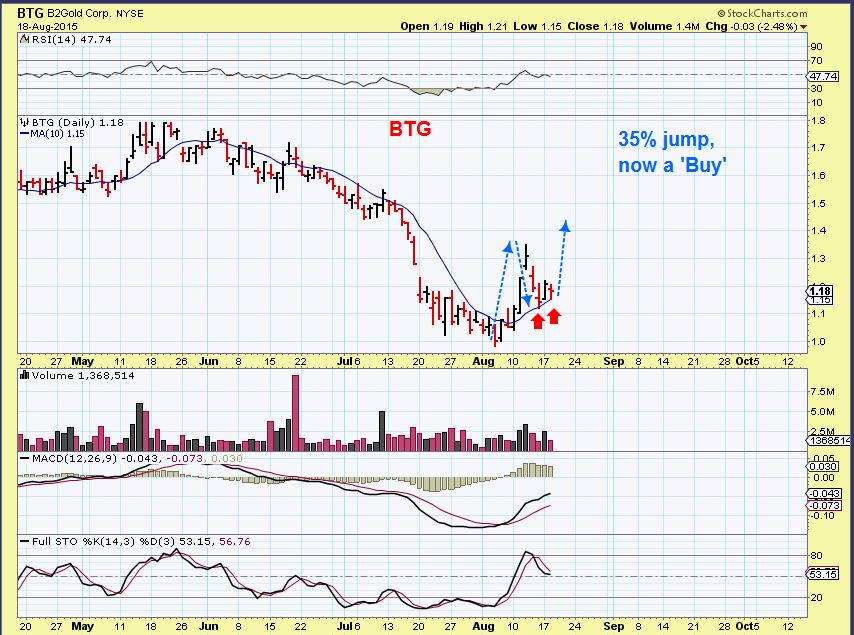
BTG – Then and Now
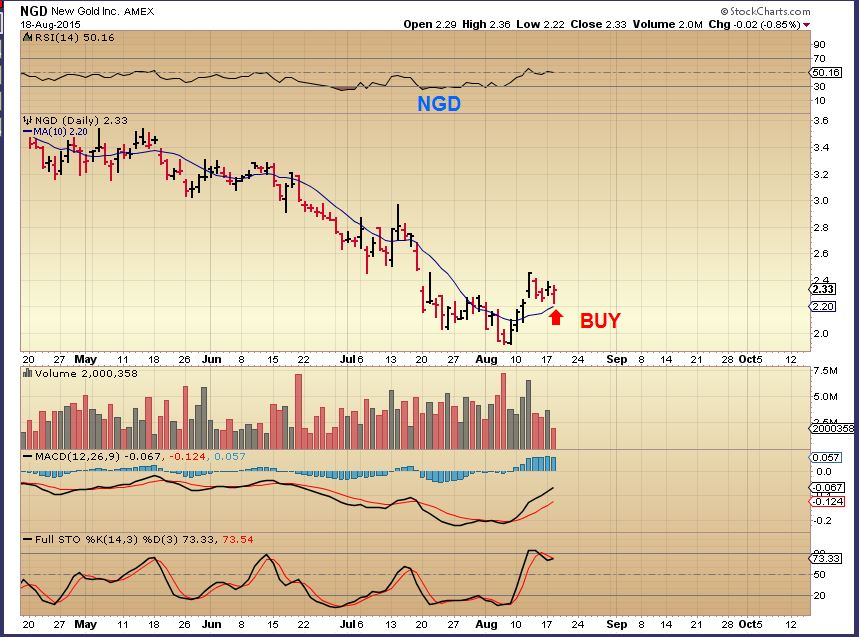
NGD – Then and Now
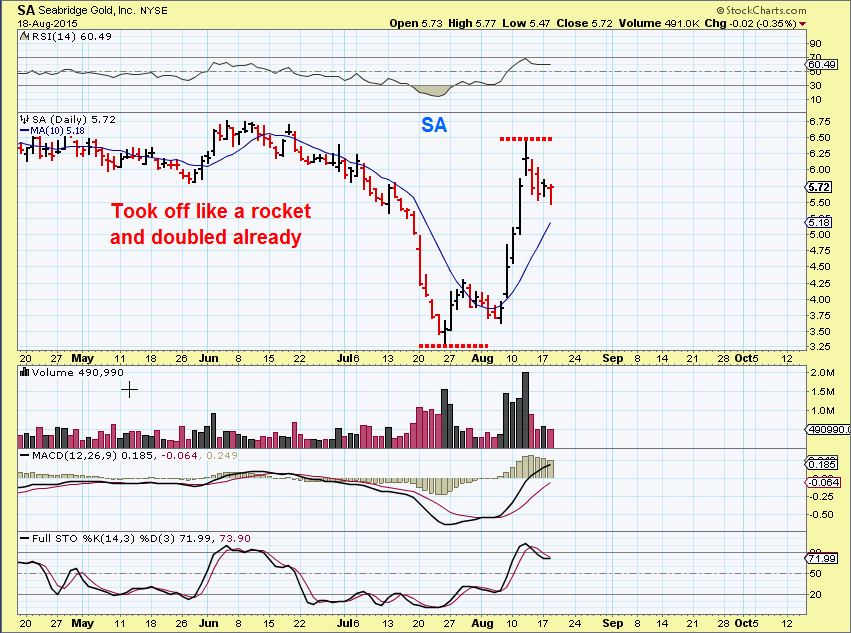
SA – Can you believe that this already doubled? Now it seems to be flagging to the moving averages.
So today could be a little whippy if it is like any other Fed Minute release. There may be false moves down and then up. It is sometimes hard to know what the real move is until after the dust settles. The markets are currently down , with Gold & Silver rising higher. We know that that can change, but it also doesn’t have to. I personally think that GOLD, SILVER, & MINERS are set up to move higher. We’ll have to see how the day ends ( and maybe even how tomorrow begins) to get a good feel for how things are going to play out. I am positioned long Precious metals and will hold through todays action, unless something seriously ugly develops. I have outlined various scenarios in hopes of helping you not to panic if we do see selling. I hope this helps you to be able to navigate the situation. Buy , Sell, or Hold.
~ALEX
Donated by one of our commenters – A possible Gold sell off . It shows how it would be possible for Gold, looking strong right now, could drop to $1100 area. Thanks Maria


Indeed silver is a more volatile beast, and much less “well behaved” technically than gold (as are the miners quite often). Analyze it at your peril (at least shorter term). 🙂
Good advice to wait ’til oil at least closes above the 10 DMA. It’s getting slapped right now. Catching falling knives, and all that…
Amazingly weak & oversold
New High for GOLD today is good for improving chances of a right translated Daily Cycle
GOLD is higher than the 12th, yet GDX can’t keep up! Frustrating. GDX doesn’t react just to Gold. If the general markets sell off, you can bet the miners will get beat down as well.
You could be right Bill although I hope not! My working scenario is that between now and late Sep/Oct the general equity markets will suffer a major correction, which in turn may be only the first leg down of a MUCH larger equity bear market. If this proves to be the case then yes PM mining stocks may well get caught in some of the intial down draft but I also think an equity correction/ bear will tie in with another major bull cycle in gold and silver possibly one of the few hiding places if it does become an equity bear. At some point and hopefully very early on that would also be reflected in PM miners and they would be prove to be one of the few bullish sectors in the equity arena. At least that’s my big picture view at this time but as always price action must confirm and stop losses must always be honoured! If memory serves, gold stocks soared in the early 1930’s while the Dow fell more than 90% and no that is not a typo…the Dow Jones index did fall in excess of 90% between 1929 and 1932!! Now THAT was an equity bear market…but not for gold stocks!!
Chris, I agree with your scenario. But I think most money will go into gold and silver and not the miners. When traders have to raise cash, they sell everything, even miners. I’ve lived thru it before gold goes up and miners go down.
As a general rule Bill I would agree with you totally. However, there are exceptions to every general rule as back in the early 30’s. My thought is this time we have just been through a devestating bear market in PM miners and everyone who was going to sell has sold, even if in what looked like a final capitualtion event a few weeks back. Therefore, there is likely no long term investment money left to come out and I donlt think the ‘hot’ money has even begun to flow here yet, so they won’t be selling either. I suspect the only buying has been predominantly by ‘smart money’ long term investors. Gold/silver stocks realtive to gold are at virtual generational low value levels and therefore potentially the buy of a lifetime.
Logically it will be momentum equity stocks like AMZN, NFLX, GOOG and the such like that should get pounded in any equity market correction and for those who HAVE to remain invested somewhere, my thinking is that they will hunt out defensive areas and severely beaten down ones and there are few as beaten down as PM miners. Only some personal thoughts but as I said earlier, price action will ultimately reveal all. But secretely hoping we are in for the ride of a lifetime!!
Chris, I hope you’re right. I am just afraid that nobody wants to invest in PM miners anymore. Its going to take a lot of cash to come in and move it back up. Hope you’re right. I am here for the same reason.
I do Bill!! Lol To get things rolling it may take less cash than you think though. All you need is little or no selling, which would be the typical scenario at the end of a major bear market, when the selling is quite literally exhausted. Then, even small amounts of buying will drive prices higher as it is almost one way traffic and eventually the momentum players will come to play as well!! I’m trying to be an optimist here!! Lol But it’s been a long and VERY draining bear market so I know exactly how you feel!
I’ve had same thought. Thanks for sharing.
Getting close to another buy at support possible on Energy stocks XLE ETF ?
FWIW:
Added just below support. Risk Ratio is Excellent. Daily cycle count Oil at 62 days, Weekly on 24!
Risk around 1% if you choose to place your stop below Aug. 6 low but this deep in the cycle count ……..
I hear you. Stalking entry myself. I haven’t done well picking the right individual name at right price. Would probably do better with ETF basket.
Also really glad I didn’t take a stab at crude yet. Ouch!
nice….
… sigh.. this dry powder is burning a hole in my pocket..
…. i should just head out the the range and shoot it up… ha! yeah…!!
I couldnt believe that AU was below $6! Now its finding its footing
Alex….. thanks a lot. Excellent, excellent report. This helps me!
This keep my nervous and blood pressure in control.
Again….. many thanks.
Ur welcome Geurt.
It IS a Fed Minute Release day, so Gold/Miners can go in any direction after that- but it does look bullish. So Like I mentioned …
1.Some may sell before the minutes & add back in tomorrow?
2. Sell a little before , add back later?
3. Step aside & enter in the 2nd daily cycle
4. Ride it out, knowing how much it could drop.
THANK–YOU–SOOO–MUCH…. ALEX.
That’s a very good advice
Alex, thanks for the charts overview GDX recent past IC’s of last Thursday, very helpful- GDX behavior: from ICL to 2nd DCT quite variable; Target: TIME in ICL-2nd DCT , gauged by cycles and observed @ 2 month run.
Hi Rube,
Yeah, it actually helped me a lot. I did a study of ICL’s Buy & Hold for the first daily cycle and then somewhere near 13 days of the second. Results varied a lot, but good gains were in each. The big difference seemed to be the first daily cycle. Some never pull back, others came almost all the way back to lows.
So TIME was a good idea for a basket of miners. About 2+ months from ICL .
Can you expand? about 2 months for the end of the 2nd DC?
Sorry Bill,
No , what we are discussing is in my report last week. From ICL to the top of the 2nd DCycle has been roughly 2+ Months. I had charts showing it.
I thought so, just wasn’t clear, thanks
Just checked, I believe we are at day 30 on the GOLD cycle (the low on 7-20)? So are we starting the 2nd DC now?
I believe he means @ 2+ months from ICL to 2nd DC top.
Anyone notice ACI today? Up 50%. Don’t know what’s up there but maybe the coal industry is not quite dead?
Good eye Carl, I didnt even see that it ran up about 100% earlier in the month. Looked at BTU and that looks good too, like a rounding bottom.
Thanks Alex for keeping it real. Those who blame everything on “manipulators” and “evil banksters” are in reality trying to avoid taking responsibility for shoddy analysis. jmho.
Hamvestor! How are you? I recognize you – Nice to hear from you again!
I was thinking something similar. We all know that anything can happen and markets sell off deeply at times, or surprisingly, but why not look back and see if it happened before and what it indicated?
Maybe they just bring up these emotional issues so someone else will do the work and get the answer for them? Or scare people into thinking they need their help? Silver has definitely dipped lower than Gold in the past early in a rally, but it sure made up for it in the 2nd daily cycle on those charts.
REXX, EXXI, XLE , etc not able to hold up with Oil at new lows again.
And BAS – Ouch.
I’ve been monitoring my 1 hr chart for WTI and earlier today it tentatively began to break out of a minor base above 42.75 for a glimmer of hope. But as it did it was approaching the still falling 200 period ema which aborted a minor bear rally 14/15 July at 53.50 and then the next minor bear rally 29/30 July at 49.30 Both of these were followed by further significant down legs!! 🙁 So as much as I would love to see a bottom in oil, right at this moment it’s not encouraging price action even on a very short term chart! 🙁 I’ll kep checking though and let you know if I see any improvement. Although I am off to the pub for a few well earned pints shortly. I’ve been on the go for nearly 10 hours now and am as dry as a bone!!
Morning everyone. Slept in this morning and woke up to shiny metals 🙂
Anyhow, some energy plays are still being accumulated while the general market is getting severely gloomy.
still like AA long idea.
(refresh)
Check out the double bottom on CENX too
CNBC just making mention of the move in gold and the record short positions held by hedge funds and the prospect they may have to start to cover. That would potentially make things a lot more interesting but as Alex has already pointed out, far wiser to let the dust settle after the FOMC announcement and not be overly distracted by just short term wiggles.
The Elliotts are not convinced the correction is over yet…
GDXJ uptrend line (also 10sMA is thereabouts) would give 50% retracement.
wave C would be 0.76 of wave A also
Long JDST for the day. (above VWAP) – very tight stop.
you could also short a x3 long fund *(JNUG or NUGT)
GDXJ cracked
yup…
jdst good catch frenchie ;o)
gold is powering on though… I’ll be surprised if it doesnt hold that 1120 area…
yes, I hope gold will keep its cool. Just scalping JDST
Nice GOLD! out of JDST with a tiny profit. (stops were tight)
i think this is minute 4 up… 5 down is coming… i think.. {another short}
I didnt hear anyone hear mention it. The Minutes were released early … the digestion process has been in the works for a bit now
well that seemed like a total non-event….
had my tea & popcorn all ready :-/
dont put that popcorn away jussst yet… quick drop for 5 is coming…
As Maria would say…CHART CHART CHART!
Or at least, “Time frame and length of time”
LOL!! ur gonna get me fired…
hang on..
CF is not safe for work
I haven’t got the heart to tell her the news
https://www.yahoo.com/tv/s/tv-batgirl-yvonne-craig-dies-78-045445765.html
im a Catwoman fan myself.
Lee Meriwether.. yum!
aww… she passed? sorry no time to read… but i WILL wear my catwoman outfit in honor of her ANND drink a glass of wine while I chart tonite**…
**i do that anyway
;0)
**and blast music #LuvMyBose
u can say THAT again!!
no smaller …but what do i no.. i could be making this all up…LOL
https://www.tradingview.com/x/vlJB9oDQ/
target 10.35-10:50ish.. but who knows… things COULD get crazzzzzy and it could fill that gap???
Thanks and that’s interesting because I was looking in the sme time frame on a 10 day chart ( GDXJ too) and did see the MACD refuse to cross higher as those highs were approached (Which often leads to a small pullback). This is trader talk, in case any one is reading this and fears a deep drop.
I’ll get a chart
It can be viewed as an inverse H&S, but it isnt expected to break higher until the MACD straightens out, so a drop to your 5 would be possible – but how deep is unknown. (refresh & click to enlarge)
.
This chart above did have a small drop, but now ( 3 p.m.) is turning higher again and the MACD could cross this time….so far just wiggles.
OMG… Yessss.. oops sorry – :-/ maintain maria…maintain…
ok… so i actually had a minute to look at charts… on the smaller timeframe.. i do believe it is in “5” now… which it should break out or “throw over” as EW say…[ER} eyes rolling…
but .. on the larger wave one degree higher.. it still looks like it has to complete the 5 down…
i highlighted what i believe are the corrective 2 & 4 waves…
is that possible???
https://www.tradingview.com/x/Ye4RrD5C/
wait… did u just say EW is interesting…. hmmmmmmmmmmmmmmmmmmmmmmmmmm
and then .. this one is one degree higher…
1 was extended… and since 3 cannot be the shortest..then 5 has to be truncated..so based on that babble.. i THINK 5 should be a quick/truncated move..
the end.
signed
MissyElliottW
https://www.tradingview.com/x/8vL6dr2j/
are these the 5 subwaves of an A wave… so you still have at least a B & C to come?
ps.. i can only see an A-B-,… or an A-B-C-D- in that lot.
you shouldnt be allowed to wear your catwoman suit .. until you use letters 🙂
If you get fired just start your own EW newsletter! 😉
Lol..that’s sweet of u cason but that wouldn’t have a happy ending. ..at least not in my current ‘green’ state.. i could just read the headlines now…
Woman found dead ..stuck in channel after EW went adrift.. lol
** oddly enuff she was wearing a catsuit
Ha!
Hey, I’d join. At least for the 2 week introductory period. That was funny, btw.
:o)
which 5?… the one on your expanding triangle?
(equivalent to my gdxj C wave down i s’pose)
weird. like 5-6 min early.
oh mann.. shazzzammm…. I like that blue outfit…
mines black…;o)
Short S for a scalp. (tight stop, good r/r)
Wow, GDXJ broke its flag. Nicely done
Alex anybody? Have any thoughts on RIC? Seems to be consolidating last several days and support at 50dma. Just not a lot of volume either way?? Thx!
Yes, possibly consolidating the recent run up. That was over 40% , so it may need a bit more time before the next move. It broke above the 50sma and now rests on it and is moving sideways currently. I LOVE the 5 yr weekly chart
Thx! If this works out I may actually be learning something from you and this site! How cool is that!! 🙂
Have a great night everyone….we weathered another storm!
” Boy, that was easy” 🙂
Alex check this out… Interesting
nice… that’s some serioussssss stats … interesting…
Hi Frank,
Thx, but I have never been able to use those. I buy set ups near the lows, and those are usually telling me when a stock has already moved up 20-40% . I developed a few in the past and they almost always went on a ‘buy’ right before the stock was about to do its first pullback. They are good for seeing which has performed better, but I also see that better on a chart. I hope it works well for you.
Alex, nice work keeping your cool btw silver flash sale yesterday and minutes today. If I hadn’t been reading and following along, probably would have ejected postions yesterday.
So, all you CFs out there, any targets for Daily Cycle1 before we drop inevitably into a DCL? I charted the price by volume and posted last week. Shows serious resisitance 1142-1144 for gold. GDX upper BB curving up to make room now, 50 day dropping down from 16, they should meet this week. If we get up there will likely trim significantly and add again at a later date. Anyone have something different?
As I write today Cason gold is already at 1141 and just probing the bottom of the first likely resistance zone. It’s also right at the falling 66 day ema, which is one I frequently use for various reasons and also the level of the November low. So already at the first hurdle? Then we have a prior support level around 1147 and a far more significant one around 1170 where the falling 30 week ema (150 day) is along with a minor downtrend from the Jan and May peaks. If we reach that 1170 area near term I would anticipate at least some initial resistance at such a formidable looking convergence of resistance. Overall though and based on a number of related things I’m watching I’m inclined to feel this first bull leg could run until mid Sep although not in a straight line. If that proves to be the case then that may prove to be where we see the first really serious correction after potentially a rather nice first leg. Just a few thoughts, which hopefully might be of interest.
Also one of the other CF’s posted a nice short term chart of silver a few days ago with a potential reverse head and shoulders developing. The right shoulder has now formed beautifully and we are currently attacking the neck line area around 15.55/15.60. IF and I stress IF, we can make a clear break and close above this level then it would create a potential near/medium term target around 16.70/16.80. Just maybe a nice target for mid Sep if all the above pans out!!?
If this holds into markedly open, I’m going to be scaling out of GDX calls. Likely to hold a runner on case it continues to move, but I’ll be picking gains in leveraged positions for sure.
See 1144 gold and 50 day (16.03 as of yesterday) as potentially stiff resistance.