
A Step In The Right Direction
I was very happy to see the steps that the Metals and OIL markets took as the day went on. We will discus those steps in detail further on in the report, but first lets take a look at one of the major players in todays movement.
USD – many were saying how strong the DOLLAR was looking, but I was writing that it looked weak internally, since mid July. This should bode well for Commodities.
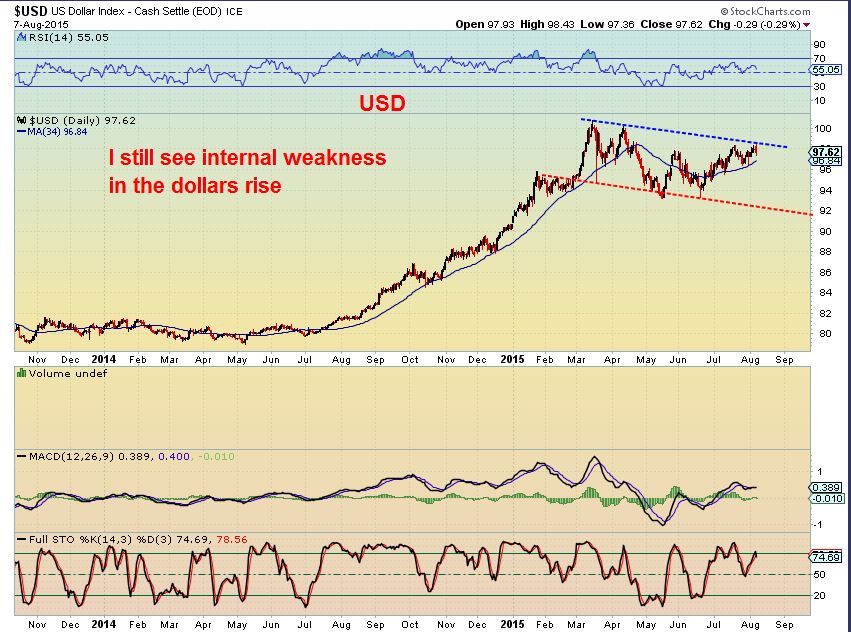
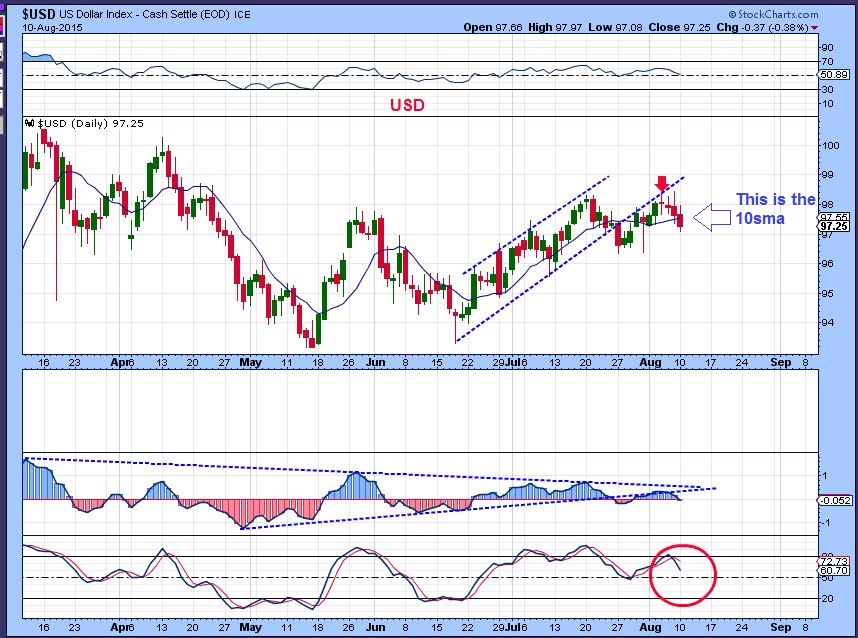
Notice the next chart of the Dollar…
The USD broke from an upward channel and is back testing it. We closed below the 10sma Monday.
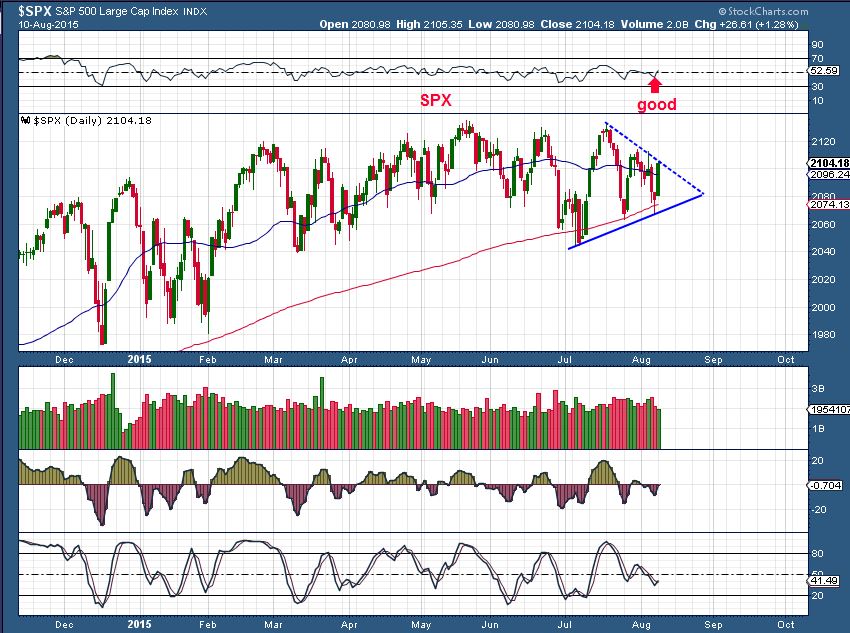
SPX – will the market be able to break higher? Maybe, that was a nice move Monday, but can it break to new highs if it does? These markets have been struggling sideways for months.
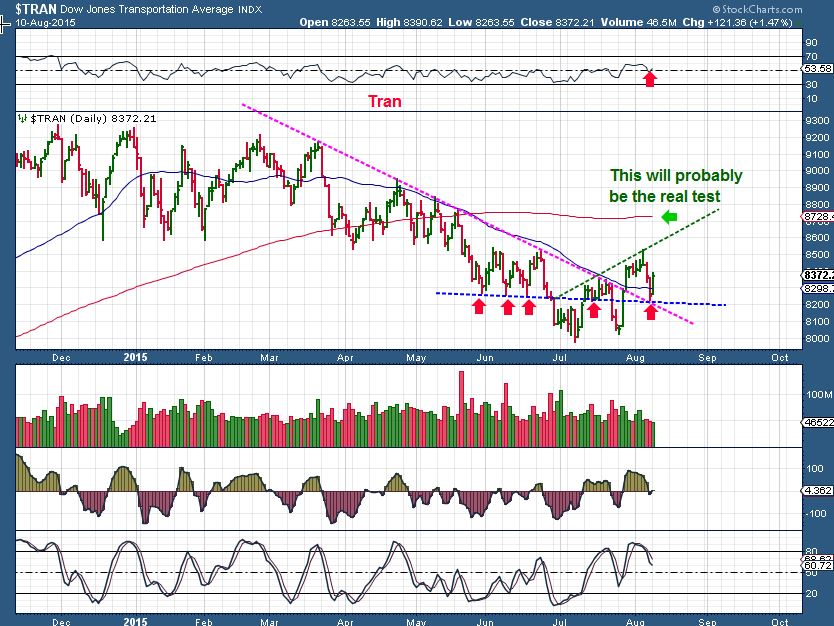
I’ve been watching the $Tran –
It also had a nice bounce off of multiple supports. Volume seemed light Monday. The real test will be if it arrives at the overhead 200sma
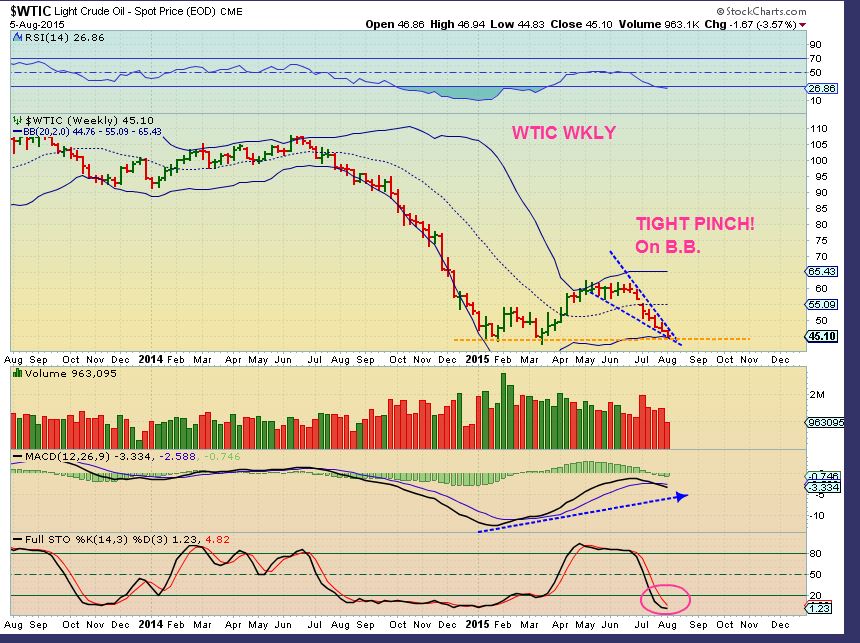
WTIC – we were expecting a push out from this squeeze. Energy stocks actually started to Pop & run higher last week.
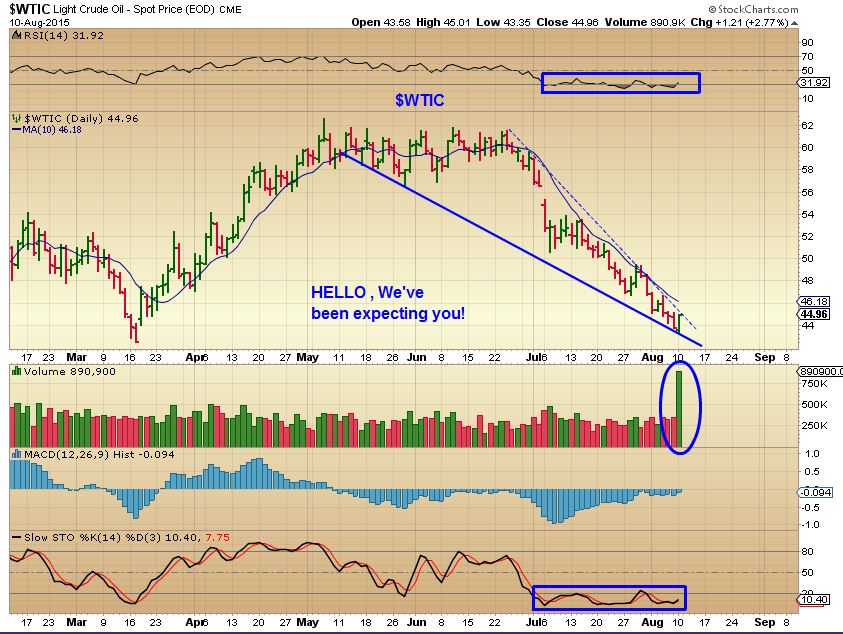
WTIC – And POP it did. Look at that volume surge! Oil looks ready to break out and if you watched some of the energy stocks , you saw many front running the anticipated move. MHR & MPO were up 60% and 70%. Many were up 15-20 %, and OIL isnt even above its 10sma. This is telling us to anticipate at least a short rally in oil, maybe more.
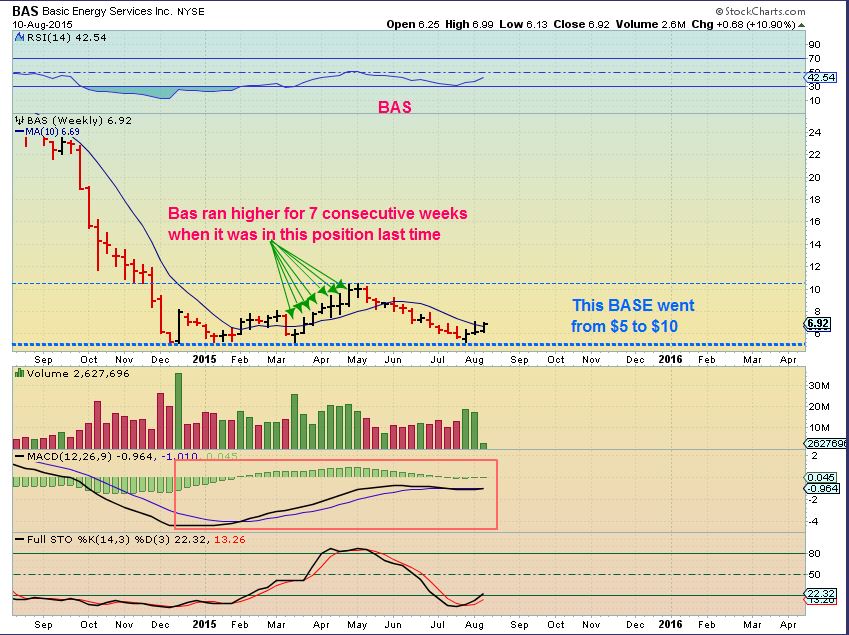
Many of our former OIL / ENERGY stocks look to be ready to trade again. They have continued to put in their long bases.
Lets look at BAS for example:
WKLY
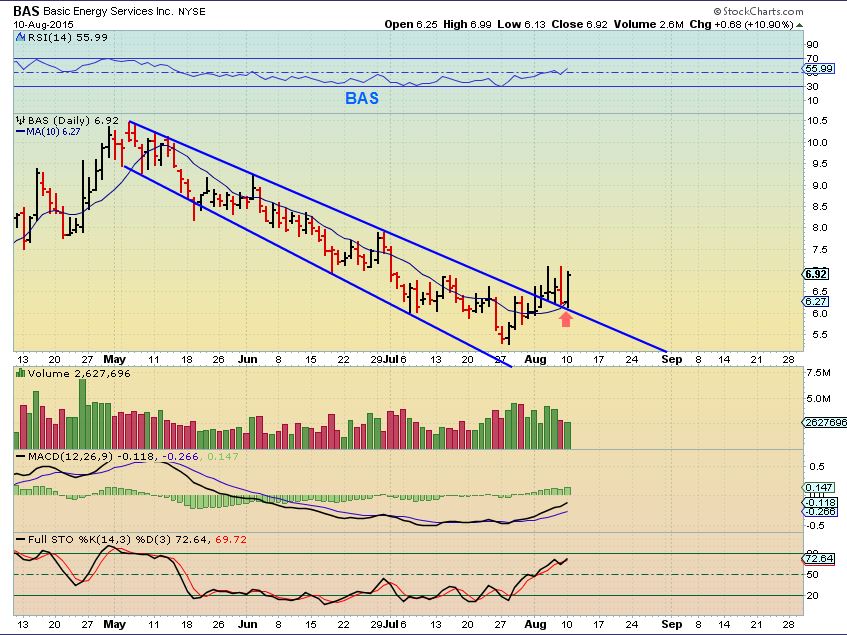
DAILY- already did a break out & back test. See how it reversed on the 10sma? This is what many Miners may do going forward too. Look for this type of movement in Miners.
We need to talk about
GOLD , SILVER, & MINERS
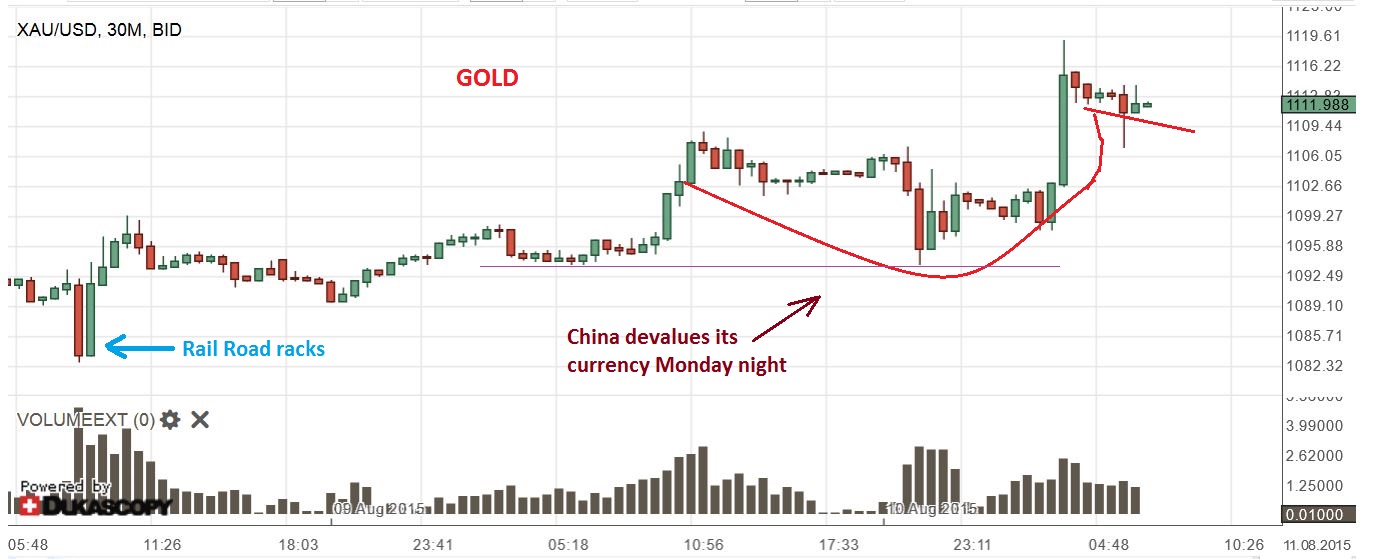
GOLD took a step in the right direction. Not only did it close above the 10sma for 2 days in a row, it put in a higher high for what should be day 11 of a new daily cycle.
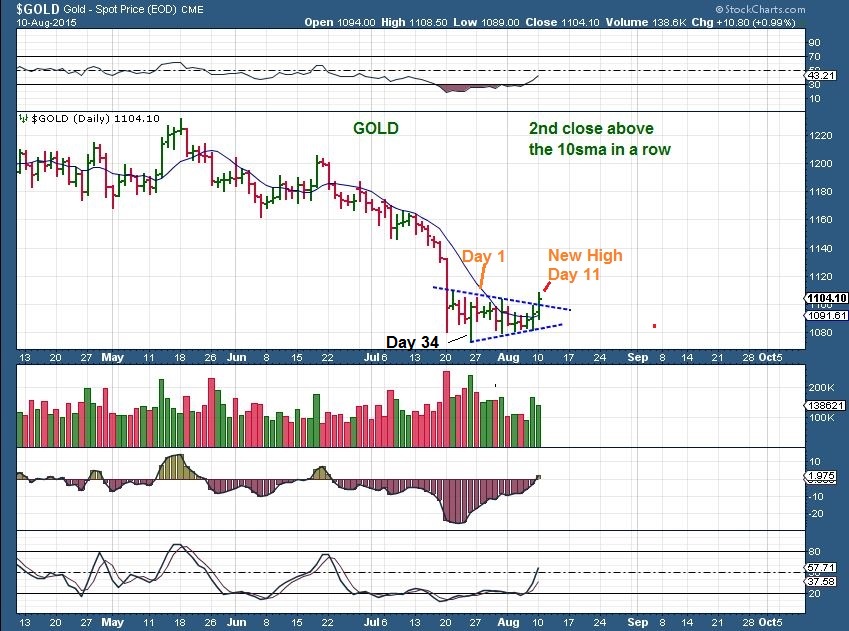
Just to remain balanced , if this was a new 4th daily cycle , we could rollover from here any day now with a day 11 high and drop to $1000 or below, but I do not think that likely and here are several reasons why.
.
SILVER – looks strong at this point, closing near the highs where it had formerly put in a reversal at the down trend line. Silver stocks looked very good too. GDX buy signals came in ( I have a separate chart now)
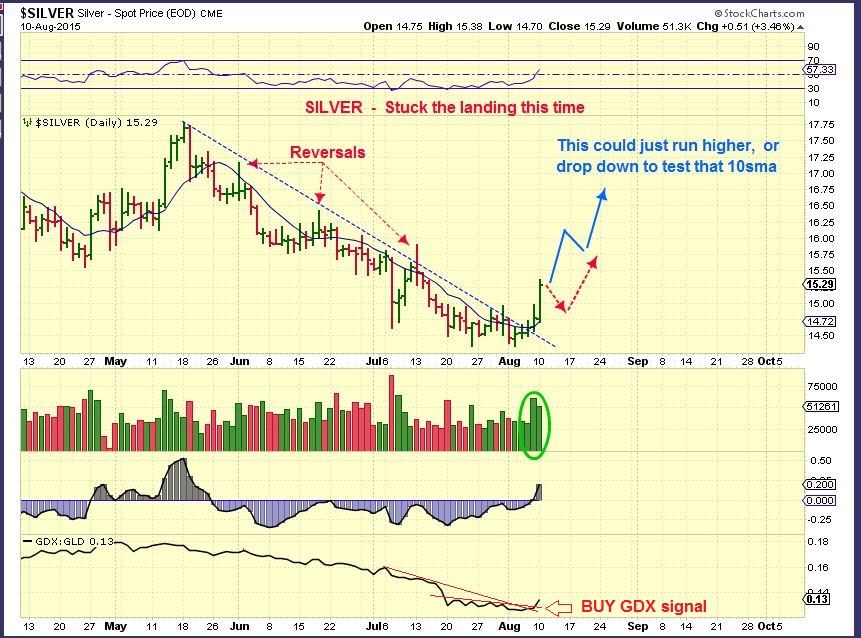
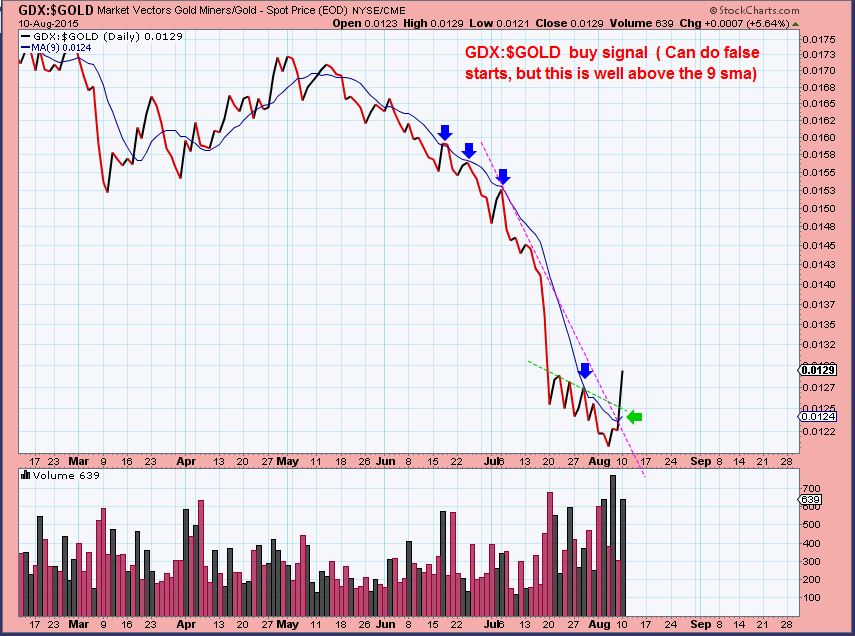
GDX:$GOLD – Miners are out performing Gold by a lot after today. This is a ‘buy signal’ for Miners. On its’ own , it is not THE MOST RELIABLE, but it did trigger a ‘buy’. So with Miners on a buy, we will have to discuss that further shortly.
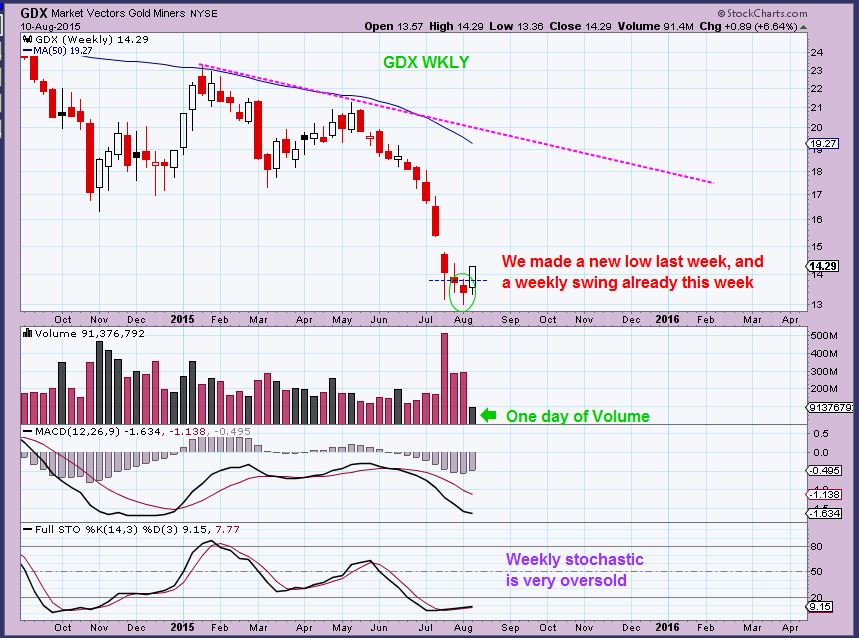
Its only Monday and the WEEKLY GDX chart is already showing a bullish sign. It has put in a weekly swing. The timing is right for an ICL too, so we may assume that this is a very bullish set up ( We still use stops in any case, if you are holding Miners).
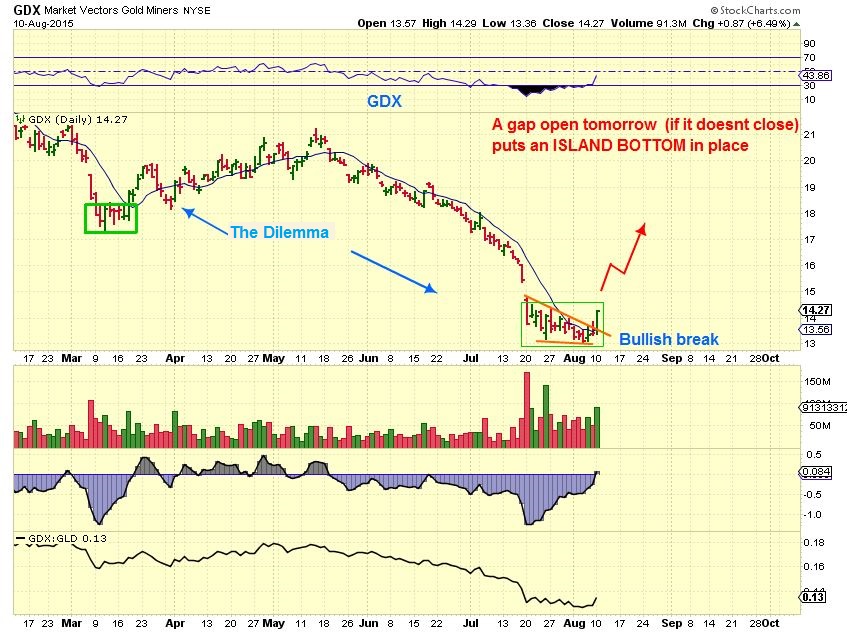
THIS is where the dilemma comes in. How does one enter now if they waited and still didnt buy the break & Close above the 10sma? (Which was announced here as a secondary & safer buy , with a stop loosely below). If you have been a Chartfreak Subscriber for months , you know that I call this section :
“Not All Bottoms Look The Same” In other words, we do not know what kind of Bottom we are about to see if the bottom is in.

Lets discuss various Bottoms to help with a strategy
The Dilemma is that last week or today was the BUY. Looking at this chart set up, if we gap open higher tomorrow and do not close that gap, it causes an “Island Bottom” . Those gaps do NOT have to fill and short covering often just pushes price higher. With an ISLAND BOTTOM – If you are not in, there is a risk that you miss the move waiting for a gap fill or pull back. That is just 1 type of bottom.
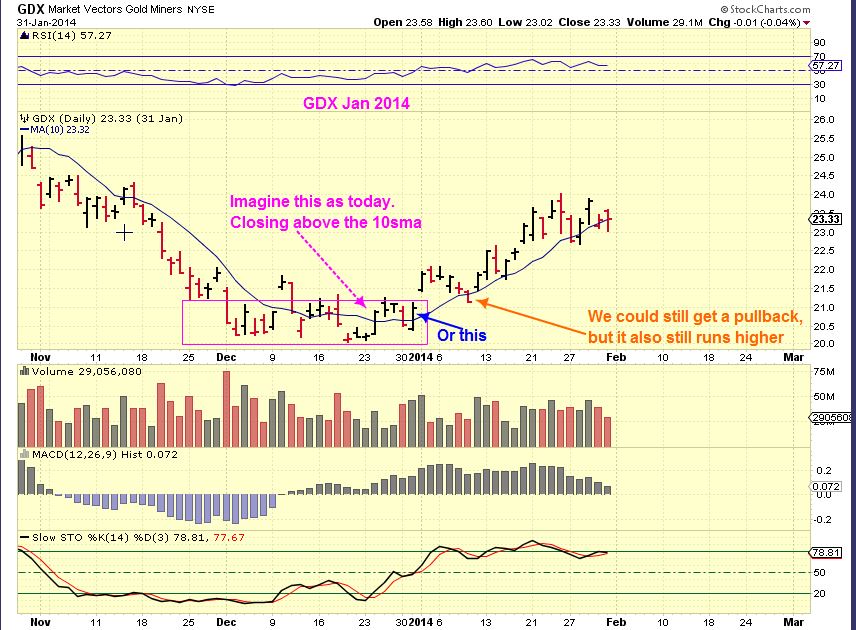
Dilemma #2
The other part of that dilemma is …look at the DEC 2013 lows below . Notice that price gapped up in January , and then rolled right back down. This is common for Miners. We saw it with the March 2015 lows. There is a risk of buying a gap higher this week, and having it falling back lower for day.
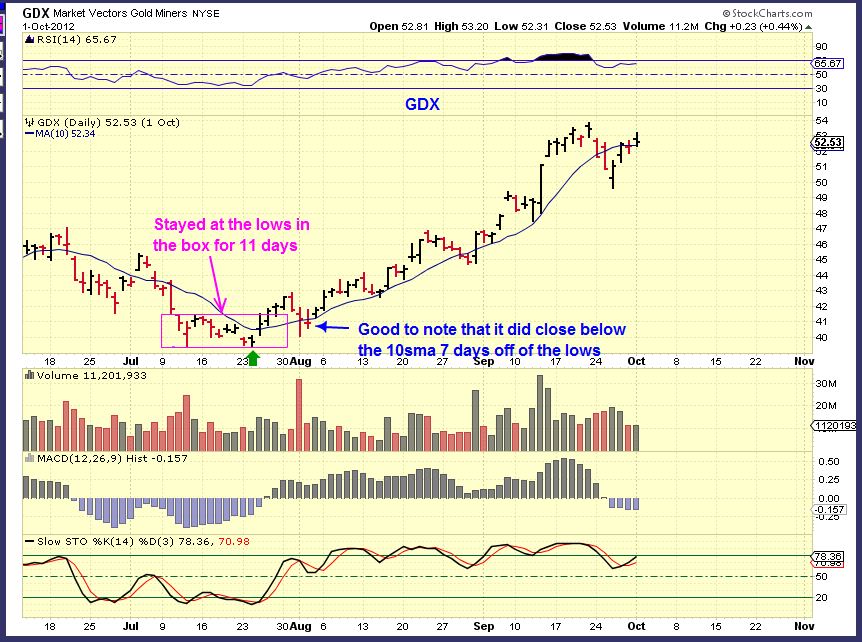
GDX 2012 – also ran higher above the 10sma for days from July 23 and curled back down . Picture us currently in the magenta box above the 10sma. Buying above that 10sma you would also experience some down days.
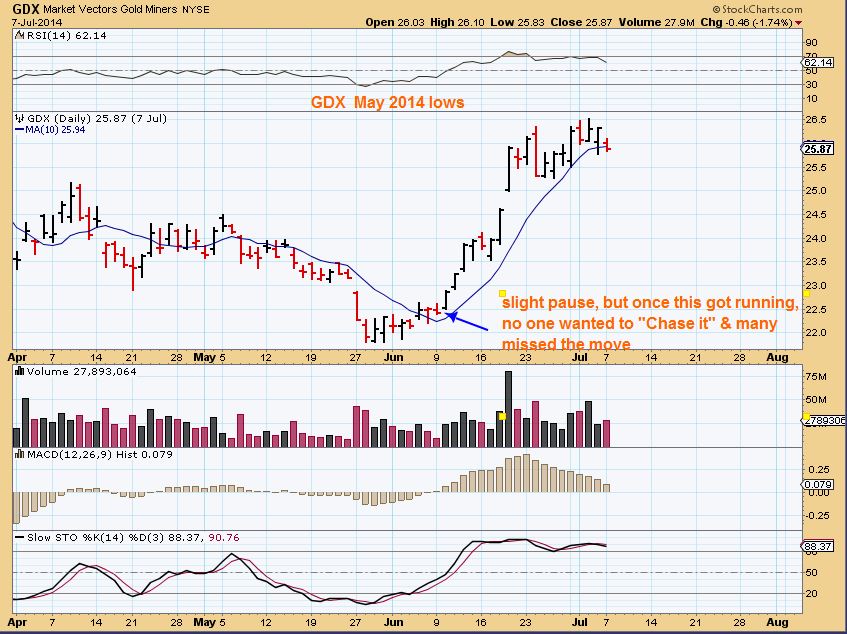
Dilemma #3 – A sharp short covering rally can briskly take prices higher and higher and higher.
We saw this Bottom in May – July 2014. No real pullback. If traders were not ‘in’ and they said that they “Dont want to chase it, I’ll wait for the pullback” , where would they have entered after the close over the 10sma?? This type of bottom leaves people waiting.
What type of bottom are we looking at ? No one really knows yet.
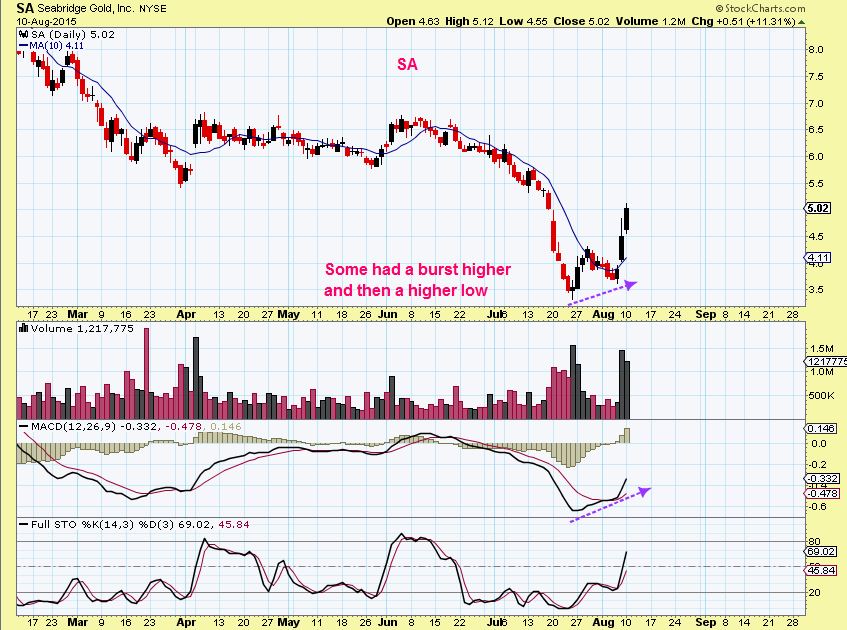
So what does one do if they are not in at all yet? I recommend one takes a “starter position” in a miner that is just starting to leave the bottom or has popped higher and already pulled back. THEN if we just run higher , you can add on the run higher. If we pullback to the 10sma , you can add more funds if we are pulling back correctly. Lets look at a few Miners.
SA – Double bottom higher low ( See also IAG or NG ) This one already ran up for 3 days off of its lows from July 27. It then rode the 10sma down for 5 days and formed a higher low. Volume was extremely light compared to the surge higher. If you see some miners doing this, the buy is down at the 10sma again ( they do break below at times and recover quickly. See how SA did that).
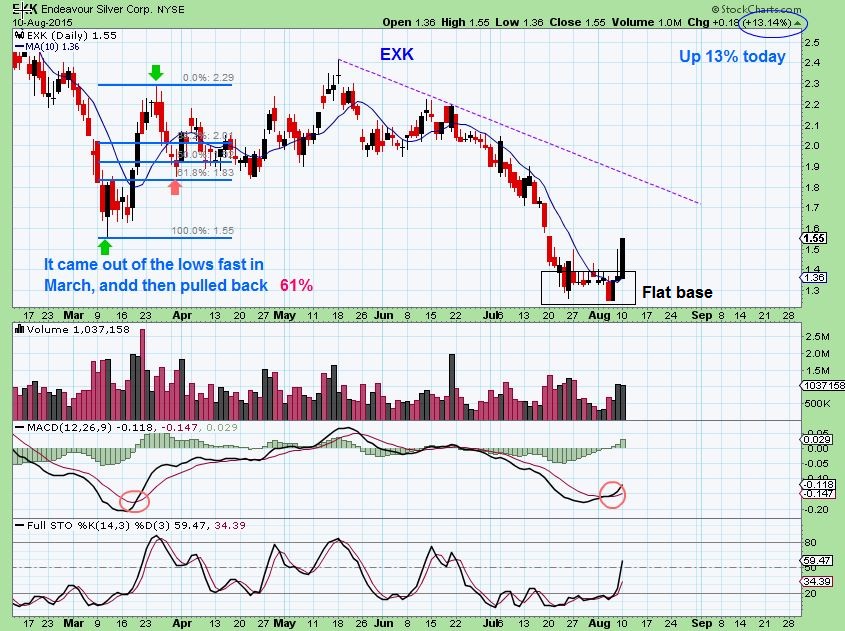
Some are currently forming flat bases.
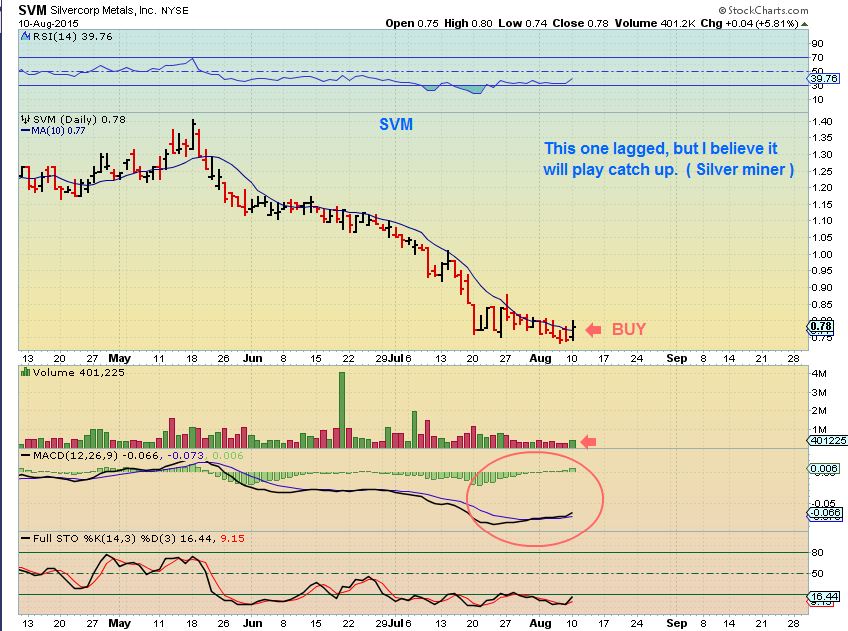
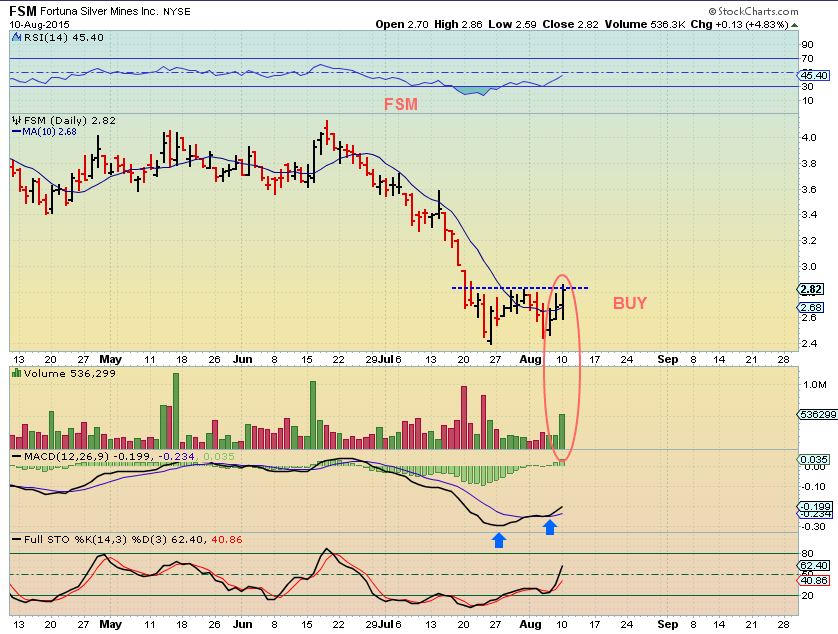
EXK – In March the small flat base took off higher for a week, but it still retraced 61% of that run. If you find a Miner with a flat base that hasn’t exploded yet, it may be a trade candidate. (FSM & SVM are flat bases now for example )
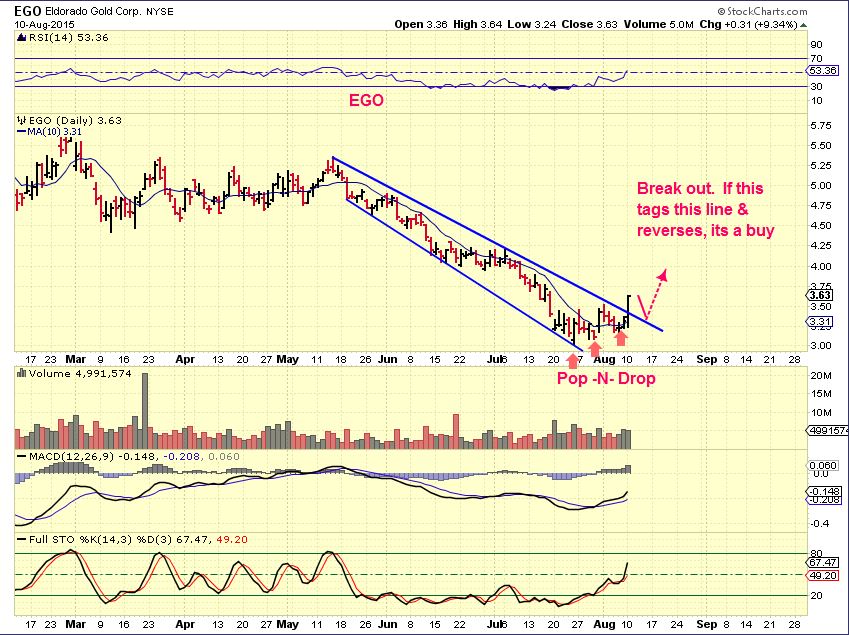
EGO was interesting too. It POPPED and dropped for a couple of days. Popped and dropped again. Popped, Repeat. Will it drop here for an easy entry? It was really a good buy yesterday, breaking above the channel line. Do you see any doing that today?
SO things looked good Monday. Our Reversal Friday in Gold did NOT get slammed down on Sunday and then it had some follow through Monday. Almost all of the MINERS are moving higher now and looking like great set ups. I cannot say what will happen Tuesday, but we could run higher for the next few weeks. What I am going to do for the Wednesday report is put aside all general market commentary for the sake of time, and just look for ENERGY & MINERS Stocks that may become good ‘buy’ opportunities. I’ll post a couple of Minersat the bottom today too.
The discussion that I had again on “ALL BOTTOMS LOOK DIFFERENT” is because it is important to recognize that all bottoms act differently. These stocks are so beaten down, they could do any number of things and we dont know for sure which way they will react.
1. Some may just take off like the chart of MAY-JULY 2014 above. No pullback materialized. If one did not have at least a small position, some got left behind.
2. On the other hand, you may enter today only to see prices reverse and drop down in an attempt shake new ones out. With that in mind, you could just start a small position and add later if you haven’t already added any Miners. I will look for opportunities as they arise.
.
P.S. China did a currency devaluation last night. This move should be bullish for a strong dollar and it temporarily ‘rattled’ the price of Gold, but Gold has since recovered and even moved $8 higher as of 7 a.m. That testifies to the lows likely being in for Gold I.M.H.O.
~ALEX
.
SVM –
FSM –
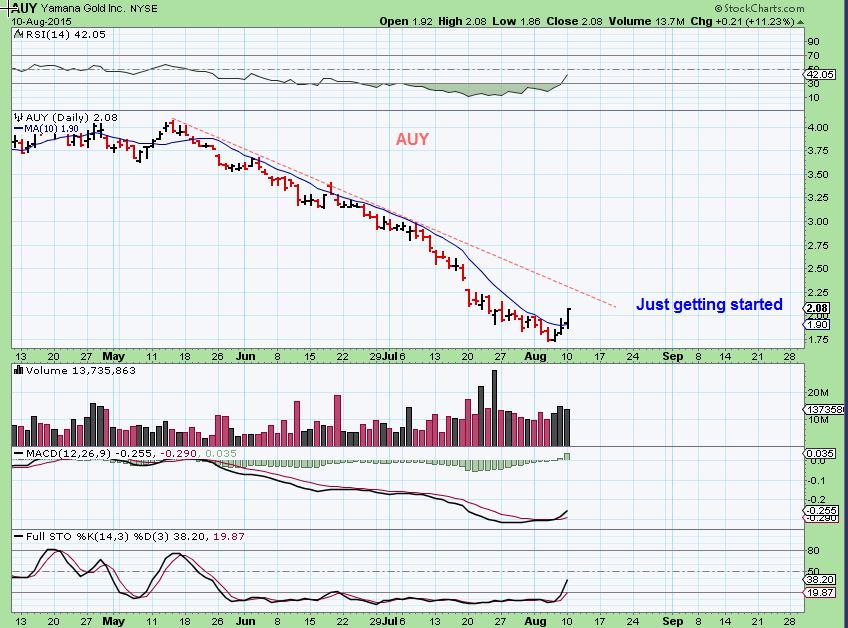
AUY


Info I just learned: on Sept 10 Direxion will reverse split NUGT 1-for 10, JNUG & GASL 1-for5,TZA,FAZ,JDST 1-for4. FYI.
Does this have any reaction to the stock?
Who can response I really appreciated.
I don’t beleive so, but would appreciate answer from Alex. Example: if done today NUGT would trade @ 38.00 not 3.80.
Hey guys,
The answer that ‘they have to do this is’ correct. They would eventually go to nothing on the pullbacks after time. The decay in them longterm in a sell off is brutal. It does NOT affect how it trades right now, but it does allow more room for the downside later.
Look at a sideways move in GDX for 2 years and then look at JNUG or NUGT for 2 yrs and each new rally is lower & lower, each sell off is deeper and deeper. For example GDX dropped in 2014 to now = 50%. It went from $28 to $13, yet NUGT has gone from $60 to $3. HUGE HUGE HUGE decay.
GDX is down 50% and NUGT is down 96%
That is why these are NOT buy & Hold vehicles during a correction. When a $3 stock moves up 100%, its only a $6 stock. You never go back to $60.
Bill is correct, they have done this before to save them from being penny stocks.
Thanks Alex & Bill. I understand it more clearly now. 🙂
Real life example – I last sold UWTI at $3.18. I bought it back today at $1.18. OUCH! (No, I did not touch it anywhere in that range). That would have been a rough ride down that you can’t really come back from. BTW, they need to reverse split UWTI now, too.
I have found a great explanation in the past.
*********
Why shorting leveraged ETFs are mathematically in your favor (Source: Wikipedia)
Leveraged
ETFs require the use of financial engineering techniques, including the
use of equity swaps, derivatives and rebalancing, and re-indexing
to achieve the desired return. The most common way to construct leveraged ETFs is by trading futures contracts.
The
rebalancing and re-indexing of leveraged ETFs may have considerable
costs when markets are volatile. The rebalancing problem is that
the
fund manager incurs trading losses because he needs to buy when the
index goes up and sell when the index goes down in order to maintain a
fixed
leverage ratio. A 2.5% daily change in the index will for example
reduce value of a -2x bear fund by about 0.18% per day, which means
that
about a third of the fund may be wasted in trading losses within a year (1-(1-0.18%)252=36.5%).
The
re-indexing problem of leveraged ETFs stems from the arithmetic effect
of volatility of the underlying index. Take, for example, an index that
begins
at 100 and a 2X fund based on that index that also starts at
100. In a first trading period (for example, a day), the index rises 10%
to 110. The 2X fund
will then rise 20% to 120. The index then drops
back to 100 (a drop of 9.09%), so that it is now even. The drop in the
2X fund will be 18.18% (2*9.09).
But 18.18% of 120 is 21.82. This
puts the value of the 2X fund at 98.18. Even though the index is
unchanged after two trading periods, an investor in
the 2X fund
would have lost 1.82%. This decline in value can be even greater for
inverse funds (leveraged funds with negative multipliers such
as -1,
-2, or -3). It always occurs when the change in value of the underlying
index changes direction. And the decay in value increases with
volatility
of the underlying index.
Lots of people incorrectly state that the actual split is bearish. But that’s not true. As explained it is a factor, and it is planned so it is based on historical information and decay, not on future indications. You can’t make same assumptions on levered ETF you do with a single stock. I see this misunderstanding constantly on ST.
They did it a few years ago. It give the stock more room to go lower.
Yeah, the reaction by gold and the dollar last night is telling, I’d say. Dollar couldn’t hold the initial spike and now appears that it may be breaking down again. And gold broke above the trendline running down from the late June high and is backtesting it now intraday (roughly).
Real nice discussion of bottoms Alex. It also demonstrates how difficult it is to prudently get and hold a sizable position at a low like this; especially for a countertrend move.
And today is looking like a gift for those that had no position in Miners, since many miners are pulling back lightly.
Better known as degradation.
Thinking Energy stocks might be a good investment now. Who does everyone like?
Here’s my prediction(refresh) from a 8-3-15. We are at the low price point now.
I havent really looked into it lately, but I probably would look back at the ones that ran well last time and see if they still have their stuff. I would probably avoid the ones that didnt do well.
I seem to Remember 1 of the last ones above its 50sma was REXX
ERN (170%), GURE (128%), and REXX (123%) had the biggest runs up last time. All started around 12-17-14
And ERN & GURE bottomed long before the rest. They aren’t exacting flying higher, but they actually bottomed weeks ago
nice bill thanx-
…i remember exxi like doubled in february… too .. i think it was exxi… hmm
EXXI – good r/r here.
stop under $1.6
(refresh – 4h chart)
Well, 122% anyway. for EXXI
Add ZBB to the list
CF do you think the ones that ran up the most before will do it again, or are the ones that suffered the most more likely to bounce the most?
…
Welcome here Bear-Trap.
You are by Gary also?
Nice to see you.
Hi Geurt,
yes. I’m on his page also.
You have nice “chart communities” in the USA…
🙂
Looking to buy miners, NUGT at the 20SMA on the hourly chart.
we missed you yesterday Bill, glad all is ok
Thanks CF, little 2 day vacation in Chicago!
GDX – $14.1 re-test today?
$14.4 seems to be the line in the sand for now :)-
Guys why do you wait energy stocks to rally when oil is falling like a stone?
Hello B.T. – That is a good question.
It seems like the move down in OIL could be almost done, energy stocks are not dropping as oil drops, and they usually turn higher first.
If you use a 10sma ( simple moving average) and then pull up a chart of TEX, CRK, REXX, LGCY, ARP, VOC, AXAS etc – they look like they are already bottoming and starting to move higher.
I think one would need to be selective / careful, but I think OIL moves higher soon too.
Double bottom – we’re almost there.
(energy stocks are starting to reverse, and anticipate the DB)
Hi A.,
OK thank you. It looks a neverending fall now with a new low today.
I didn’t check energy stocks.
Yes, Oil is still falling & at new lows, but it is also in a squeeze pattern & resting on its bollinger Bands on the weekly chart ( shown in the report above). I expect that selling will end soon and we’ll see another reversal like we saw yesterday.
With oil selling, it would be wise to wait for improvement, but again , I do see improvement a lot in separate Energy stocks even with oil down, so I look at that as predicting Oil will turn higher too soon.
I went long WTI late afternoon. Looking for today to be the stop run under lows from Friday and based on China headline news. Stop is pennies under today’s low. Of oil is down tomorrow I’ll cut and re-assess. But if it’s not… 🙂
I am expecting oil to stop falling at $42. So, I am asking opinions on which energy stocks to buy. So I am ready to buy when OIL hits a double bottom.
Hi Bill,
I recommend that you Buy TEX yesterday, Ok 🙂
Thanks! 🙂
Thanx Bill
CDE might be at a good entry point here. Just heads up.
Why do you like CDE here?
you can wait for 10MA.
like the r/r at these prices (low $3)
positive MACD
again. tight stop. starter position.
(refresh)
CDE hour downtrend broken too 🙂
(refresh)
Nice, thanks……
GDX red to green would be nice by eod
GDXJ HUI & SIL are so far ; )
Nice breakout of BULL flag on /GC.
bought CDE at these prices, stop at low of day
GREEN !
cup & handles formed in GDXJ/GDX .. maybe breakout by eod for you
SA- turned out to be a true champion off the bottom. Many of the SILVER stocks are looking very good too .
beautiful.
hitting its 50ma. wait for pullback
Physical Silver closed at highs of the day also!
CDE is doing it (at VWAP).
update of your favorite miners. (refresh).
A++ for SA
F- for CDE
What software did you use to look at that sector LeCheiffre?
simple stockcharts. (the paid version)
CDE was up 20% yesterday. BTD!
LGCY missed earnings by 400% and still moving up? SD surpassed earnings by 57% and is hardly moving. Strange days
I saw this flag forming in XCEL a few weeks ago. I bought on the break out and got stopped out. Now look at it? Just can’t get the right timing. Before and after.
Alex.. rising wedge in GDXJ for last 3 days.. can they be a bullish pattern in an uptrend, or should we expect some pullback here?
And this is why I haven’t been long NAZ or S&P. Getting whiplash!