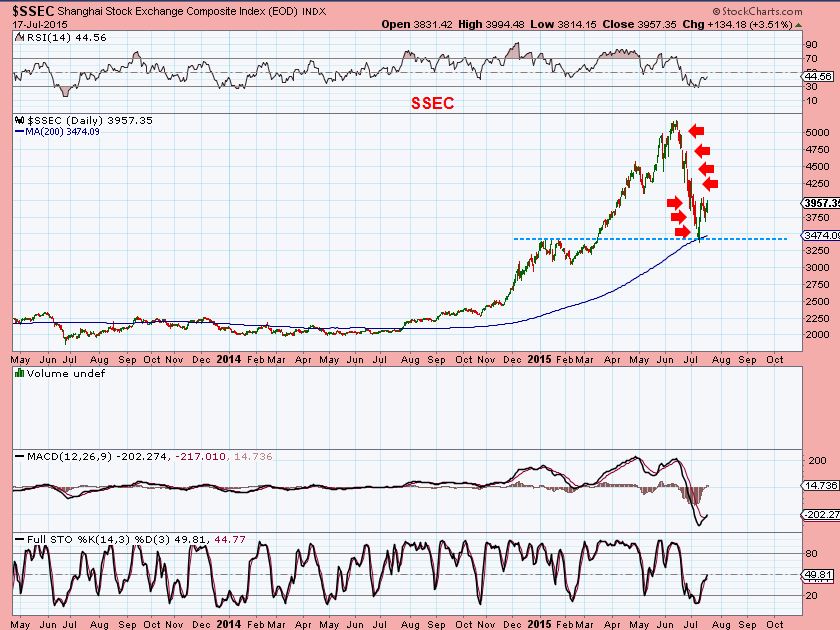
Seems that lately we’ve been hearing a lot about “Drops” in the markets. Remember when CNBC was reporting that Shanghais drop may never end until it hits the lows again? Its collapsing! All drops end, and this one looked like it may just return to the break out.
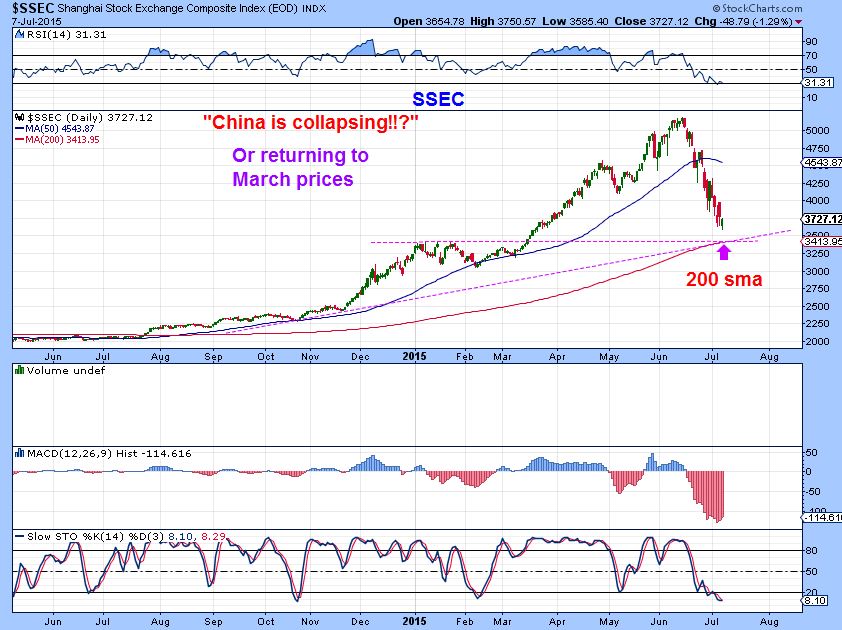
It did..
And the stock market itself just had a drop, blaming the concerns of China, Greece , etc as the problem. Lets discuss these drops since GOLD / MINERS starting dropping rather rapidly last week too. Will it end? Of course. Where and when ?? Lets discuss drops …
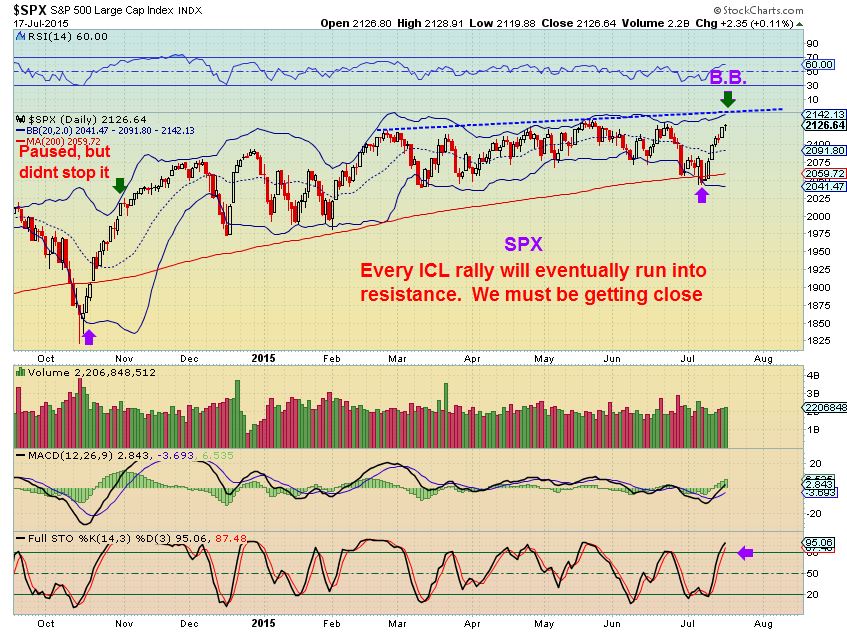
The DROP in the general markets stopped, and no doubt you recall that was predicted here based on the Extreme bearish sentiment, Put / Call Ratio,etc. These extremes lead to trade-able lows, and we learn from them. Look at the rally that followed the recent sell off in the stock market.
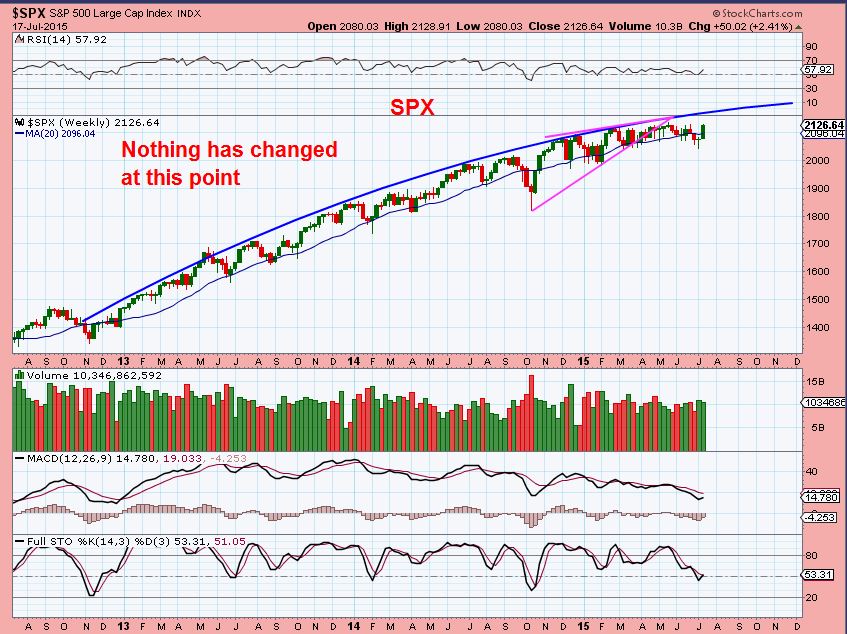
SPX– Nice rally out of the lows. It could pause / go sideways soon as it is approaching it’s highs and B.B.
SPX WKLY
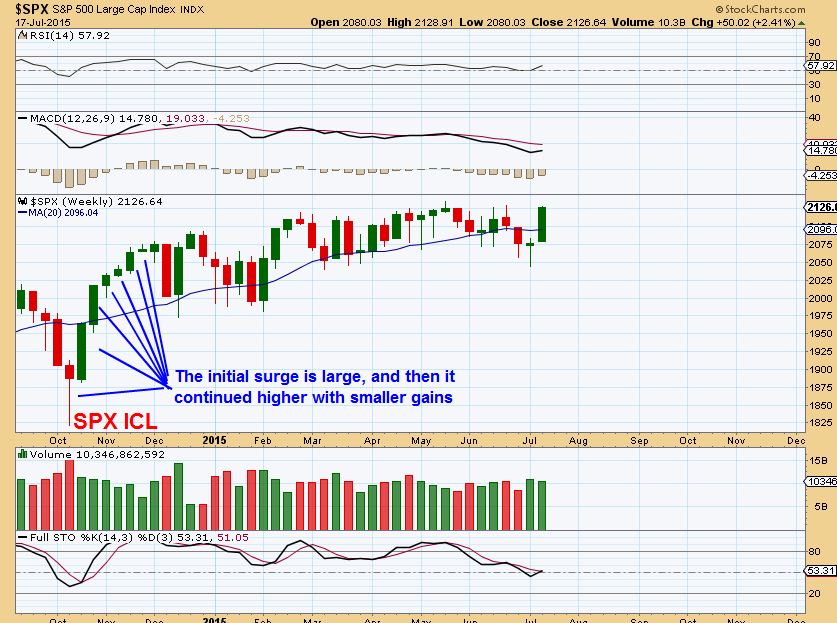
As a reminder: I do think we just saw an ICL, so I would expect the markets to look good for a few weeks. However, this is what I am still watching . I have been wondering if we are seeing a topping process in the markets. Maybe just a 10% correction is needed? I have pointed out the wedge pattern and this arc for weeks, so I will show that it I still currently in tact.
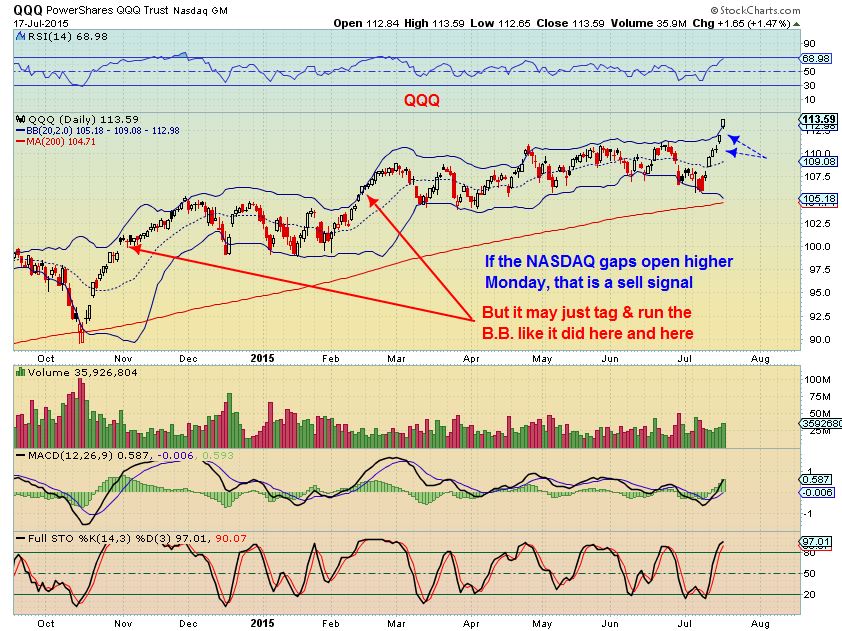
QQQ– If we gap open Monday ( higher) that is actually an exhaustion move that is a sell signal, a 3 gap play. ESPECIALLY if it gaps open and reverses lower. That doesnt mean its a ‘short’ candidate, it may drop & just go sideways.
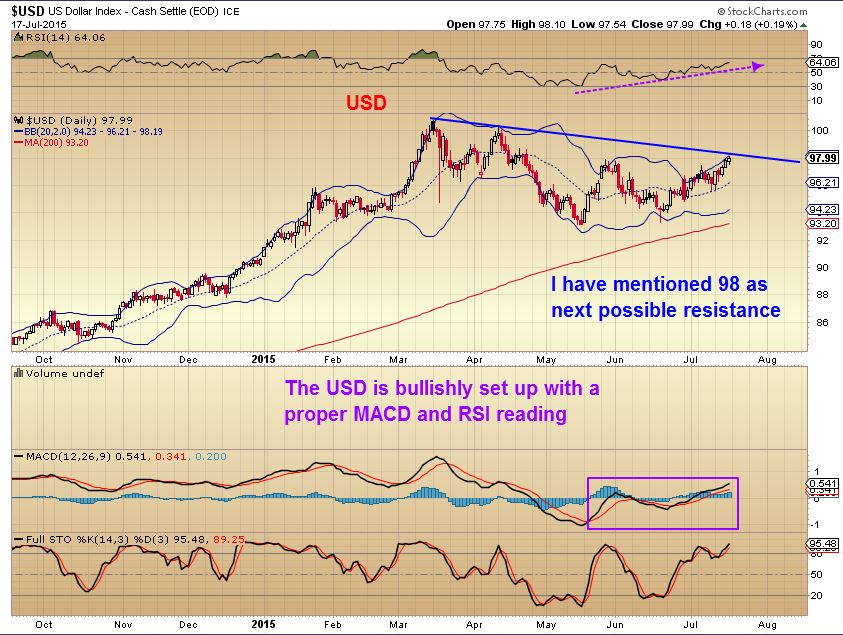
USD – here is 1 of my charts expecting $98
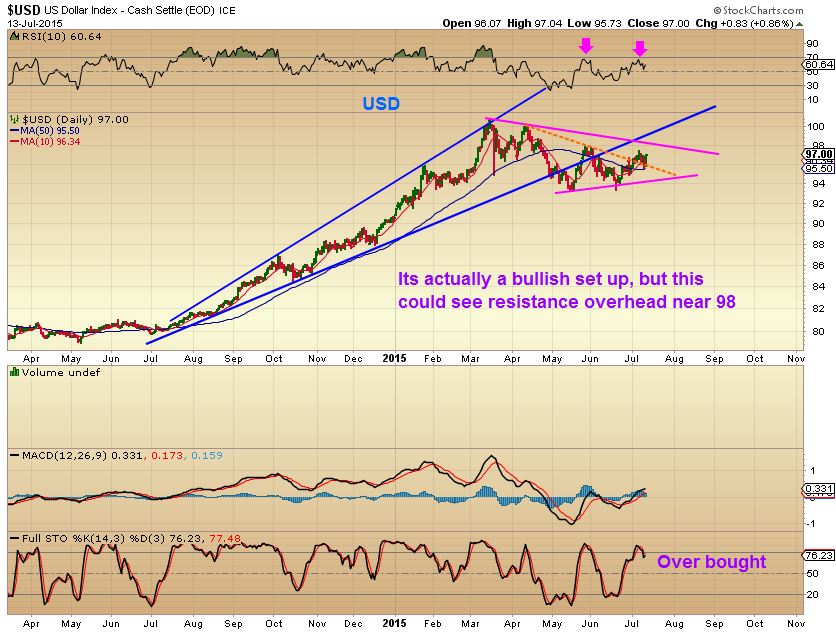
USD – we are in that area now. This does remain a bullish looking chart, but…
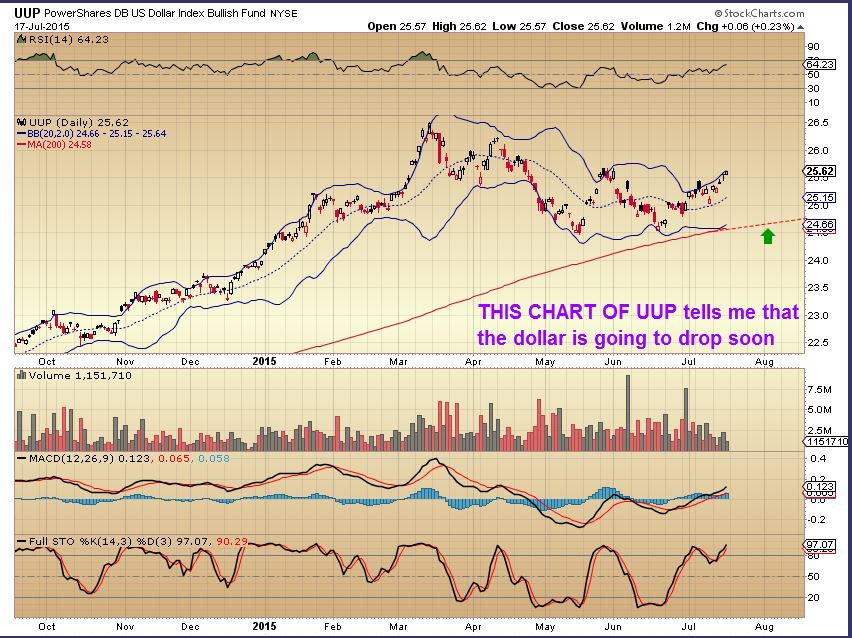
UUP – This chart says a pullback is very close. This ‘Drop” ( likely temporary ) could put the bottom in the Gold “Drop”.
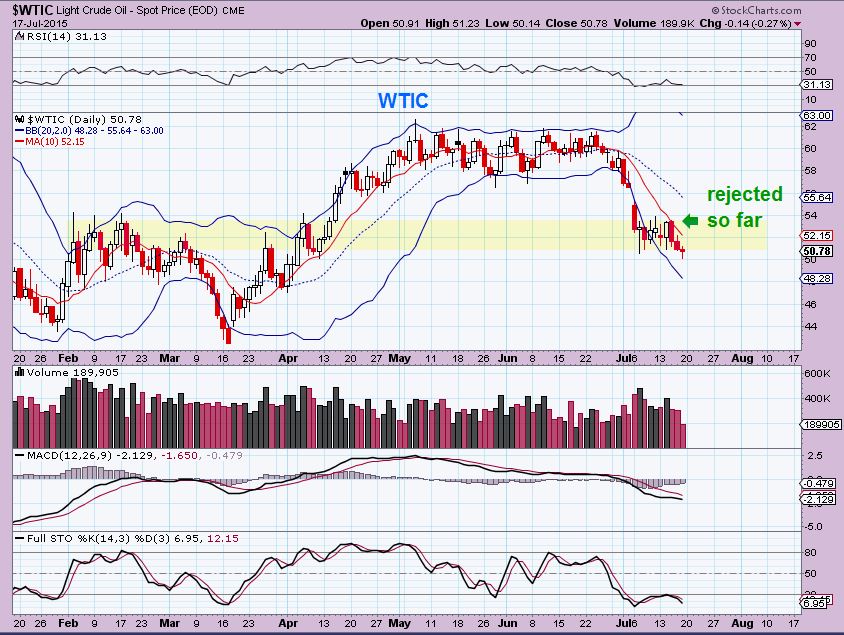
WTIC– tough one here. I was looking at OIL like it could be a bear flag. It has been rejected at the 10sma, but this looks less bearish short term. Mini reversal on light volume? Neutral & just Watching for now. I expect more downside, but it may tag the 20 or even the 50sma first , as mentioned in prior reports.
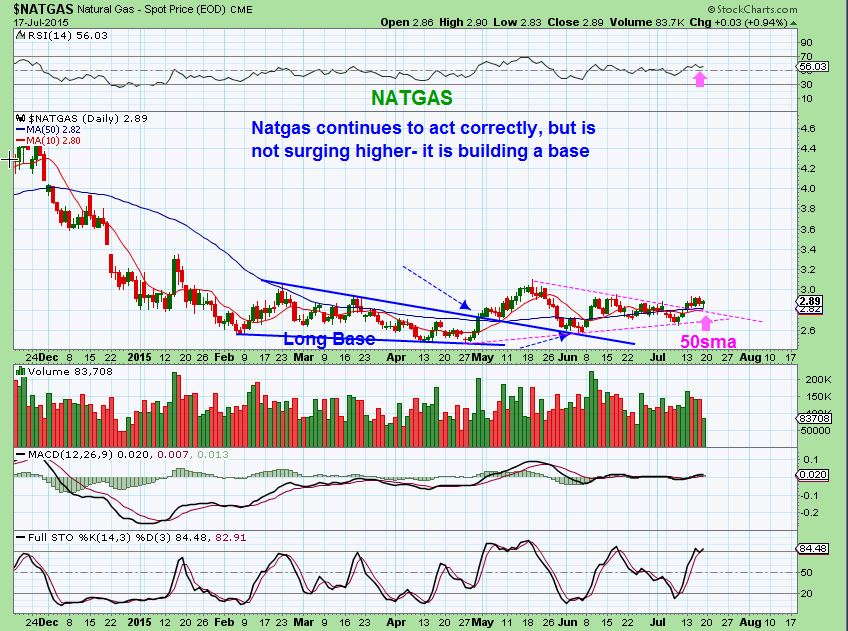
NATGAS– has looked bullish and remains bullish. Tagged the 50sma again.
GOLD SILVER, MINERS
QUICK REVIEW FROM LAST WEEKS REPORTS ( I have clipped the Wed charts & wording)
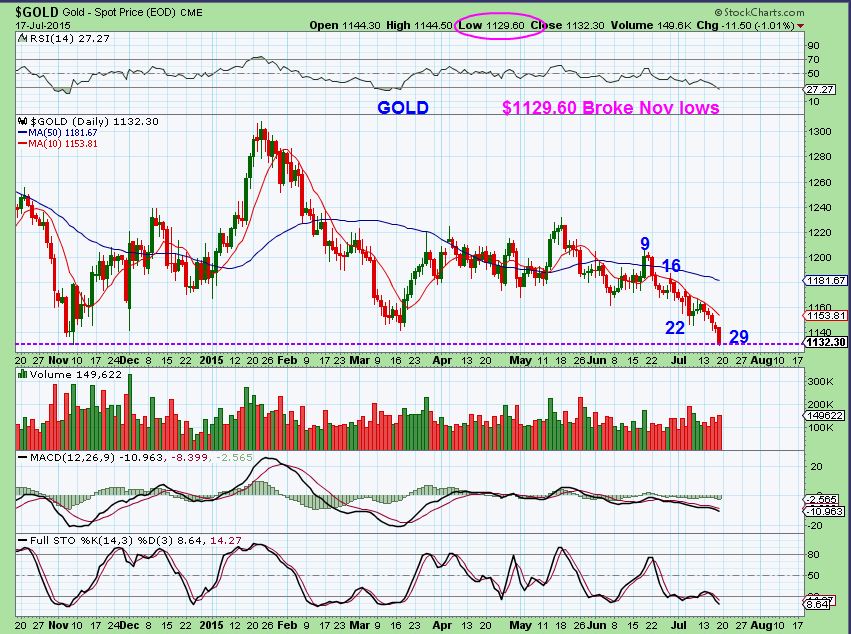
GOLD – Wed July 15 had a reversal candle, but it would be better to see a sell off and stop run below $1130.49
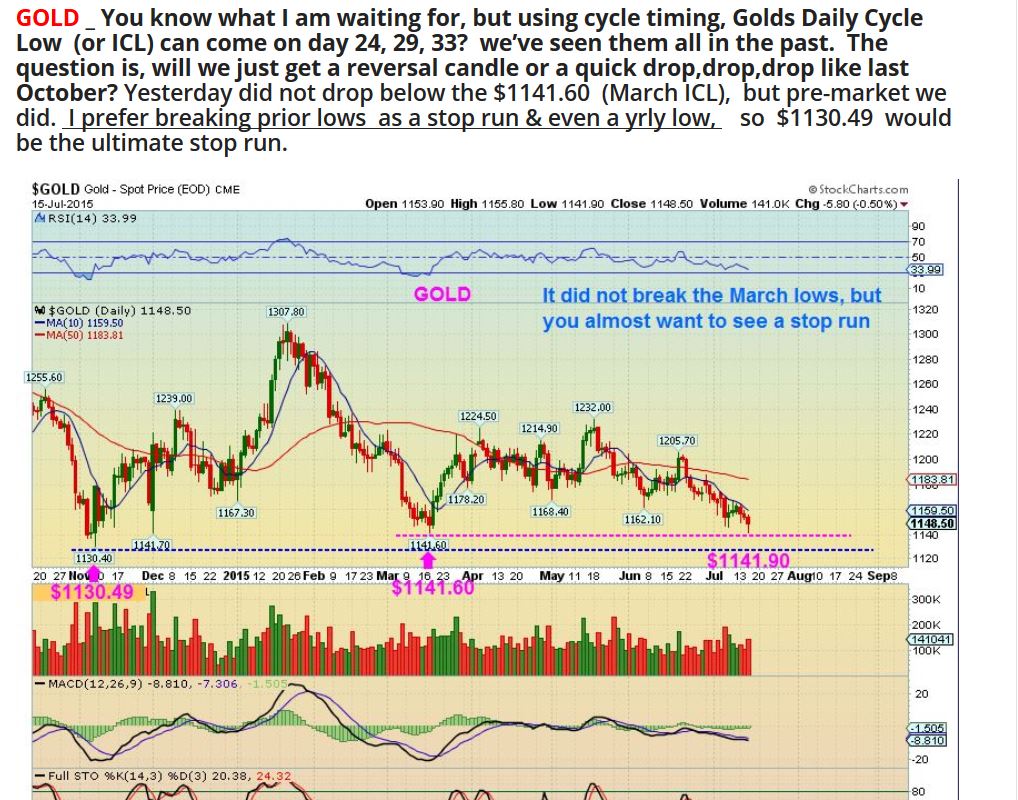
GOLD July 17– we broke down below $1130.49 & reversed higher. I would like to see More selling, to really run the stops. It was day 29, we are due for a low very soon.
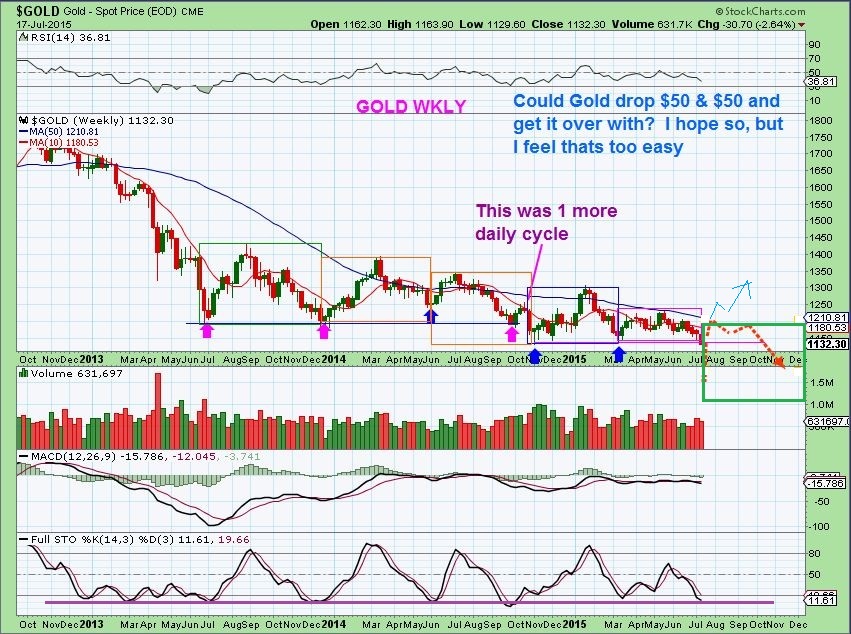
GOLD WKLY – At this point it is likely that Gold will sell off sharply and recover, and I prefer that scenario. Yes, I said I didn’t think it likely we go to under $1000 yet, with everyone saying they want to buy Gold down at $1000, but I wish it would drop fast and get it over with honestly. I wouldnt even mind saying , ” I was wrong, we hit under $1000 and reversed”, because the Buying opportunity on that reversal could be Huge!
1. Fast drop now to below $1000 ? ( Still what everyone expects, so I would be surprised)
2. We just drop a more this week & reverse above $1100 and rally? I think this likely happens this week.
3. We bounce here and have 1 more daily cycle, a 4th ( I dont think so, we are seeing extremes in this “Drop”. I expect a more durable rally when it ends).
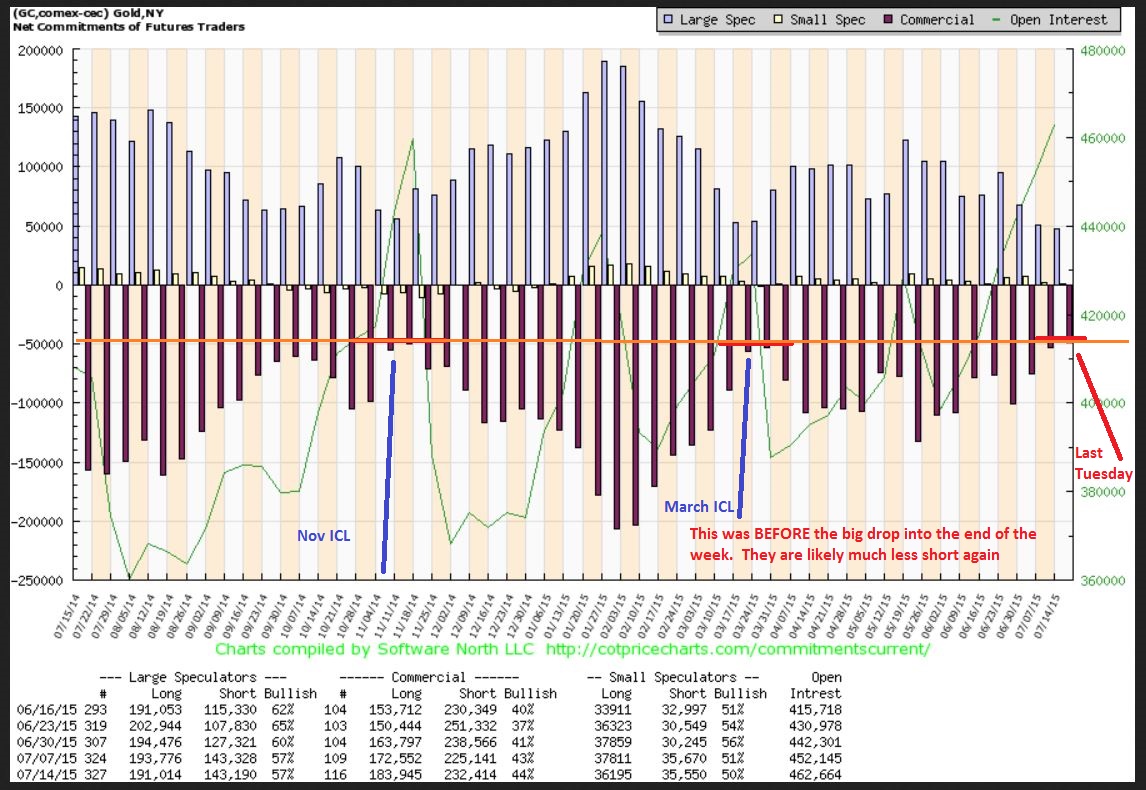
C.O.T. – this was as of last Tuesday and it already reads at levels where prior ICL’s took place. After the selling at the end of last week, this is even going to be lower now. This isnt a perfect “timing” tool, but it shows that SMART MONEY expects a Gold rally soon.
Miners –
GDX from the Wednesday chart (wkly). Pointing out that we broke down in OCT below prior lows, and the RSI & Stochastics and a few other things looked similar. THAT break down in OCT could be what we see now, into an ICL.
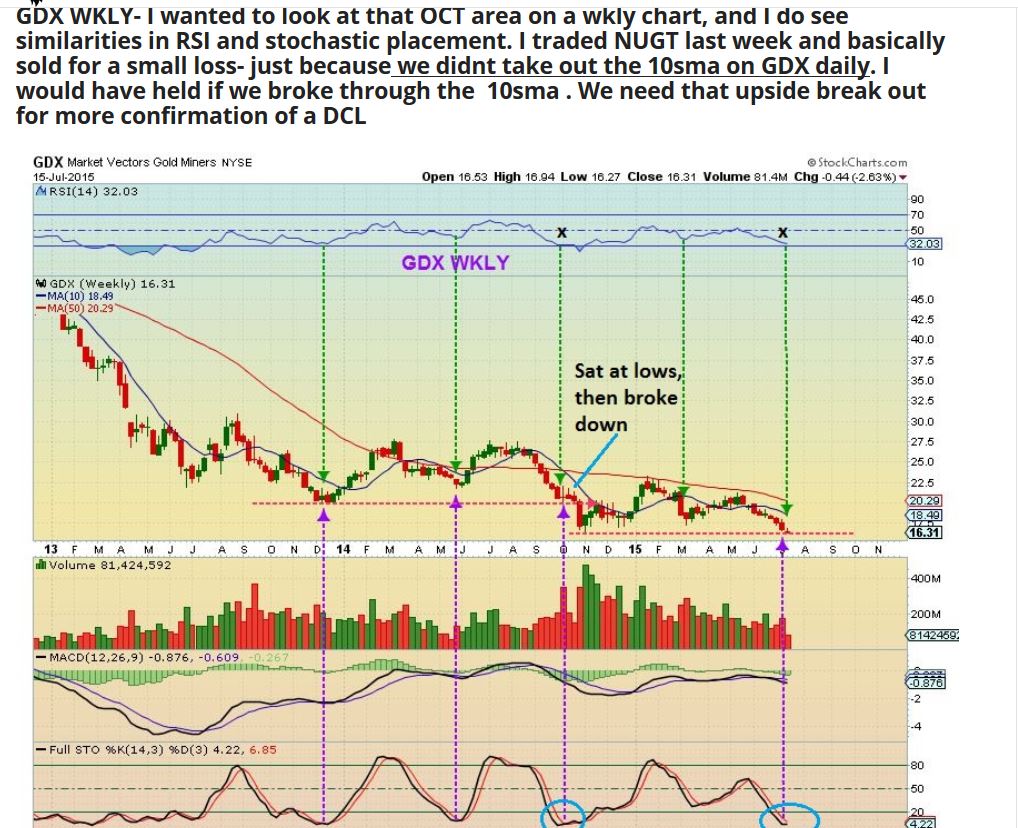
Notice that the break of those lows in October didn’t lead to a waterfall sell for many weeks. It was a flash drop & recover . That Break down was 1 strong week down, and the next week went lower and reversed.
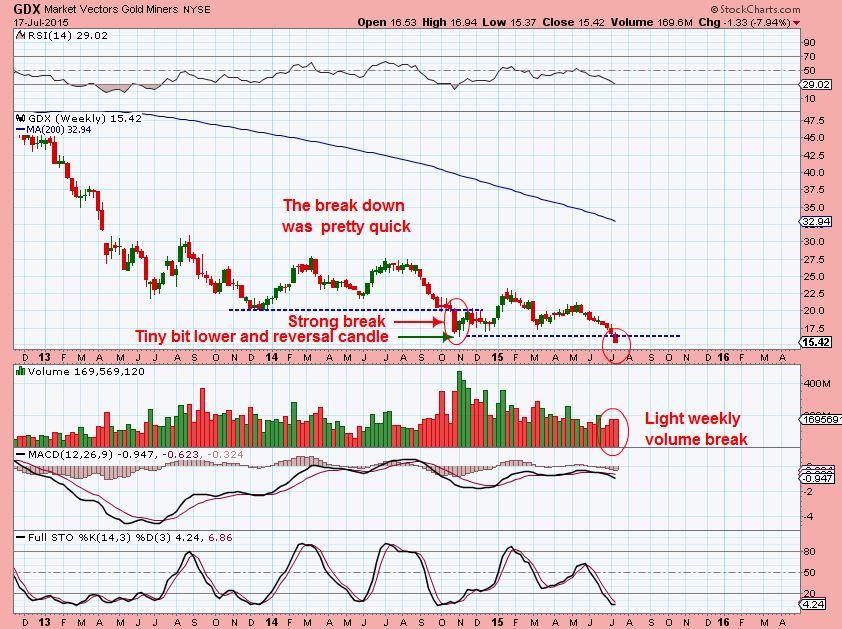
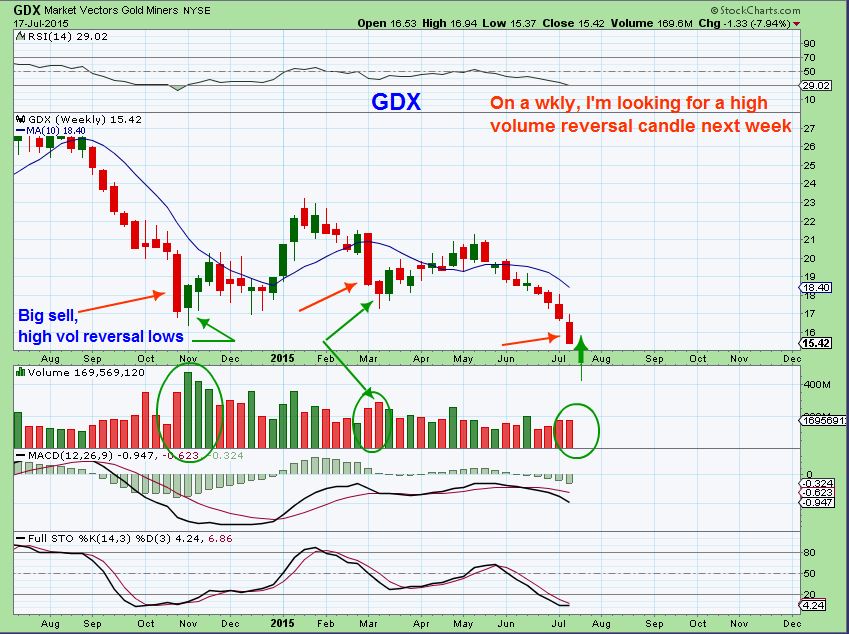
I would expect a reversal in Miners this week, similar to the where Green arrows are pointing out. I’d like to see Miners start the week selling off, and then reverse.
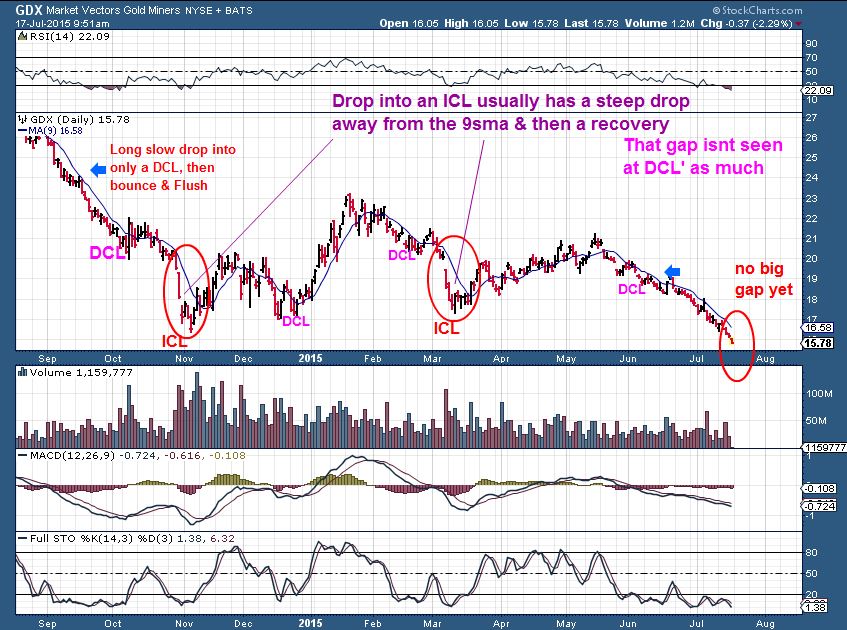
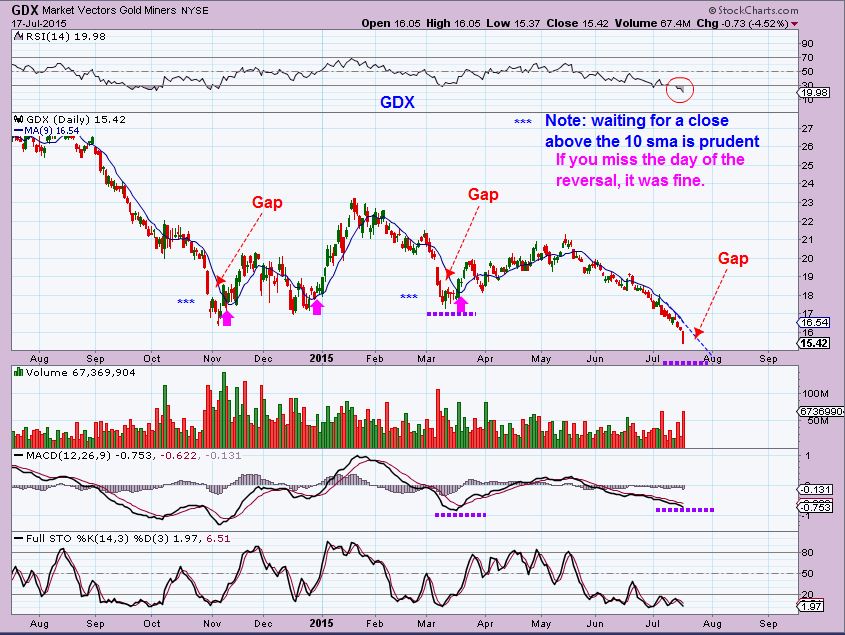
In my Friday morning update I pointed out that we werent seeing the “Gap” that usually occurs between price and the 9 or 10sma. I had clipped this chart to show the gap I am looking for. The time of this chart was 9:51 a.m., seen in the upper left corner.
20 minutes later the gap was appearing, the selling was accelerating.
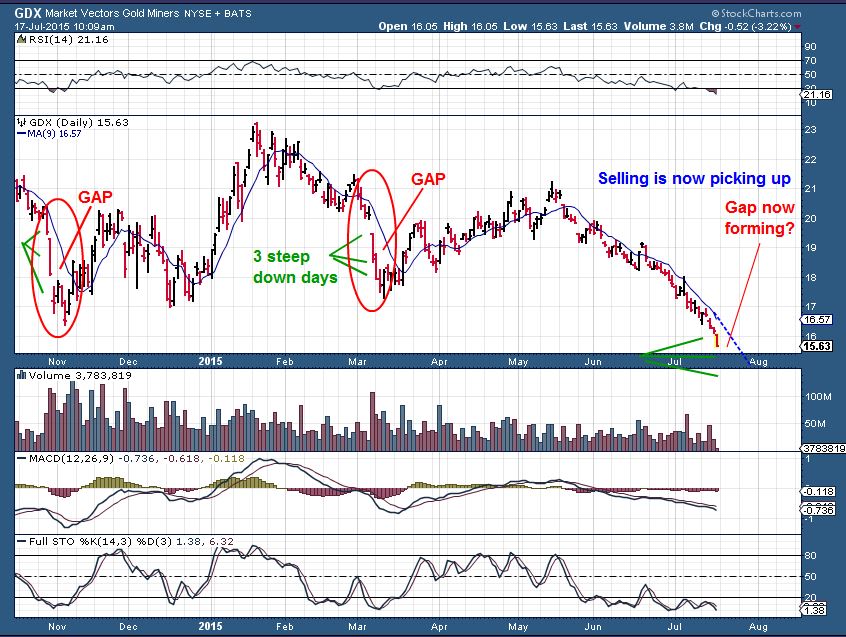
GDX by the end of the day- see the gap we now have between the 9sma and the price. We accelerated in selling. I see this at ICL’s, but DCL’s are usually not so dramatic.So I think we are seeing an ICL.
I had a few more observations, but this is sufficient for now. It is 10:30 Eastern time and I want to release this now. Tomorrow will say a lot and I want to release this Sunday night so that there is more time to read it in the morning or for late night readers and friends in other countries / time zones. To wrap up the precious metals section, I am seeing signs that we are nearing a low. A good trade able one is what is most likely, the ICL, not the DCL. Time will make that clearer, but the C.O.T. reports, Extreme sentiment charts, the acceleration in GDX opening that gap between price and the 9sma, and more shows a good buying opportunity is rapidly approaching.
I tried to show in the last chart of GDX that the reversal often happens and the a low is put in with a few days of up & down to shake out weak hands. Buying above the 9sma is a bit easier, to ensure you havent bought a reversal that then breaks to a lower low & stops you out.
WHOA!!! As I was writing GOLD dropped $50+ and hit $1080, and reversed higher, now down only $25. They broke the $1100 round number and bought it back. This chart was just captured at 10:45 Eastern time. This may just run higher and leave us all behind and crush those who chose to hold their shorts over the weekend ( Dust or JDST), or we may just bounce and then keep capitulating lower. This should be interesting!
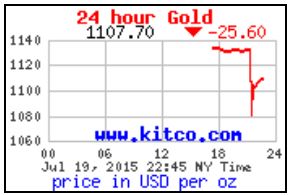
We’ll have to see how this plays out overnight, it is more volatile than expected, but you may have just seen the lows at $1080. Time will tell. Tomorrow could get very exciting in the precious Metals market 🙂
~ALEX
Melting Gold 
 RISK
RISK
Scroll to top
How to play the long side if at all one decides to catch the falling knife?
I wont usually give advice on that…it scares me to steer someone into a dangerous trade . I will mention how I would look at it.
My only advice is to remember that we dropped $50 tonight, and gold “Could” just drop $50 today , $50 Tuesday, and $50 Wednesday and how would that feel holding a position ?
So with that in mind, if one wanted to catch the falling knife expecting a reversal soon enough, my advice…
Start very small / No leverage. Only Add leverage above the 10sma later, raise stops, keep an eye on it, etc etc etc 🙂 .
On second thought, refresh and stare at this chart before catching a low . (Ignore the writing) , just picture it happening 🙂
.
Ooooo…We like exciting. ..tx CF 😉
Well, tonight was pretty exciting huh? :+)
I can picture many things now…Gold down $100 in the a.m. Or Gold up $100 in the Morning and no one can buy.
Why? because shorts cover & it rallies off the lows too fast. Ouch, my worst case scenario.
Welllll..for every 1 there’s a 2..every 3 there’s a four. ..and so on it goes…:-) TAAT
impulse, correction, impulse, correction………………………… in case u didnt follow & think im crazy ….
TAAT: There’s always another trade ;o)
Going to be interesting in metals today. Was the low put in overnight in Asian trading and we’re moving up or just bear flagging for the next drop? Stay tuned!
I have had this chart, with these trend lines for a while. Can’t believe we tagged the lower line overnight? Wow, what moves.
Is this the final flush?
TRQ – Seriously??? Couldnt even fill the gap on a day like this???
I posted a few charts of DUST (refresh) along the way, I got the everything right, and didn’t stay with the trade. Damn. There is a seriosuly parabolic blastoff going on. This doesn’t usually end well. I suspect we are very close to a good entry in NUGT. Harmonic patterns tend to reverse at 88.6% and we are higher than that right now! Close to a double top.
Alex, Head and Shoulder patterns on Gold and GDX. Wouldn’t this mean that GDX would go to as low as $11? I believe the H&S pattern from the high to the neckline is duplicated from the neckline to the low. GDX went from high of $23-$17=$6 at the neckline. So, another $6 decline gets us to $11. Very round numbers.
Only in proper H&S patterns do the targets play out in my opinion.
I dont believe it is a proper H&S pattern, like the one we had in 2013. No matter which shoulder you use, it ddnt come close to down side targets. Refresh for a chart
SLV went green, so far a nice double bottom on that extremely high bottom low and test today on much less
That’s a good sign. Do you think that’s it?
Too early to say, it may signal that SILVER wants to bottom first. Check out LSG, RBY , SLV, VGZ, TRQ – they seem to be finding buyers, but its not a “proper buy” at this point.
A proper buy for GDX / GDXJ etc would be buying a swing low the next day or a move above the 10sma.
With GOLD dropping over $50 last night and seeing RBY, LSG, etc …its encouraging though.
so hard not to buy EXK (Double Bottom , out of BB…)
Especially when Silver keeps going green .
man…. I’ve almost bought it 5 times in the last hour…
LOL
same for AKG… self control
breathe danielson …
AKG chart…. outside BB always strikes back like a rubber band.
will it this time?
Needless to say my calls on ABX and GDJX from thursday and Friday are doing just fine…..
GDX does have 43 million about 1/2 way through the day (plus you know how they always add a ton on at the n=end of the day) we will likely have 100 million by days end. That does indicate the capitulation is upon us.
this ICL was long awaited…
u can say that again….. some may have cheated… [to the spankin machine for THEM]
When are you getting in? Waiting for buying to begin? I did start a position.
Sorry, I went away for a bit. Busy busy screens today 🙂
I am watching prior drops like this as shown in my GDX chart showing the gap between price & the 9sma.
I see the drop in OCT as similar as far as the strong drop, then the gap down and drop …
I am just gauging things by comparison, but I do have a strong buy signal in GDX (its just an extreme measure of oversold that usually snaps back that day or the next day, but I’m watching for a reversal for now)
When looking at NUGT, highest volume day ever. Much less volume than in October? If its like October, we should have one more gap down open before we find a bottom. Now the danger must be that miners might go out of business………….
No, I think it was more on the real selling days . – see my chart above posted for Geurt. Look at when the real selling started (like OCT 30 or so). The volume increases as capitulation occurs near a low. I think we are at that stage.
Just wanted to say hello to all on this board. I’ve been in GILD for over a week. Have a core at 113.15 and have been DT the rest. Been doing very well. Glad I got away from gold. 🙂
The weekly GILD looks like a cup break out & back test . looks good.
Thanks Alex. 🙂
Gave SSNI and UTIW a shot last week, stopped out today….very small loss. grr
Waiting to add to GDX Calls.
Starting to build a position in the VIX Nov. Calls.
Alex…. a stupid question, where do you think is a ICL? (support)
It’s a horrible day, although for me.
Thanks for help.
That is not known yet Geurt.
We are in a capitulation type selling off. I do expect a snap back rally , but it cannot be known at this point where that turn will take place.
GDX is very oversold and cascading – it feels like the final selling stages, but these things need to reverse first .
THANKS.
Trust…. you let us know Alex, when you see the sky ‘blue’ again.
See chart above
Gold? Miners? Silver? they are all different right now.
Geurt…use this chart (refresh) as an example…this is how I watch the sell off into ICL. They are very similar (Scary & seem like they will never stop)
.
Thanks a lot Alex, I think there is not a whole lot downside?
Probably an 0.50 ct.? Don’t take me wrong, but so (I think) I see it in this chart.
Very hard to say. Looking at Oct -Nov gap & sell and March Gap & sell, they look similar. Could even gap lower tomorrow and then reverse. I cant know at this point.
Alex, How does GALE look to you? Holding on the 50 and 10
Looks good , the 50sma is holding & volume is pretty light selling. I cant be sure that it isnt going to try to “test” the recent break above that trend line though (looks like connecting the June 8 and June 23 highs)
That would be very bad.
Probably not going to happen as long as that 50sma holds. Slight chance, not a good chance that it would
GDX Eod sell off is impressive
look at the L2
yes, holders are bailing out.
w .. o .. w…………….. grrrrrrrrrr [me kicking the dirt] i hate missing those double digit days daddddy
so not fair…………………………………………………………………
yep. I enjoy the day with my gDXJ calls 🙂
;o)
WHAT – IN – THE – WORLD just happened to GSS??
Do you owe it ALEX?
I have some stock of GSC (GSS in the US)
I do , but I was close to letting it go , it was getting near my original buy. I should have let it go when it broke the 50sma, but I didnt. BAA took a good hit, thats another core position I own.
Might just be a bad trade at the close.
Here is my thoughts on PM’s,
Needless to say the Metals are on a BB Crash once they close Back inside I will add my 2nd tranche. My 3rd tranche will be a close above the 9 day sma (as Alex has suggested) and or on a daily buy signal. Risk reward will be Excellent!
Comments ?
I concur 🙂
🙂
Sounds good. I don’t have 1st tranche yet. Maybe lows in Pre market, early then reversal? I mean, seriously that was ridiculous.
Sounds like a reasonable plan. I am pretty much doing the same.
Not bad, 155 million volume on GDX today (refresh)
.
And again, What happened to GSS today?
down enough?
So, THAT is what capitulation looks like. Holy Crap. I have only seen NUGT down over 30% in 1 day, I can remember and that was the April 2013 breakdown (going off memory).
I saw the weekly breakdown in gold and went short into the abyss on Fri with JDST and GLD puts. I was planning on holding JDST until we saw reversal but once it was up 36% that just seemed ridiculous so I sold. That can’t keep up for long. Maybe gold does one more flush and miners start back up. Holding half of gold puts still, sold 1/2.
For anyone that likes options, DUST puts would be better than NUGT once reversal, that parabola has to come back but NUGT is essentially worthless now.
good move Cason. I agree with shorting/puts on DUST
Thanks, LeChiff – best of luck to you. Have a small basket of calls/puts planned once we sense bottom.
congrats Cason :o)
Thanks. I had a pretty solid day! Wasn’t able to pay much attention at work. Sound familiar?
lol
I dont know if my laptop is exceptional or what , but that looks 3-d high def. Maria.
I know we are a bit preoccupied with metals/miners (I sure am). So not sure if anyone saw the IMH chart I put out late last week (sorry can only post after market hours) but after low volume support test, it was up 7.7% today. Been volatile, likely to give another entry if some are looking for diversity. Looking for 23 as price target. May be higher later on, but likely to book profits once I have them.
Thats a nice looking chart, and if that move was 7% today, it looks like it could have plenty more upside.
In JNUG