
Just The Facts – 31 Charts Of Evidence
For the past few weeks I have daily been pointing out various ‘clues’ in the Precious Metals Markets indicating that a drop could lead to a nice summer rally in Gold & Miners. Is there any ‘evidence’ saying that such a rally is still ahead? Some have sent me articles ( like the one shown below) saying that Gold is just a pet rock, Gold is Doomed, Gold has no value, and will continue to drop until it gets to $600-$800. Well of course anything can happen, but in the weekend report we will look at all of the ‘evidence’ and draw our conclusions from the charts
First, a review of the various markets…
I’m going to point out the big picture view of the markets. I have many concerns that I have pointed out over time as the markets have been surging up & down. Those concerns remain and give the market an appearance of topping or being in need of a good pullback. Lets examine the evidence.
SPX – I have been showing this view for months now.
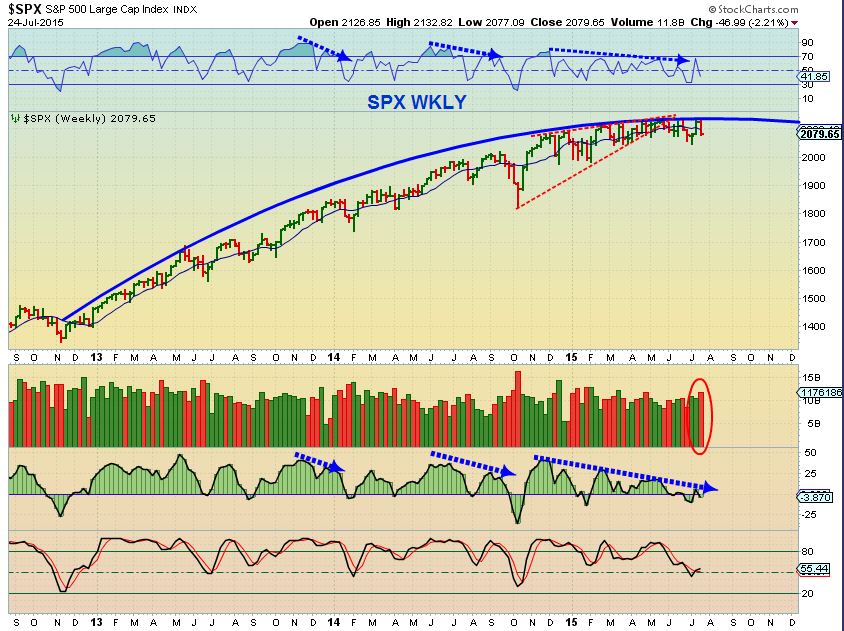
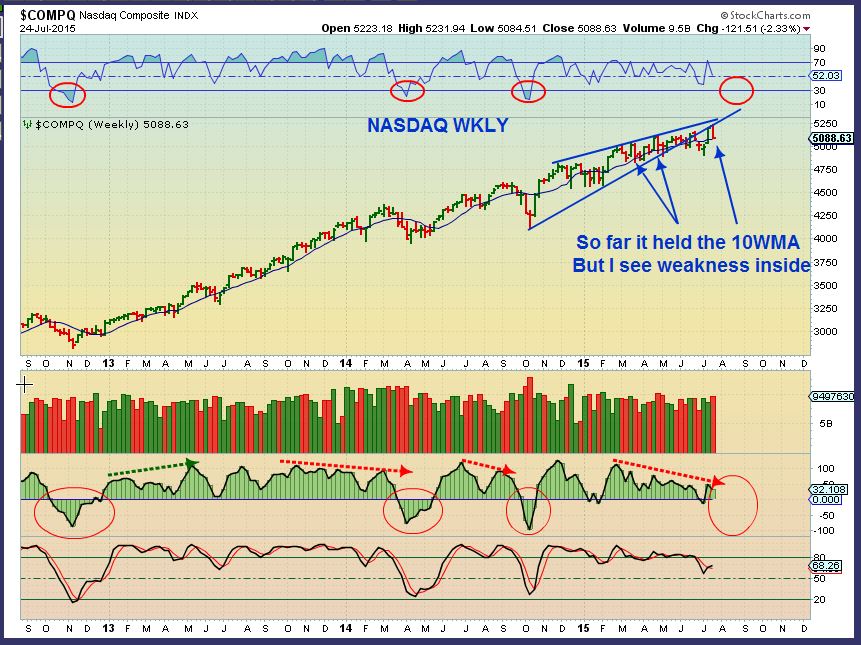
The NASDAQ surged higher to new highs. All bullish?Look at that MACD HIST.
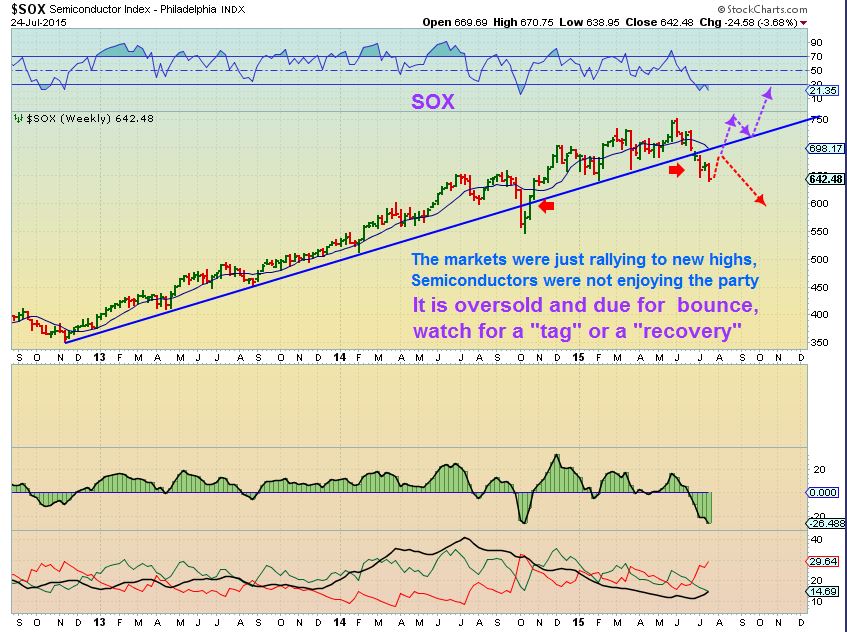
The Semi’s usually lead the markets up or down , and so far they haven’t lead the markets higher. Its a break down. From here we need to see a recovery or they are leading markets lower.
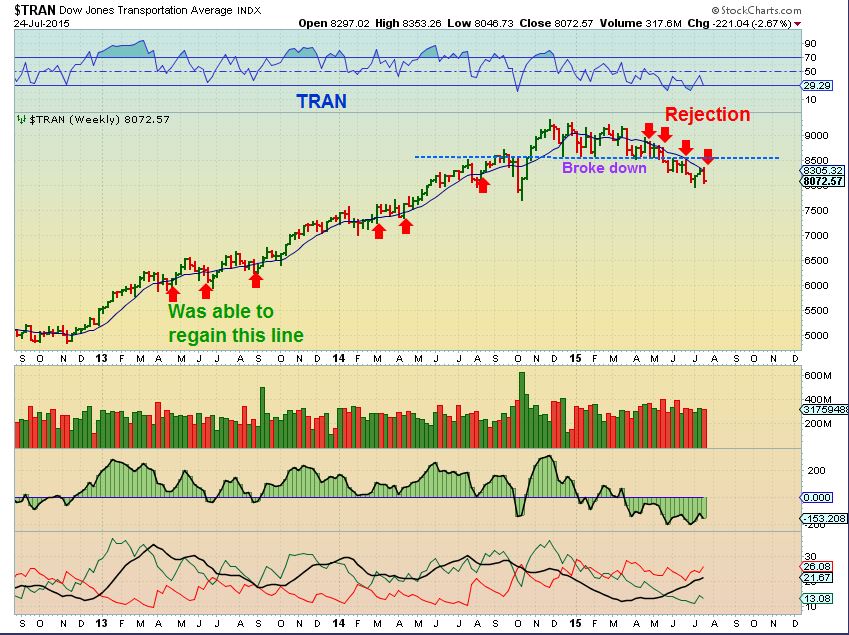
And then we have the DOW THEORY. I pointed out how badly the TRAN had broken down. Has it recovered at all with the recent market rally? This should be in the back of everyone’s mind as we go forward. The blue line is the important 10WMA, and it continues to reject price.
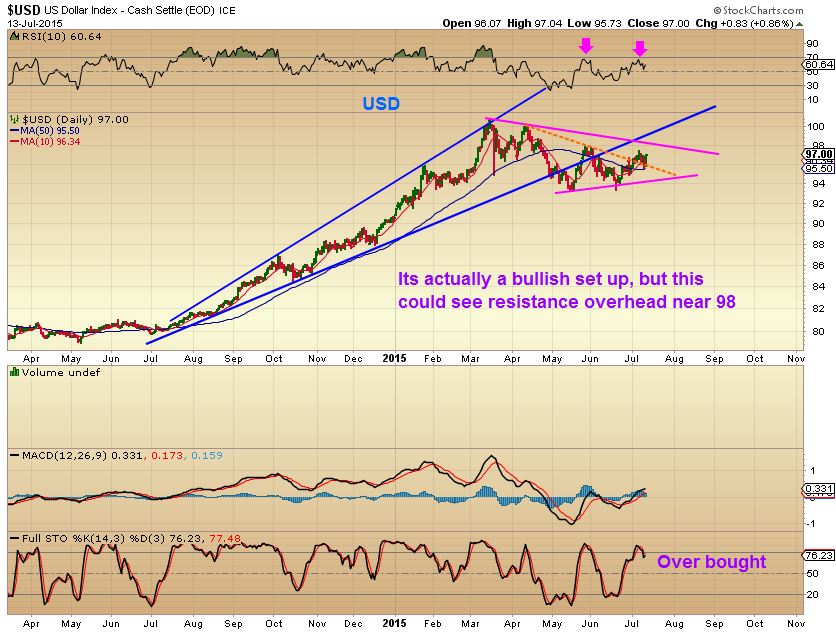
USD – Reminder: I mentioned weeks ago that my target was 98 for the dollar ( this was important, because it may allow Gold to rally if the dollar would drop). This was July 13
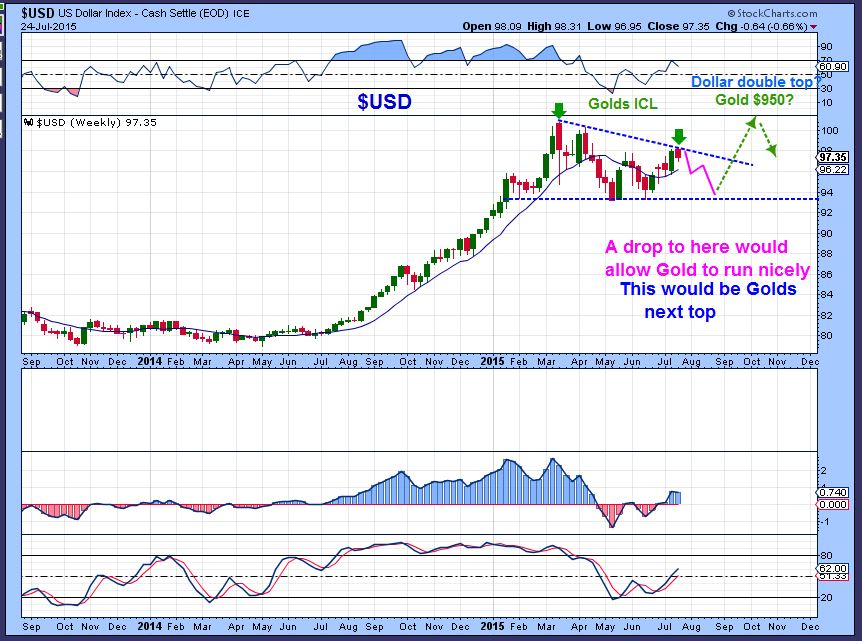
$USD– July 24 wkly. The dollar reversed at 98. If we could get this drop, it could allow Gold to rally. Notice the peak in March was Golds last ICL. The Dollar low in May for the Dollar was the peak in Gold. This looks like Gold could bottom here, more on that later.
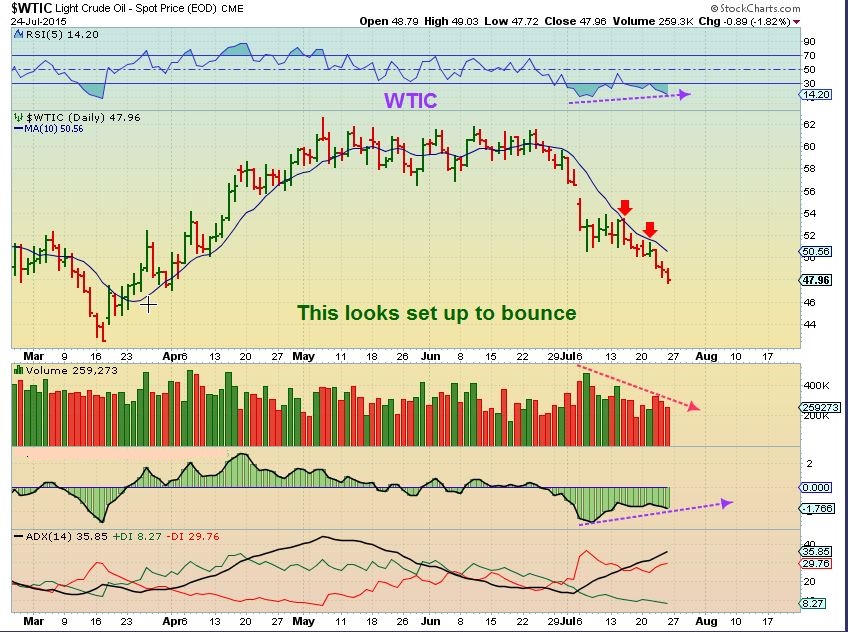
WTIC – Oil was being held back by the 10sma. A break out higher could have run up to the 50sma, but July 21 I pointed out we’d need to break this trend-line first.
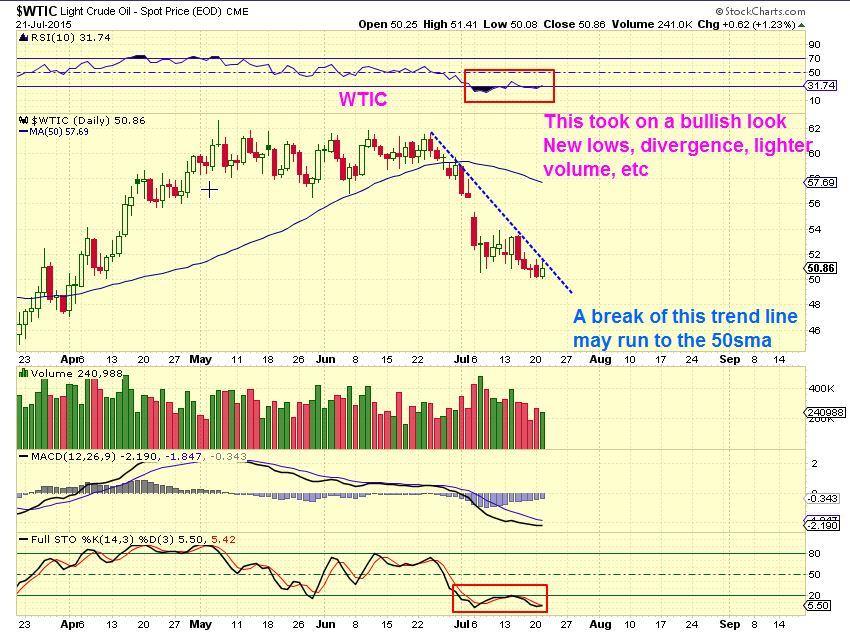
WTIC– rejected at the 10sma again, but it does look set to bounce again, maybe to that 50sma? But what else can I say about that?
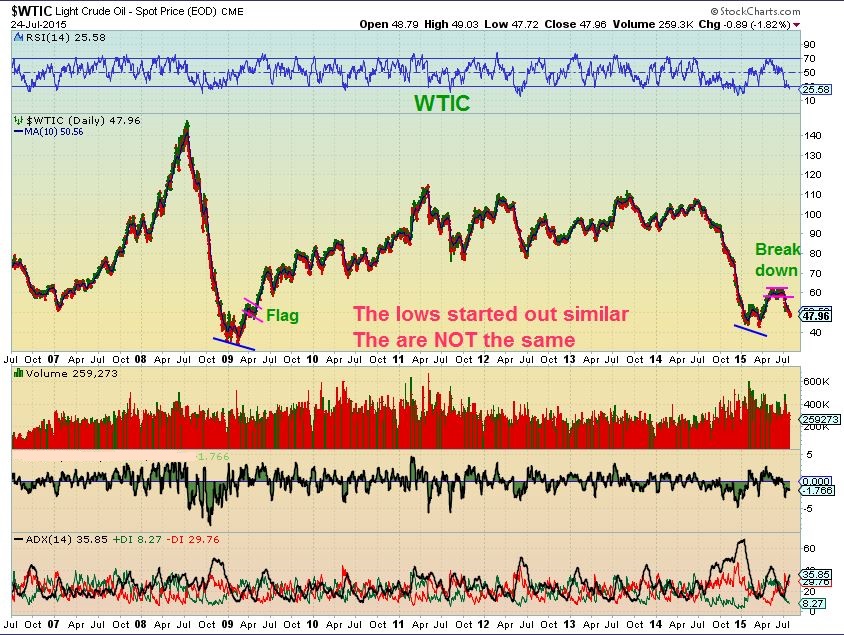
I want to point out that the 2008-9 lows 1. Ran upward 2. Bull flagged 3. Then continued higher. We are doing nothing like that here. The dollar dipping here may cause OIL to bounce and tag the 50sma, but testing the 2009 lows could be ahead. It might be a good short (DWTI) if we bounce to the 50sma and price is rejected.
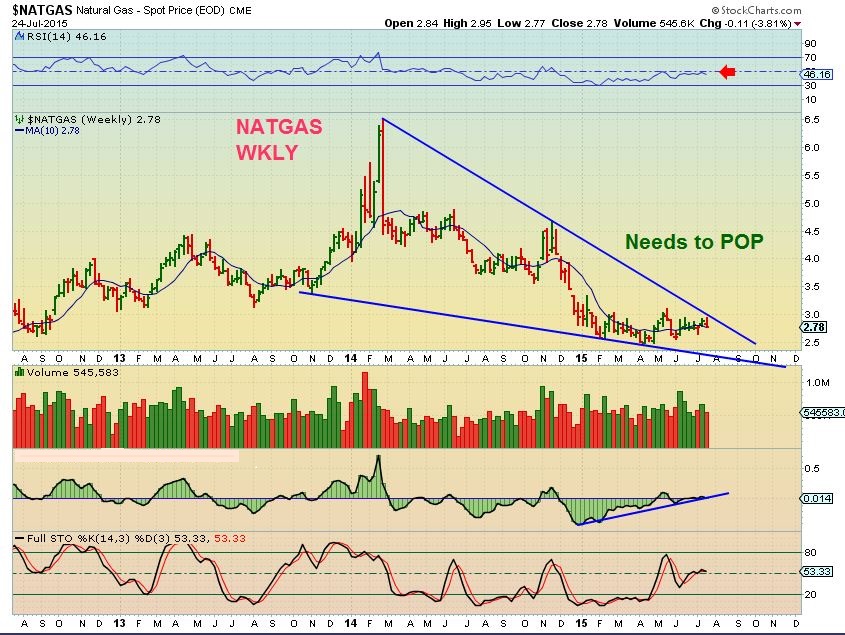
I have followed the bullish set up in NATGAS daily charts all along, but now we see the Big picture has NATGAS near resistance, and it turned down. It sits on the 10 WMA. Watch for a break out or break down from here.
Whats next?
GOLD SILVER & MINERS
Intro: My thinking is that an ICL is in place. I will show the evidence in this report, but I have pointed out all week long what to look for and it has played out pretty much exactly as mentioned. That should build confidence for all of us.
*There is an alternative scenario, I looked into it, will mention it BRIEFLY at the end. I think it’s unlikely, we will stay alert as we move forward. SO lets just get to the charts…
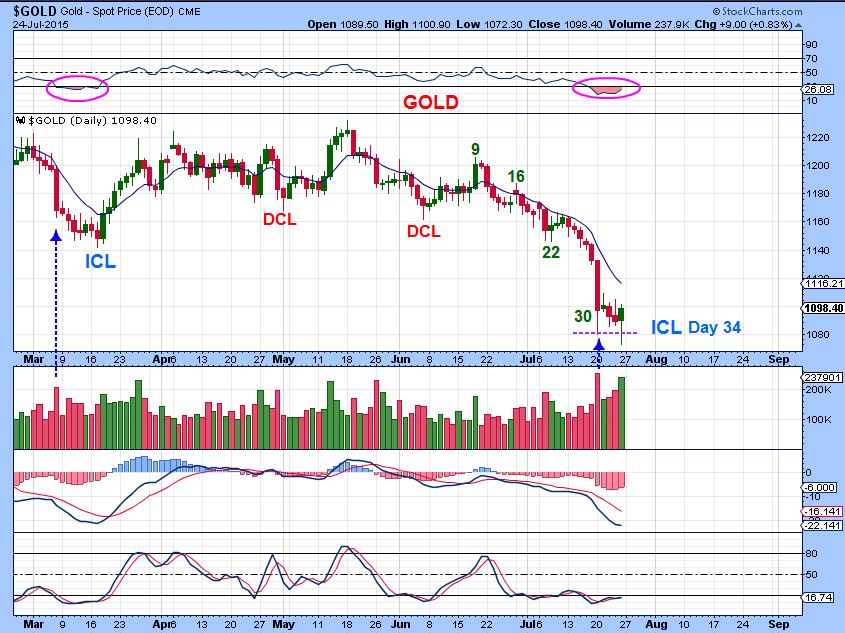
GOLD 7-21 – I said it would be better to have an undercut of recent price as in prior lows to shake out buyers.
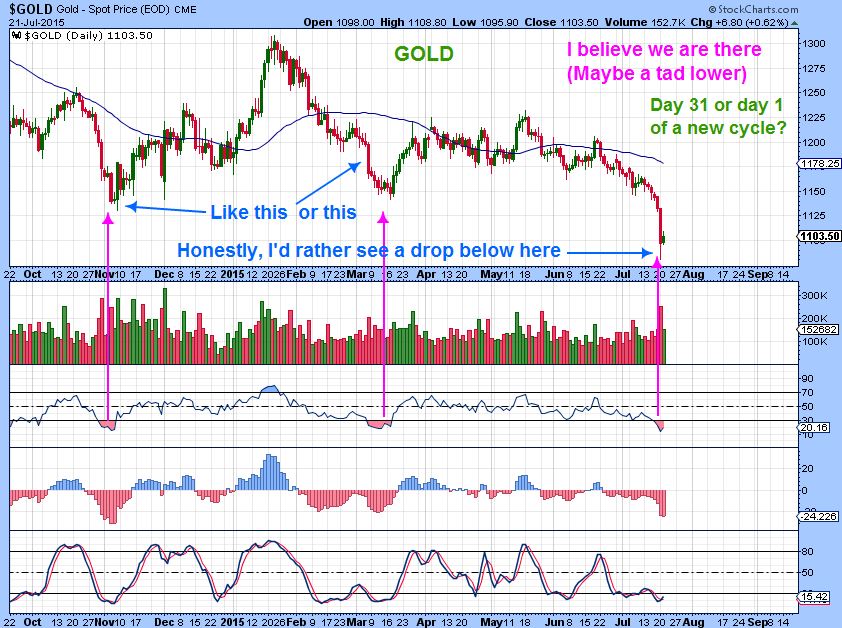
GOLD – LATE in cycle timing an undercut of the extreme volume lows, and a strong reversal amidst a lot of fear. Many of my indicators are Beyond ICL levels. Extreme bearish sentiment everywhere. I believe we saw an ICL ( Deep trade able low).
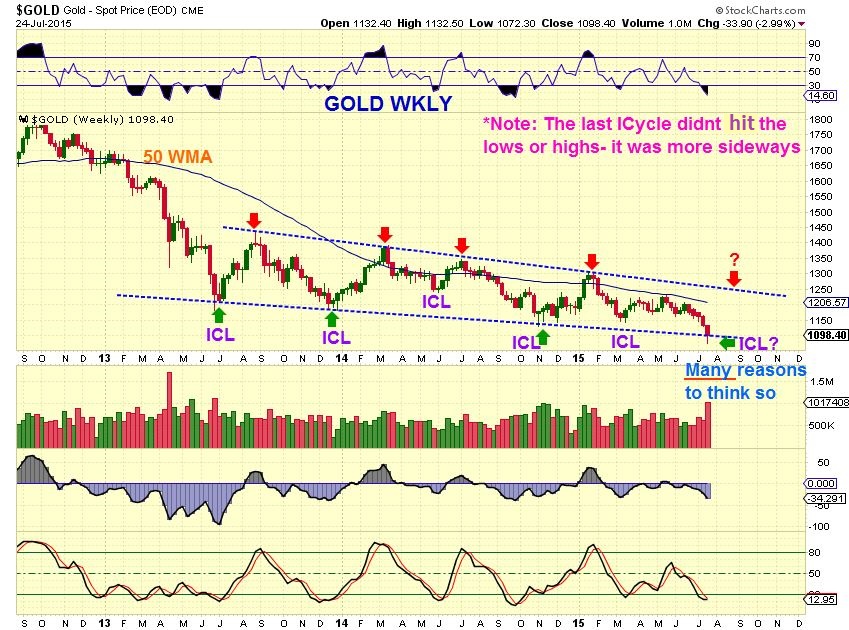
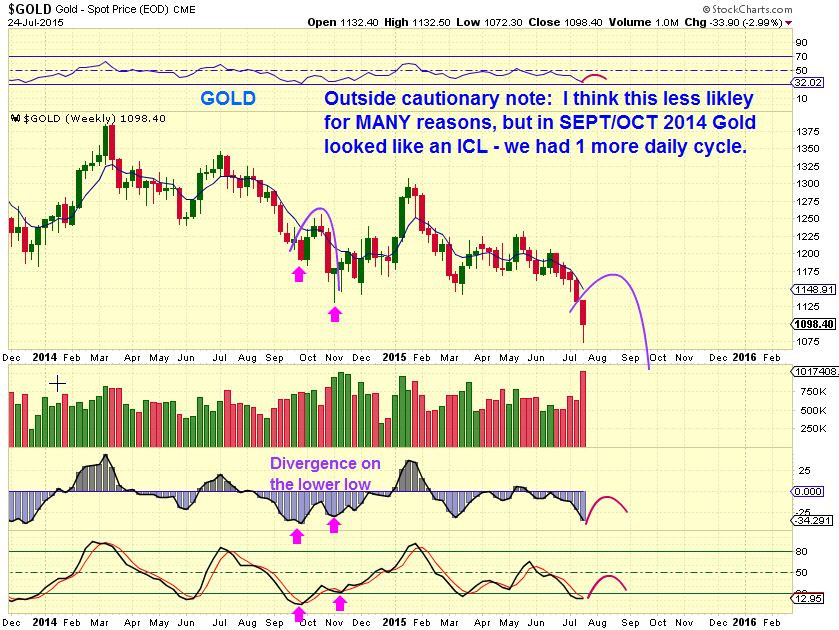
GOLD WKLY- looks like an ICL
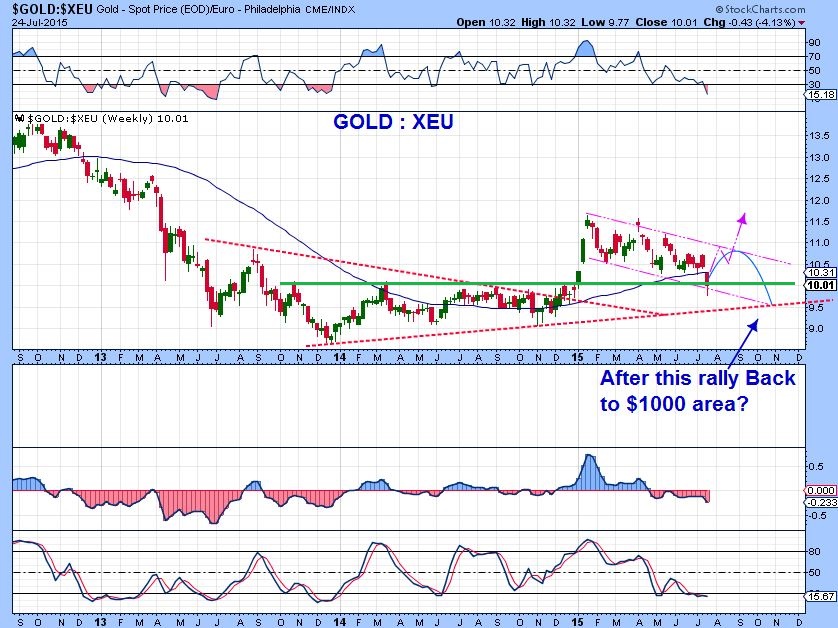
One of the readers at Chartfreak mentioned looking at a Gold :Euro chart. ( THX) 🙂 It fell to support & reversed. Interesting. I drew what it might look like if we run higher and then drop to Gold $1000 area in the future in US dollars.
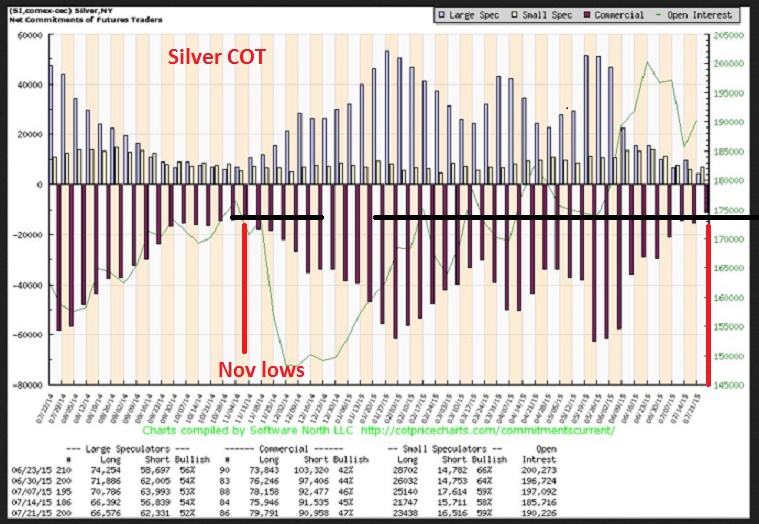
GOLD C.O.T. – All charts are clickable to enlarge . As of last Tuesday , Smart Money / Commercials less short than any time since 2013. Much less than prior ICL’s and even likely with additional selling.

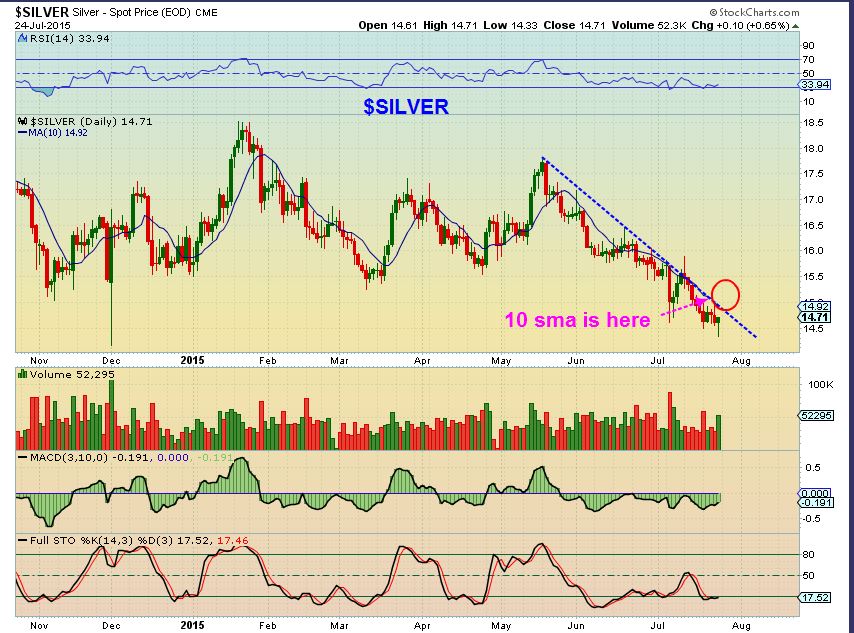
SILVER – a break & close above the 10sma on a daily would be bullish, breaking the downtrend line.
SILVER COT also below prior ICL lows
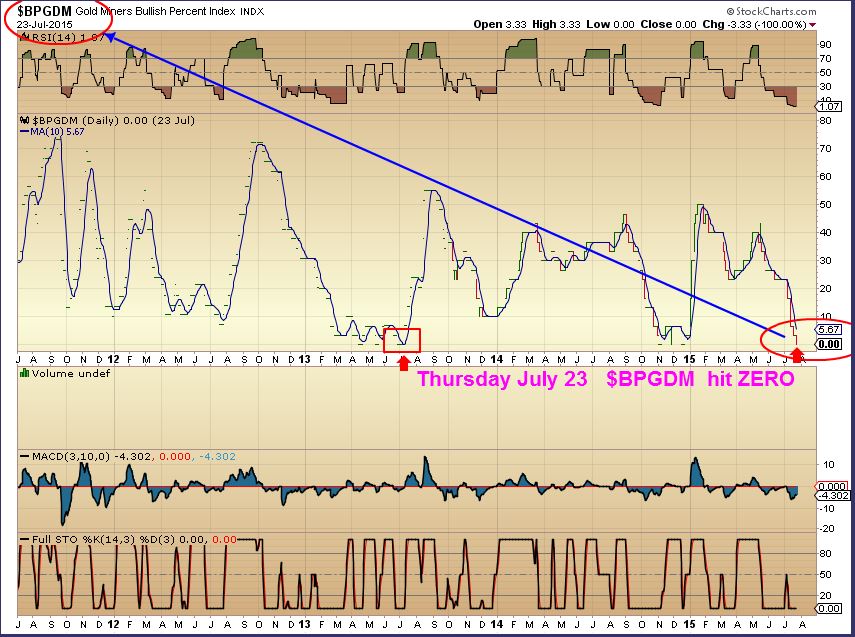
$BPGDM – This is amazing too as an extreme. It read ZERO as of Thursday. Not an exact timing tool, but it is extremely rare and happens at bottoms. Do you remember the June 2013 bottom and the surge higher?
Lets look at Miners
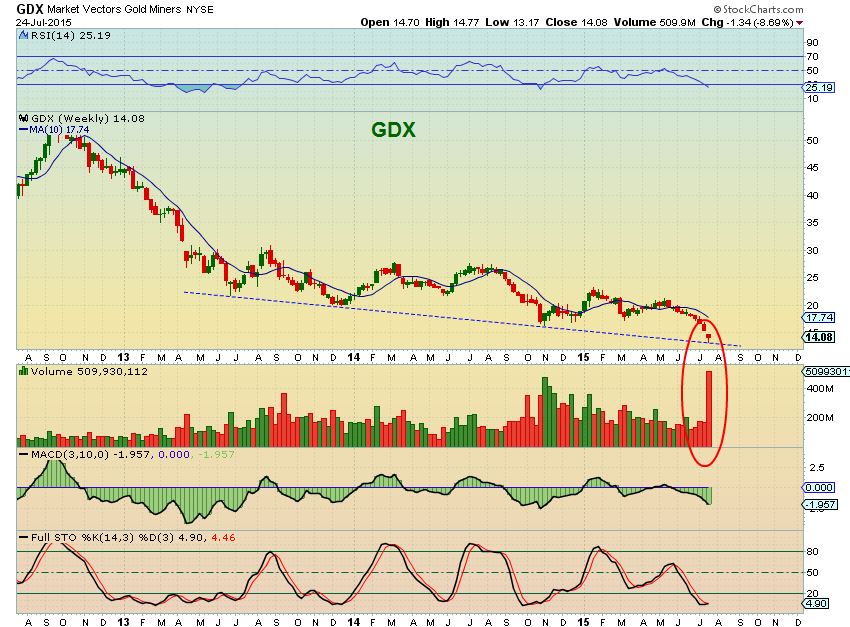
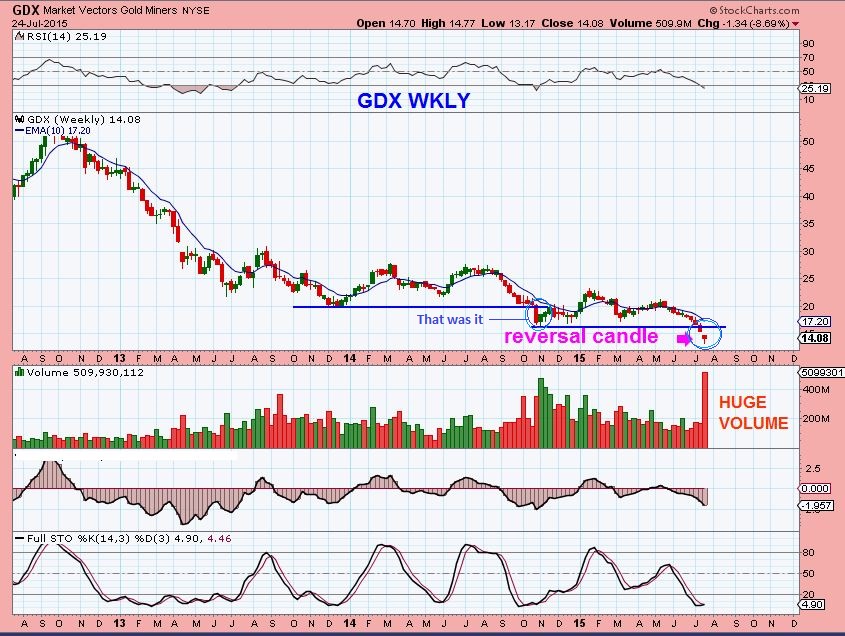
GDX WKLY – Enough Volume for a capitulation low? Record volume. Everyone bailed out and not many dared to buy this drop. It is a buy in my opinion, I’ll show you why shortly.
I had pointed out that when “support’ breaks, the bear news letters come out and call for Miners to all go to single digits. It happened in OCT 2014 when support broke. Everyone had downside targets in the single digits and called for their followers to go short, with weeks of downside. I mentioned that it is often a stop run designed to lose the longs and trap the shorts. I posted this chart to watch –
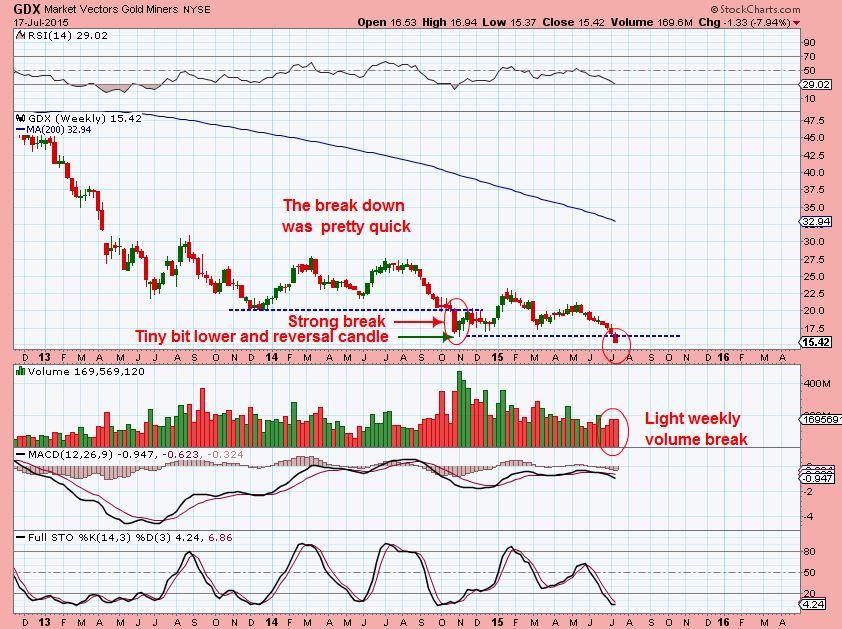
Updated chart with a reversal candle
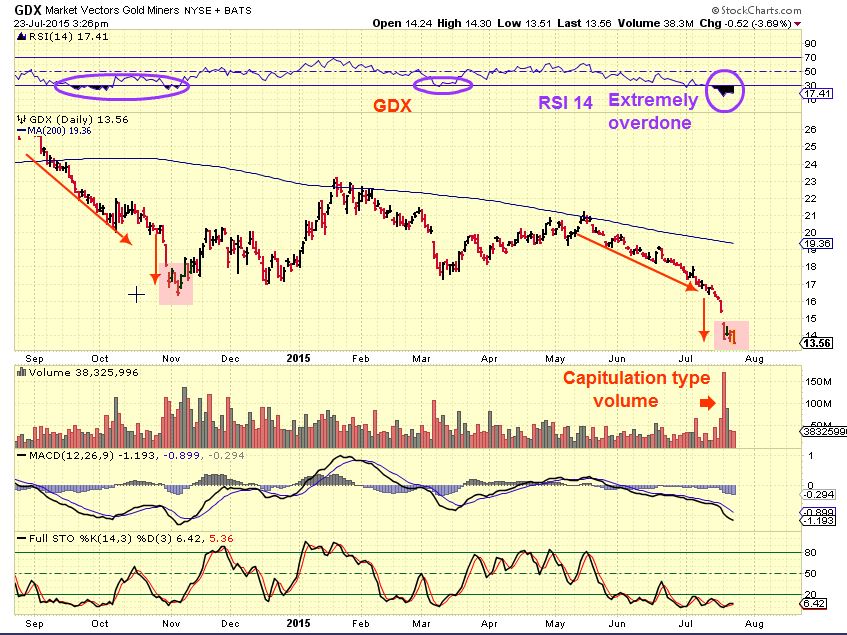
GDX DAILY – Extremely oversold, I was looking for a slight undercut , similar to Nov lows and we got it. I sent out a Friday afternoon update before the close. I said that I was buying, but the problem was ‘buying on Friday’ before the weekend. It could be risky if Gold slams down Sunday night like the last Sunday , but the lows do look to be in.
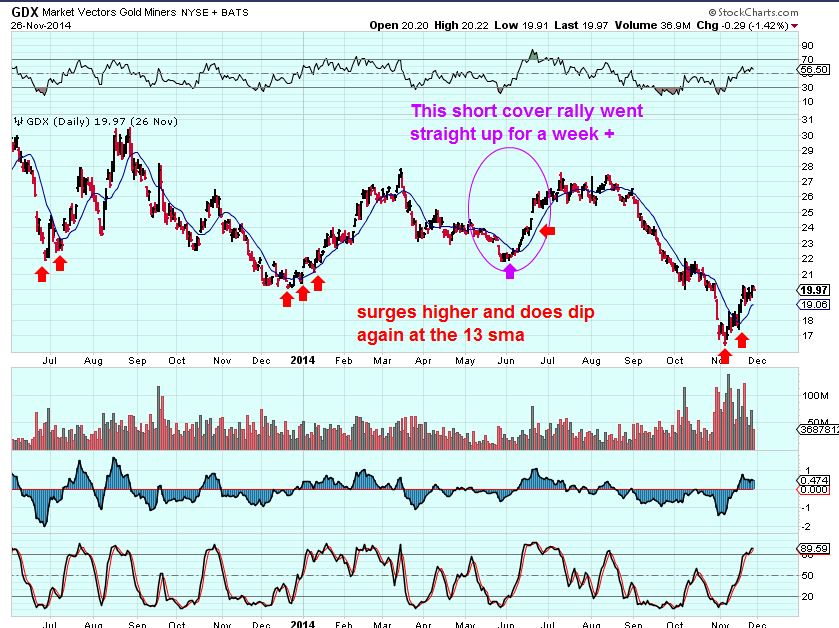
I posted this chart just to show readers that rarely does this move out of these lows go straight up (It can and has in the past like May 2014 shown, but less often). Often it pops and drops again , so there will be opportunity to buy, often near the 10sma.
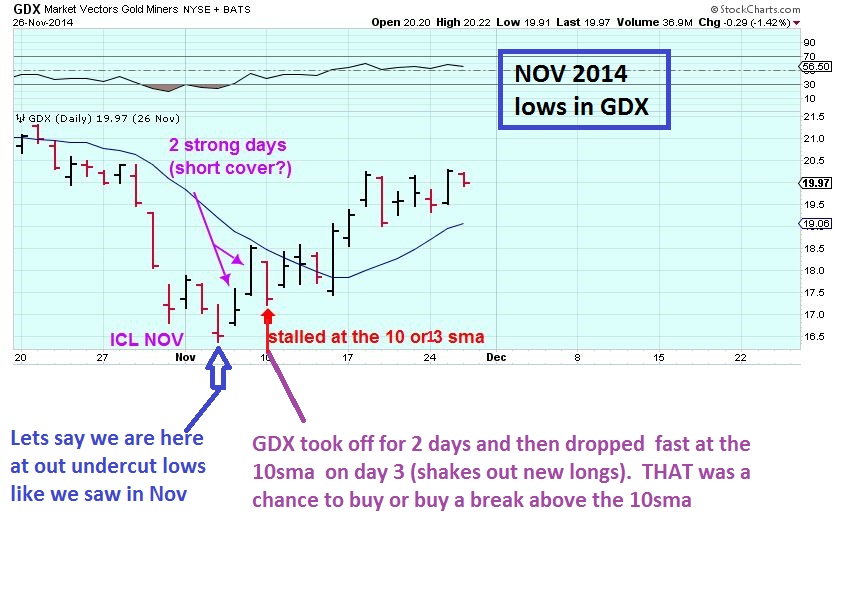
GDX ICL NOV- not straight up. Stalled at the 10sma.
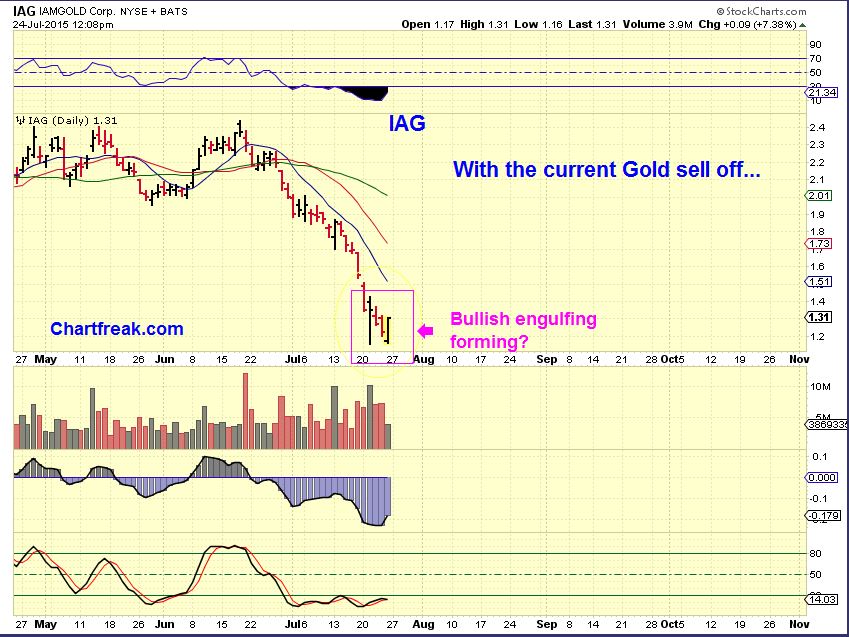
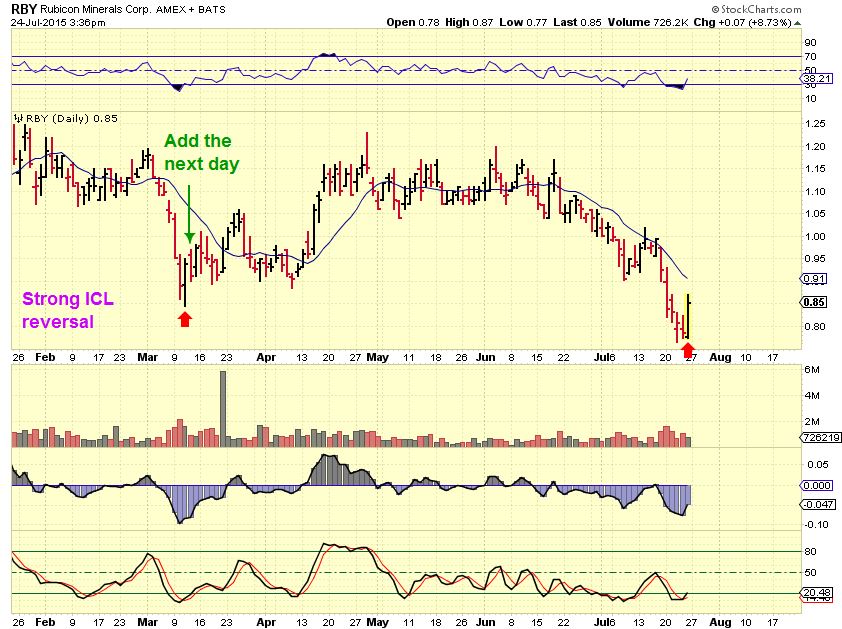
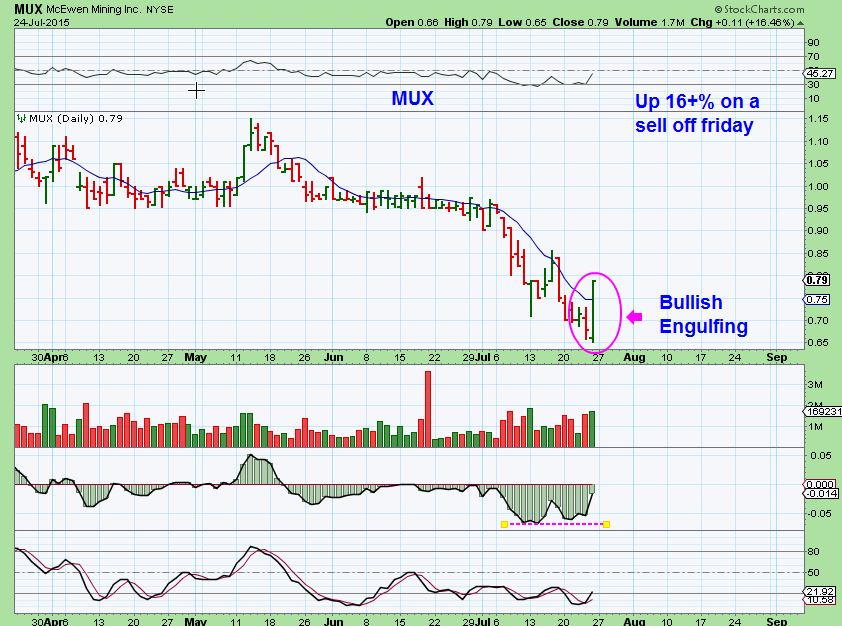
In Technical Analysis – a Buy signal for me is a Bullish Engulfing after a steep sell off. It can be shorts closing their positions and buying it back, it can be Buyers stepping in for discount sale prices. Either way, a bullish engulfing is low risk. Buy that low and a stop goes under that low, it should not be taken out.
I saw Bullish Engulfing candles everywhere in Mines at the close Friday. If there were 1 or 2 I’d feel more cautious, but SO MANY? Lets take a look . I posted a couple Mid-day ( I will post here) and show a few others. This also gives confidence of a low.
There are many more. 
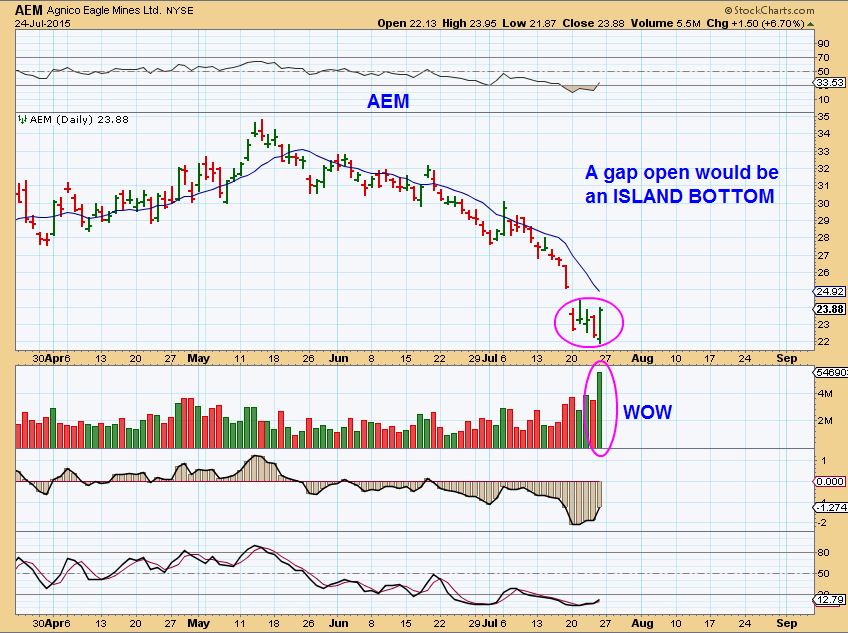
Some have strong reversal candles like AU.This was at 3:30 p.m. Friday.
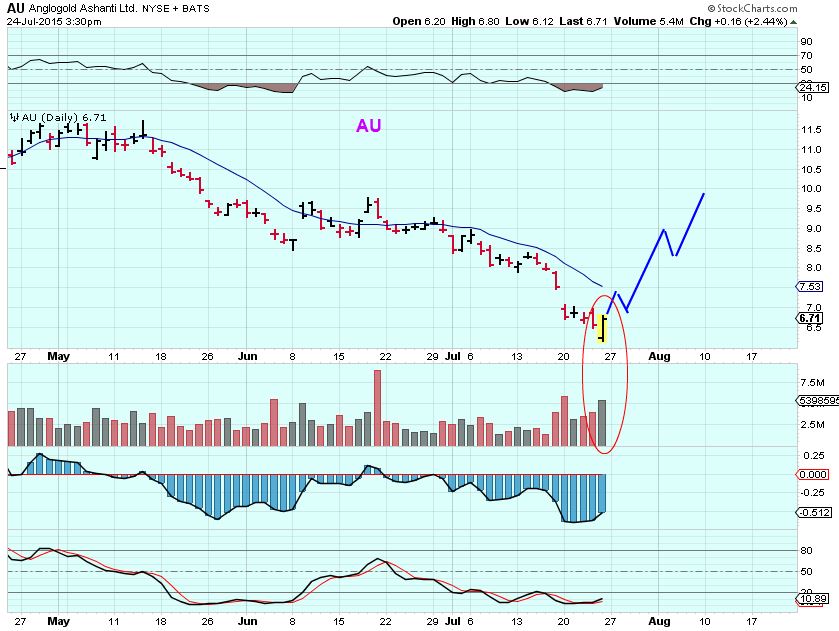
The list goes on & on. Look at some of these on a Daily & weekly charts. Do these look like Gold was selling off all week and no buyers were in sight? Or do these look like strong reversals and the ICL ( deep meaningful lows) that we are expecting are likely in?
.
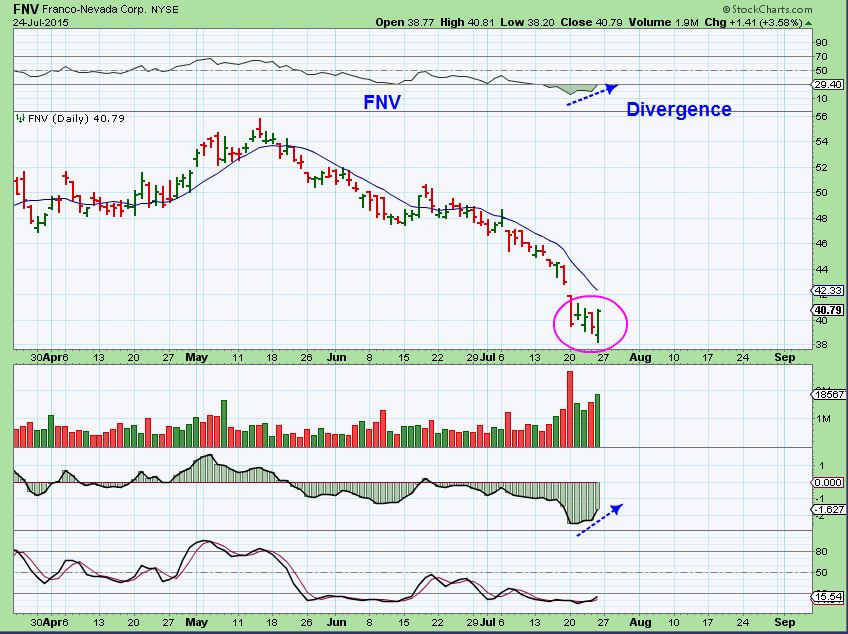
See Daily charts of NG – very strong looking , TGD, SAND, GG, SSRI, PZG, CDE, BTG, PAAS ( SA -looks like it could double on a bounce 🙂 ) Bullish engulfing : BAA, EXK, HMY, FNV, AEM, MVG, etc.
I think the lows are in and I recommend taking positions. The bigger risk is to not being invested. Use stops. Buy your favorite Miners, or enter ones that I have listed as reversals or bullish engulfing above. We have reversals right across the board. If we get a down day Monday, good for you on a little lower entry. Even if we dont, we are basically still at lows anyway and I expect a nice summer rally at this point. Starting a position here is warranted, the evidence is in our favor and makes a strong case that what we have been waiting for has arrived. 
~ALEX
You probably remember that I said at the start of the Gold section :
*There is an alternative scenario, I looked into it, will mention it BRIEFLY at the end.
Simply put, there was a time in SEPT / OCT 2014 that we looked like we had an ICL in many ways and we actually bounced for 2 or 3 weeks and rolled over into a final ICL (1st Magenta arrow to the 2nd). Many indicators showed an ICL was possible then too, but not as extreme as now. COULD WE DO THAT HERE to get to $1000 when no one expects it? I only say maybe because we didnt tag 2008 areas of $1033 pointed out on my chart last week. Would a 2 or 3 week rally get the bulls over excited and then drop it down like Oct to Nov 2014? It looked like this.


Wow!! Never heard you be so pumped up about a position like you are about miners. We have been waiting just like you patiently for this. Will certainly start to build a position now. I had one a couple weeks ago, but it was too early, and didn’t work out well. Thanks CF.
Thx Wishfullthinking
The bullish engulfing candles are usually reliable, and when I started to see several in one beaten down sector, and many other factors added in, it was a pretty good case for a bullish move higher this week. 🙂
I’m with you, though things always look good if you need it. I have to admit I feel ……well …..never mind
Hey Mike,
I would say that the only time things “Always look good” is if one has a bias. Right now, charts look ugly, but reversals look bullish ; )
A move above trend-lines or 10sma will give further confirmation for those that want to play it safe.
Next week will reveal a lot. Best wishes!
Alex, charts certainly speak for themselves at this point. It can still be hard to pull the trigger on these; the beatdowns in recent past remain fresh in the memory. But a lower open this morning could be the opportunity you speak of, letting others in instead of gapping up and leaving folks behind. Have to stand strong! Short term looks like gold may want to test Fri breakout at about 1186 level.
Significant pressure on market this morning. If persists may offer gold support after open. Last week you showed a chart of NAZ that if it tested breakout and gap from recent run could be a great long setup. Watching Q’s if they get down near 109.
I agree, selling has been strong.
Each person must know their own confidence level with the information presented. If one thinks that lower prices would shake their confidence, they needs to start with small positions. No one said to go all in and risk it all. 5%? 10%? what are you comfortable and of course we always USE A STOP. I bought the reversals Friday , so I am heavier positioned. I have been in this situation many times. Also a stop is below any bullish engulfing low, so Fridays lows are the stop.
Especially the NASDAQ – did you see SHANGHAI this morning? I would be thinking of possible contagion. Start small or definitely wait for a reversal.
I set limit buys to add but they missed. 🙁 This action def shows you were on to something, though!
Reminder Fed mtg minutes on Wed 2 PM and GDP Thurs AM. If we run into some may want to trim, esp if in 3x ETF.
Very true on FOMC. May effect gold & miners, but so far so good.
Thanks Alex, Great stuff. Do you think some of these stocks (mentioned above) will have the kind of increases to match NUGT?
Look at Nov – CDE, IAG, and a few others went up 100%.
I cant know for sure, but use that as a guide
Alex, Just wanted to follow up on GPRO. Pulling back now but noted in your post you mentioned 10sma–but showed weekly chart with comment. Did you mean the 10dma? or the weekly? Assuming you meant closer to the daily average as a buy. Thx!
Hi Deshy,
I actually said ’10sma on a daily chart’ …then I showed 3 charts, 1 wkly , 2 daily. Below attached (refresh) is what my comment was. I also said IF it pulls back on lighter volume…that is key with the shanghai sell off, just in case our markets panic a little.
Thx!–I’ll keep an eye on the volume.
Impressive write up, Alex. Really good stuff. Thanks
Thx Troy
Alex, also quick question on pre-market. Noted prices this am were lower for GDX but on open popped up. Do you find that the targets in pre-market are often met in normal trading hours?? Thx!
I have never really noticed.
Check out SVLC at the open . Bought out by First Majestic
Not so good if you bot AG on Friday 🙁
True, and I personally think that AG is a good company.
Thx! Well for now I’m holding on tight…but did lighten up a bit…just in case. That “hope” thing hasn’t worked out too well in the past with these miners so lesson learned. 🙂
I own SVL (Cad) Alex, is it better to sell it now?
Thanks for your help.
It hit the 50sma in the Canadian chart and turned down. That would be a sell signal to me (also the fact that it gapped open over 20%).
I’m a firm believer that no one can tell you exactly what a stock will do next , especially under these circumstances, but I would have sold since it was up 20%
You should be able to buy it lower later.
tx 4 layn it all out there… my man
feeling grateful …………………………….
Ur welcome.
I looked back at many chrts and as I have put in the reports, I feel that these will run higher , curl down at the 10sma (pause) and try to break through.
I would say that either The curl down or the break through could come at the fed Wed
I agree……I am personally waiting for the 2 wave down to add to GDX, which could happen on Fed. Wed. (40% vested)
Maria you “really” are grateful! 🙂
yeah…. don’t tell anyone ;o)
I wont promise 🙂
Just like the market. Tough to pick the exact bottom!
Alex…. one short question I have, how Gold and miners react so far did you expect this?
So as always….. thanks a lot.
Pretty much, I said to watch the 10 sma on many miners / daily chart.
Look at GDXJ , HL, CDE, EXK…they all hit the 10sma and turned down.
Watching NUGT. These two time frames look very similar. The last one led to another leg down. I have a position started.
Since you said , “The last one led to another leg down. I have a position started.” I am assuming you went short (Dust?)
No, I started a position in NUGT. I am following you on the ICL in place. I just can’t help noticing the similarity. What is your exit strategy if you’re wrong on the ICL? Stops below Friday’s low I believe?
Yes, and I dont think we will see that on most positions , the volume remains light compared to the reversal day, but a few miners could .
Good to know, TKS. I scalped NUGT this AM. Looking to re-enter. May wait till Tue.
Fed Wednesday , I cant bring myself to go full position until I see what happens on WED /Thursday
Forgot about that. TKS again…..going to read a book till after fed. Can’t get in trouble that way 🙂
Stopped out of IDRA stopped out of GALE. Can’t make any money these days.
Idra still looks ok above the 50sma, Gale got hit. Bummer.
Refresh for a chart, this is what I am looking at . On a daily GDXJ ran up & tagged the 10sma and turned down.
So far looking at it from this view would indicate that todays selling is normal, but it should shake out “longs” that took position Friday or Today.
If it were to drop a lot more, then selling is picking up, but this volume is quite light on this chart . Click to enlarge
.
.
So the 50SMA on the 15minute chart might be a good buy point with stop just below. GDX broke thru, GDXJ bouncing
Thats what I was looking at to add, but it may run below it too. I was going to wait and just see if it runs it and reverses higher , or anything but close below it.
If it closes below it I wont sell my original buy, I just wont add yet.
EGO reversed there
Broke below and then reversed higher , right?
I have that HL reversed there and IAG never reached it , so they seem to vary in strength.
Thanks Alex…. encouragement
WTIC still following this previous chart (refresh) pattern from last July. If it continues we could get a buy point at $44.
willy wonka and the chart factory… lol
Thats a weird coincidence . We came in from grilling when it started raining yesterday, and the original was actually on TV yesterday. Ended up watching about 15 minutes of it while I gathered more charts for the weekend report. P.S. No, I wasnt the one watching it, but it was on 🙂
HI Alex & all.
anyone thinking we are likely heading for H&S patterns here?
thats GDXJ btw.
here’s GDX
yes, Inverse H&S. Thats a possibility – it sure looks it from your charts
Adding 10% to my GDX Calls here. 2nd Tranche filled. FWIW
I added my 2nd at the close. Man, I’m glad I waved off and didn’t try to chase after I missed early lows. I won’t add 3rd until after Fed, will lighten if given the opportunity.
I wanted to see DUST break down below the 10sma, and it turned upward at the 10sma.
Still no confirmation ( break of the 10sma on GDX) of a swing. I’m not adding yet
That confirmation (if it occurs) will be my 3rd tranche. 🙂
Yes, a close above the 10sma would be nice,
The H&S pattern for gold is complete (refresh) we have a higher high on the 15min chart. Baby steps. Doesn’t feel like an ICL.
HHHMMM, Definitely has the hallmarks of an ICL.
Extreme bearish Sentiment & Fear / C.O.T. / High volume etc.
Everyone wants to buy a DCL , hardly anyone can buy & hold and ICL
I hear you, Bill. I remember that last November. I knew something crazy was going on btw vol, volatility, and sentiment. Just wasn’t sure until it finally took off. This has been so slow I have doubts, but the chart evidence really is overwhelming.
Okay, if thats the definition then we are at an ICL. I am having a hard time holding on to my positions. I always catch the knife. I am all cut up right now.
OK. That was painful :-(( All stops now at Friday’s lows–so I sense I will be completely out by tomorrow or we (hopefully) go higher…either way hope to live to play for another day.
GAP lower tomorrow at the open then we take off!
Gap lower below today or Friday?? I’ve set my stops below the low of Friday but in the past I’ve only fooled myself by continually moving my stops.
A gap lower than Today, if Friday’s low doesn’t hold, I’ll sell everything and put my money back on the shelf! Not making money is better than losing it.
“not making money is better than losing it”… I second that Bill. Or small losses better than runaway losses.
Well don’t have to worry about the train leaving without you, just about it leaving at all. Going to have to play this a bit more nimbly than I was originally intending. With the $$ and markets down, was a bit confused by gold’s drop fundamentally.
In other news, gas just can’t get going. Whenever it looks good (last Wed) it fades. Ugh. Oil would have been good short, was waiting to a bounce to maybe 50 day but never got there. Hasn’t sold off ferociously but is just down day after day so doesn’t make it low risk to jump on. Wish I had used looser stop on SCO; no position in that complex for a bit now for me.
I had a report showing that often ICL lows linger at the bottom. I posted several charts showing how in the past they have lingered at the bottom.
I did this so no one would be surprised. 🙂
I think I read that somewhere. Oh wait, that was here!
I read the charts that Thurs was about the end of linger period so when Fri really sold off, emotions took over (bad!). On reverse expected 2 days up, Fri then Mon. So got complacent yesterday and was surprised by very sudden downturn. However, I didn’t chase AM, added at lows near close so good entry just above where our stops are.
In the past ICLs I have waited for lots of confirmation, sentiment turn and then pullback. What does that mean? Bought the top! Think I’m finally prepared. Anyway, sorry to barf up all my thoughts here.
I’m with you Cason.
After a drop like last week, there should be at least a GDX 10% bounce (well there was in 2013, even amidst the waterfall)
You know it’sgetting close to a bottom when the comments surge 🙂