When most people first start trading, they see a market that is running up,up ,up – or falling down, down, down and they want to jump in and get some of that action. What happens? As soon as they make their move the market does a 180 and heads in the opposite direction due to extremes. We may be at the point that extremes are about to cause some decent bounces. Lets look at some charts.
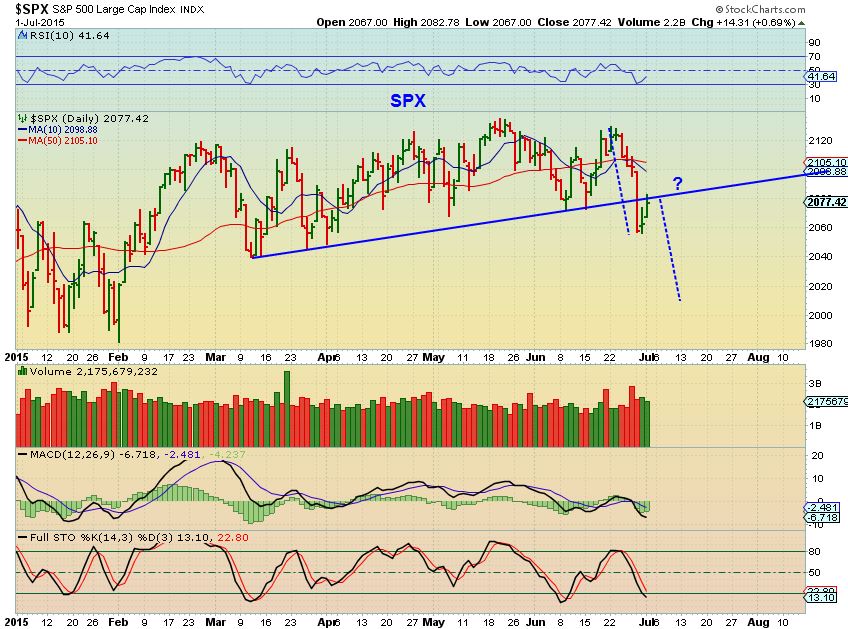
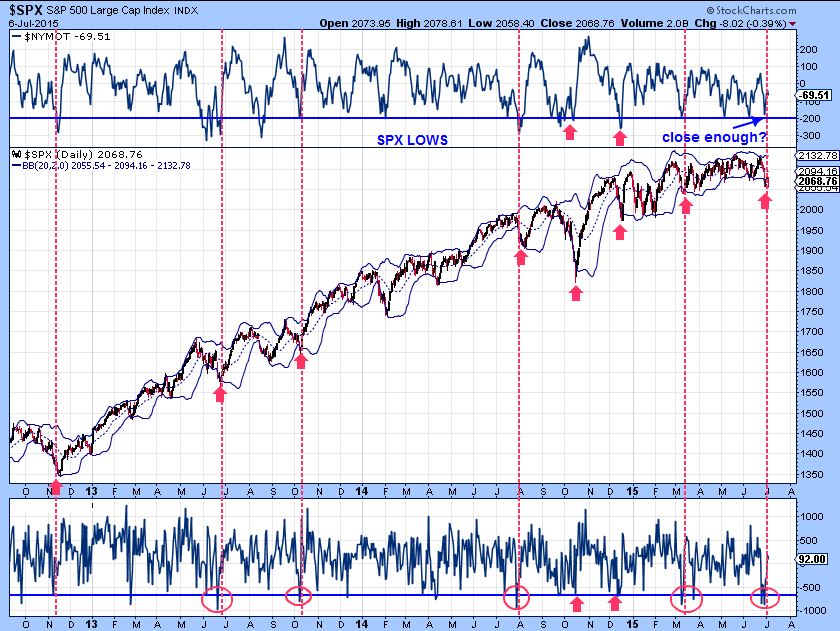
SPX July 1 – the original thinking was that this could be a bear flag and become an a-b-c down.
SPX – with a lighter volume drop to the 200sma so far , and for other reasons mentioned further in this report, I am thinking we get a bounce here soon.
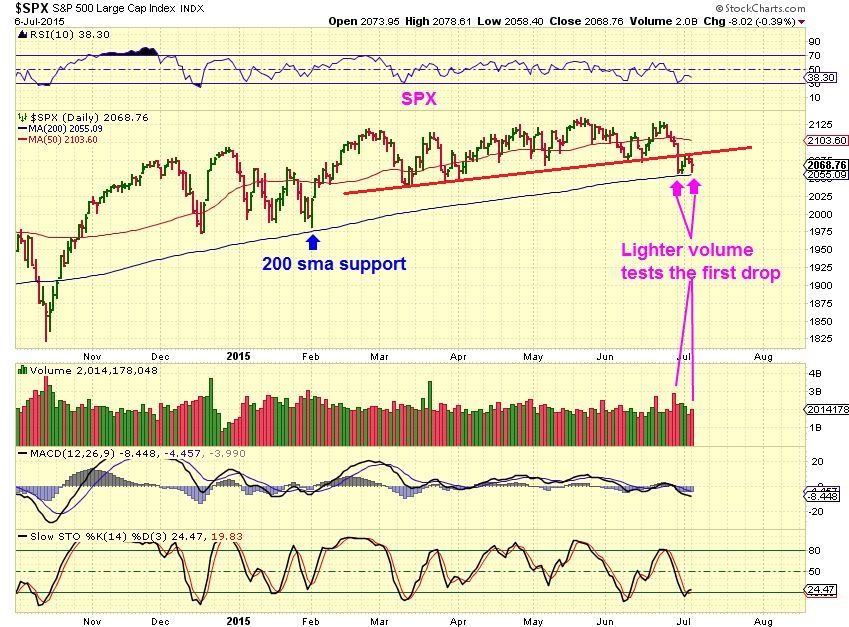
There is a chance that that Bounce is bigger than expected if we get a short covering rally. Let me explain.
1. The NASDAQ looks the same as the SPX above.
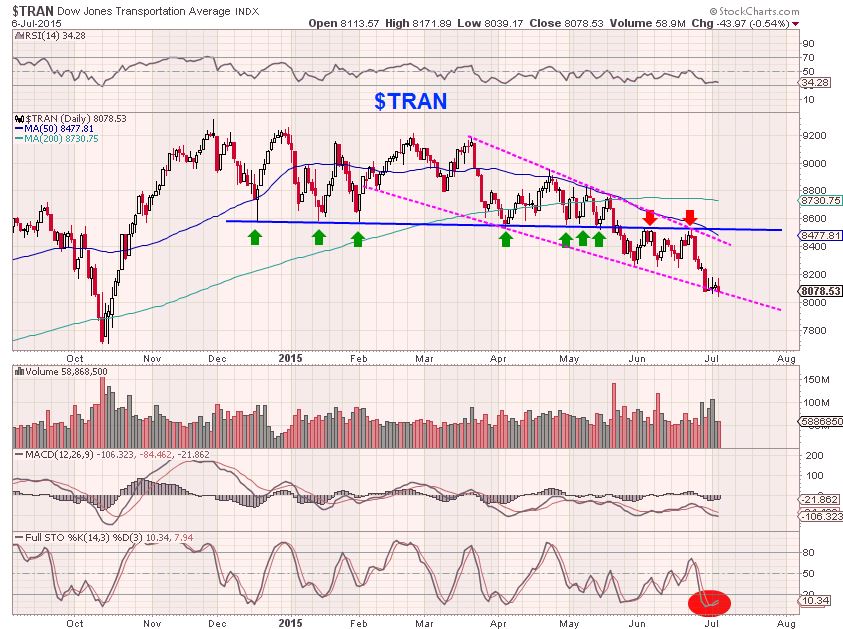
2. The TRAN broke down and back tested, but in this sell off it has reached oversold and sits on a trend line which is acting as support , despite the other markets selling off. (50 sma tag possible?)
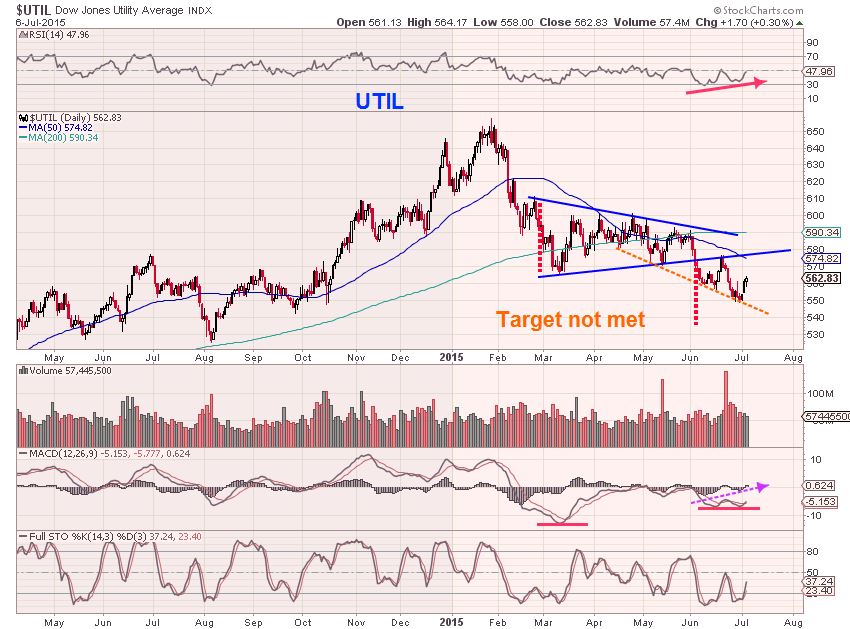
3. Utilities still look very ugly, but there are bounces on the way down, and we see divergences here too. Notice from June 1 to July 1 – price is basically the same. (Watching the 50sma for a tag again)
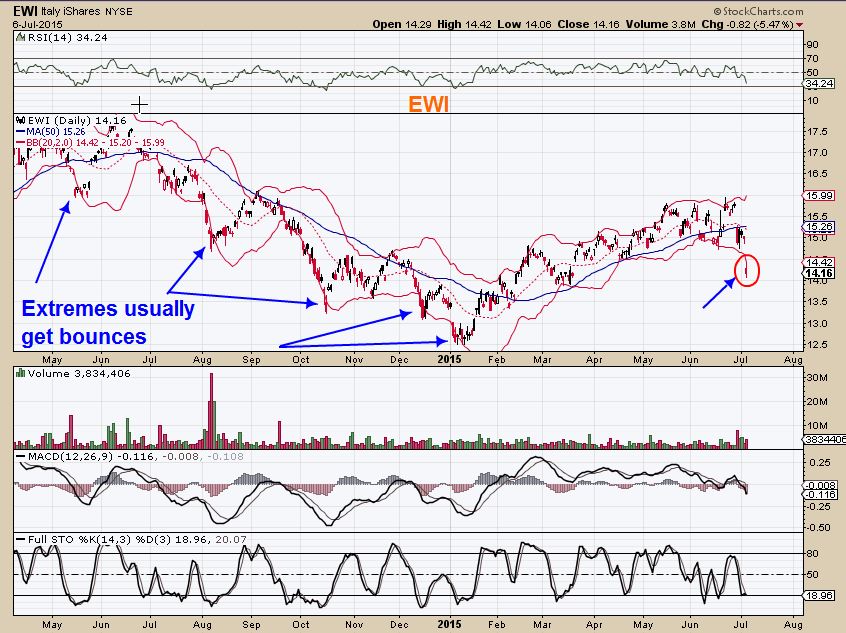
There are many markets in the EURO ZONE that have been sold off with the GREEK / EURO concerns and they get to a point that they crash their B.B.’s. That usually causes a quick bounce to the 20sma. Some like the EWI, look like a quick buying opportunity for traders
There is another reason why I think the markets bounce here. An old trick that someone taught me years ago about ‘extremes in sentiment’ and ‘over reaction’. He pointed out that when you see certain extremes in the markets, you often get the opposite reaction. Extreme selling begets a bounce, catching the shorts off guard and forcing them to cover. That could even lead to a small rally.
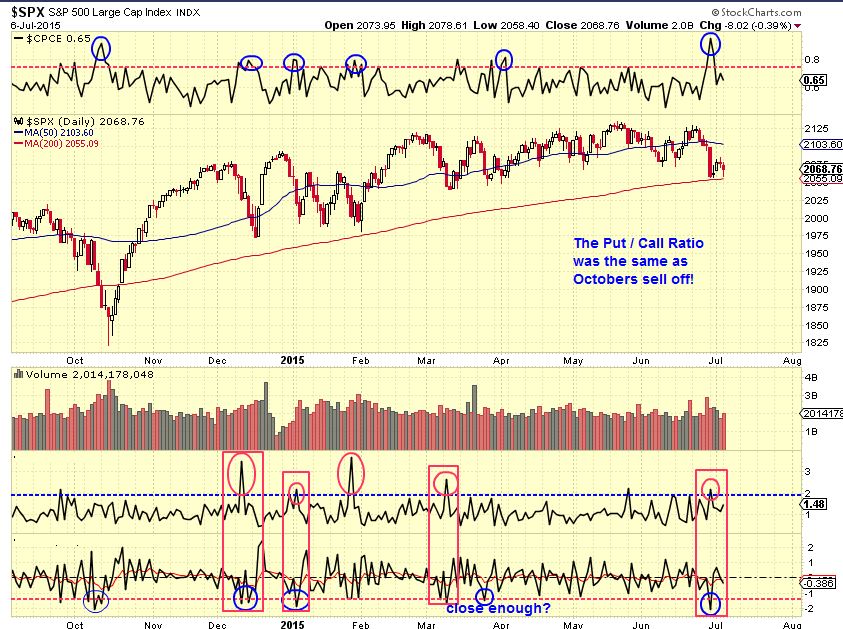
2 charts that he would use to measure extremes would call for a reversal in direction very soon.
Notice the CPCE is the same as October?? That is extreme and likely due to concerns with Greece / Puerto Rico, etc. This almost says relief rally, but I dont want to go that far. I would go as far as to say its a buy for traders with a stop below the 200s,sma. UPRO, TQQQ, etc ( With my own personal experience…. I would have expected a stop run below the 200sma and then a reversal, but the candle yesterday shows support was found there.)
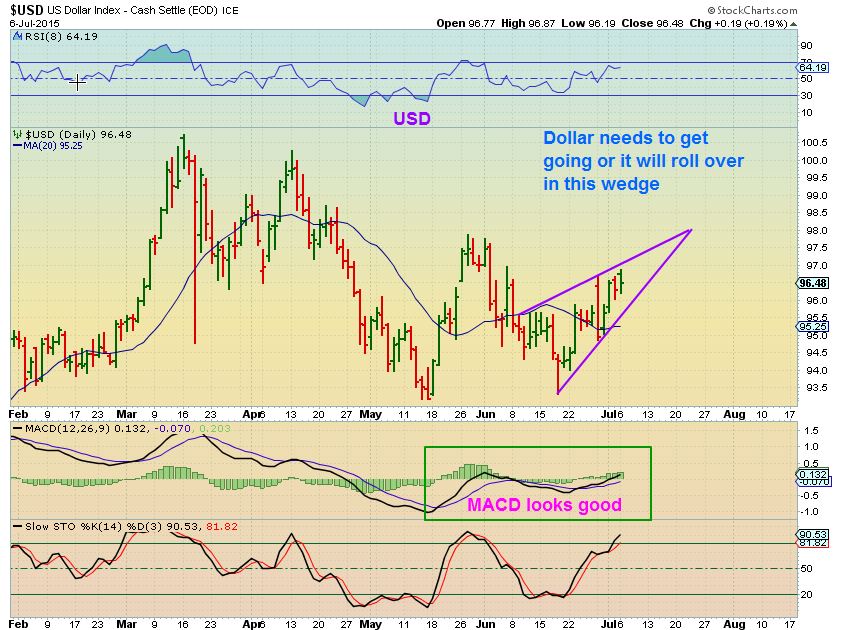
USD– I draw my most of my charts at night. As I mentioned yesterday , the USD is a bullish set up, but it was not showing strength (yet). IN fact , a wedge now seems to be forming, which could cause further delay. Pre-market the dollar is up strongly at 97.14 – maybe it can break above this wedge and negate it.
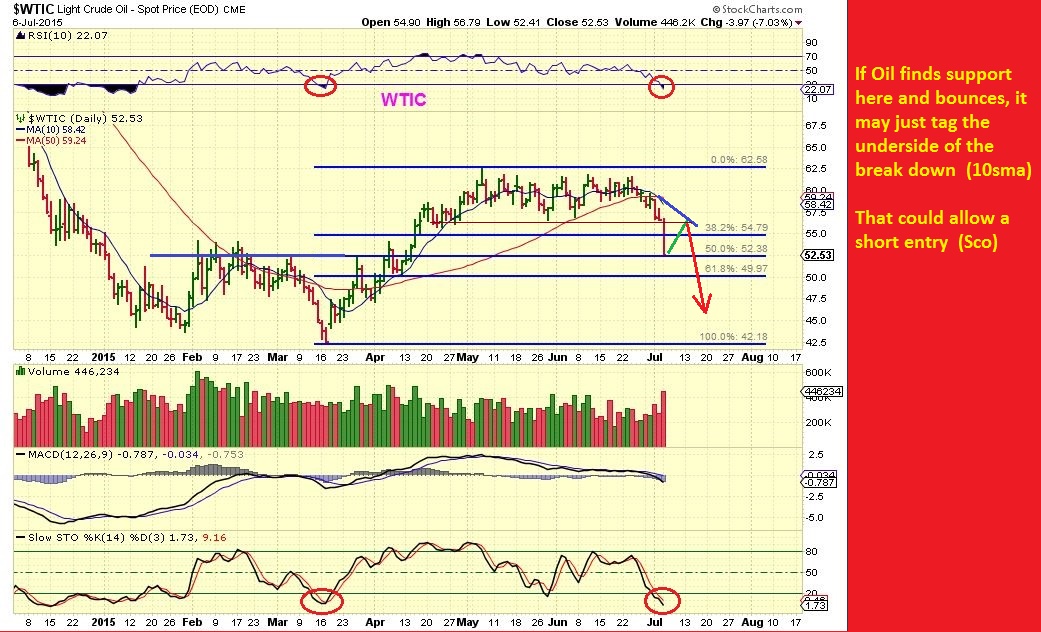
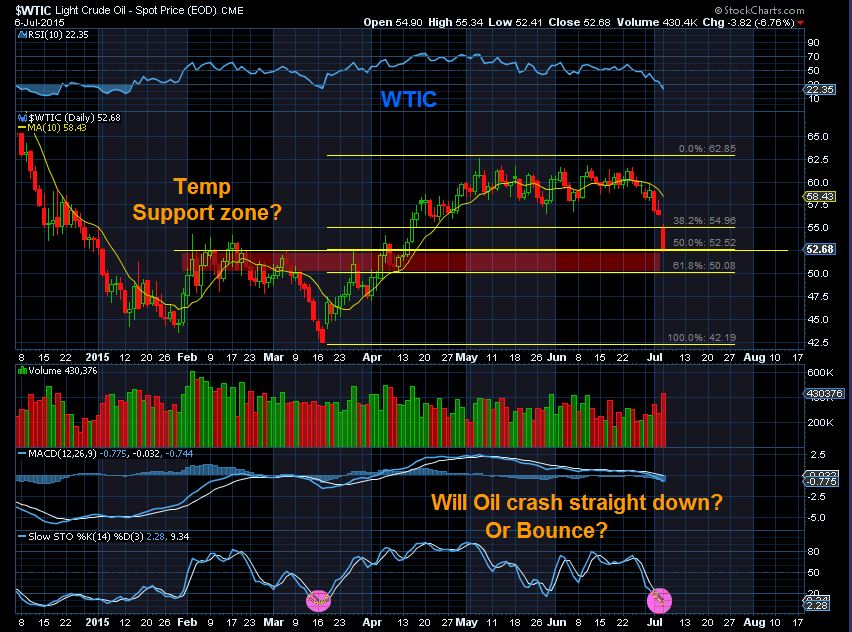
For some reason I drew 2 charts of OIL. Both pretty much pointing out the same thing. We could get a bounce at the 50% / support area, but it may only be a bounce . See charts
NATGAS – the concern is weakness that shows on the indicators. It is the same weakness that I pointed out in OIL before the drop began.
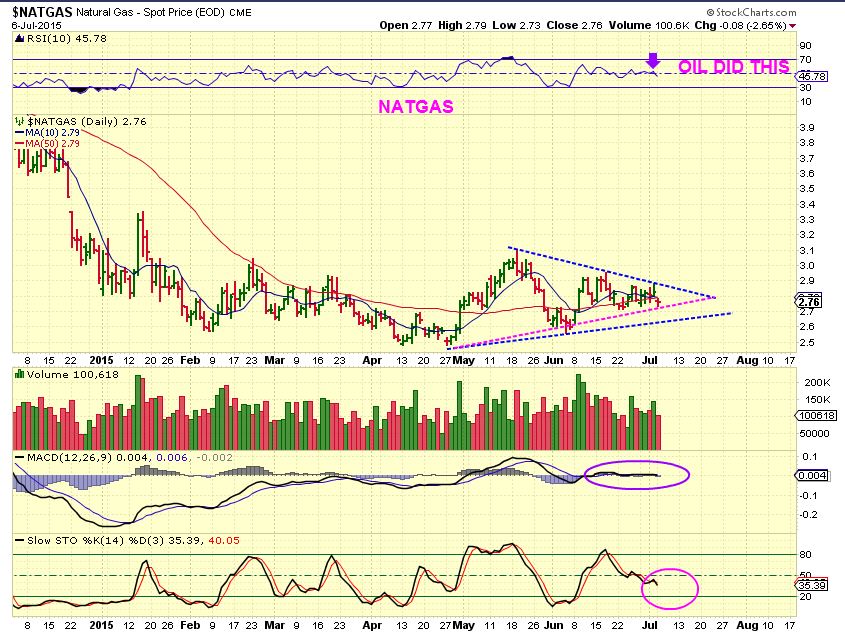
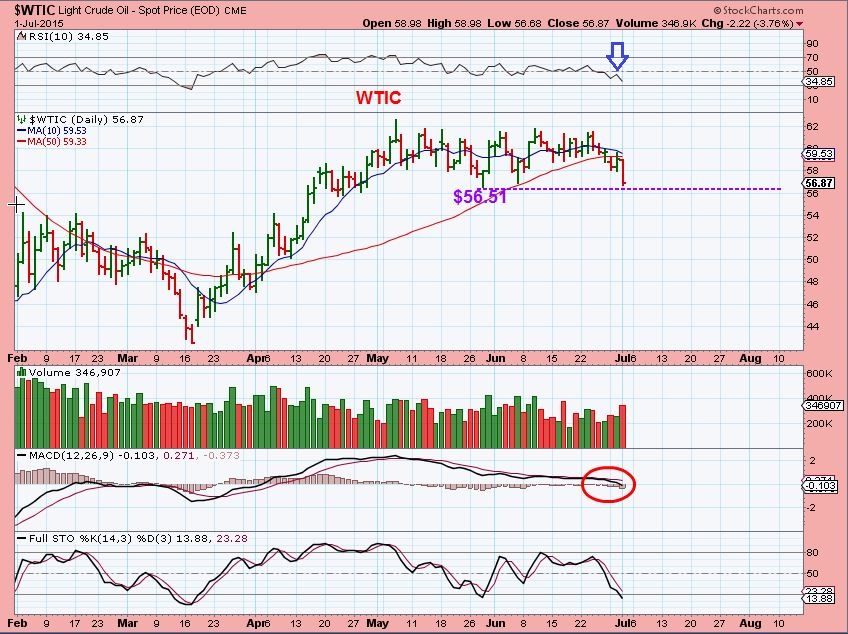
This is the chart of OIL as it started to drop, see the RSI /MACD weakness is similar to NATGAS now? Traders may watch both UGAZ and DGAZ – choosing the one that suits the break out or break down.
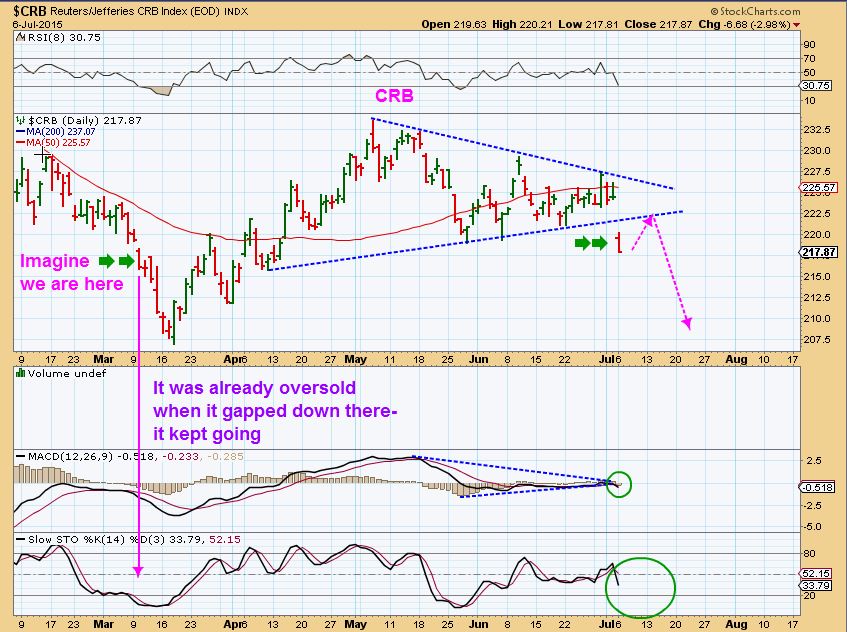
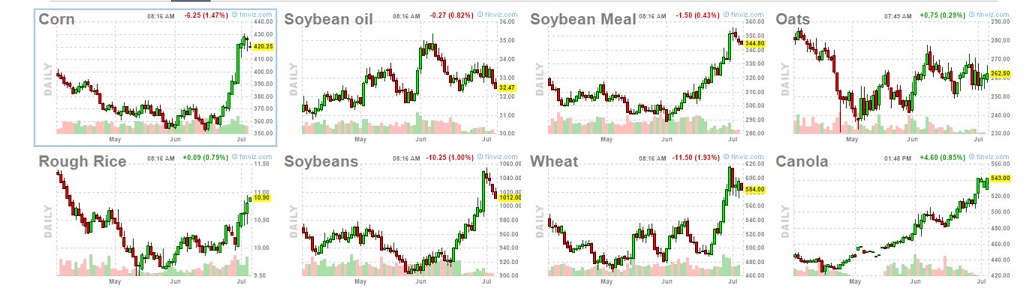
The CRB is following OIL ( grains remain strong) . The last time it gapped down like yesterday it was already oversold but just kept dropping, see the left side of the chart. Maybe that 3 yr low IS ahead of us
Remember when I said that despite all the selling, Biotechs looked strong and posted this?
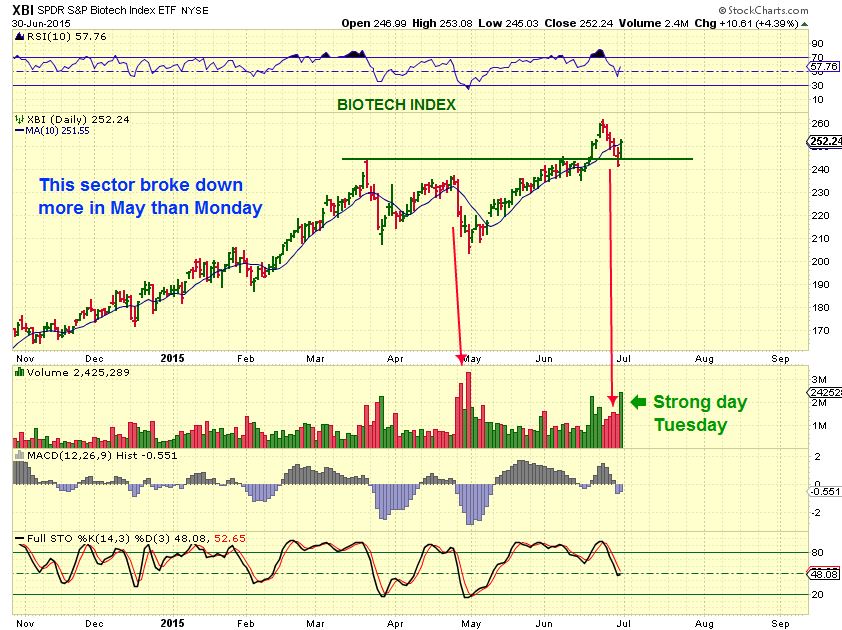
Biotech – “staying healthy”
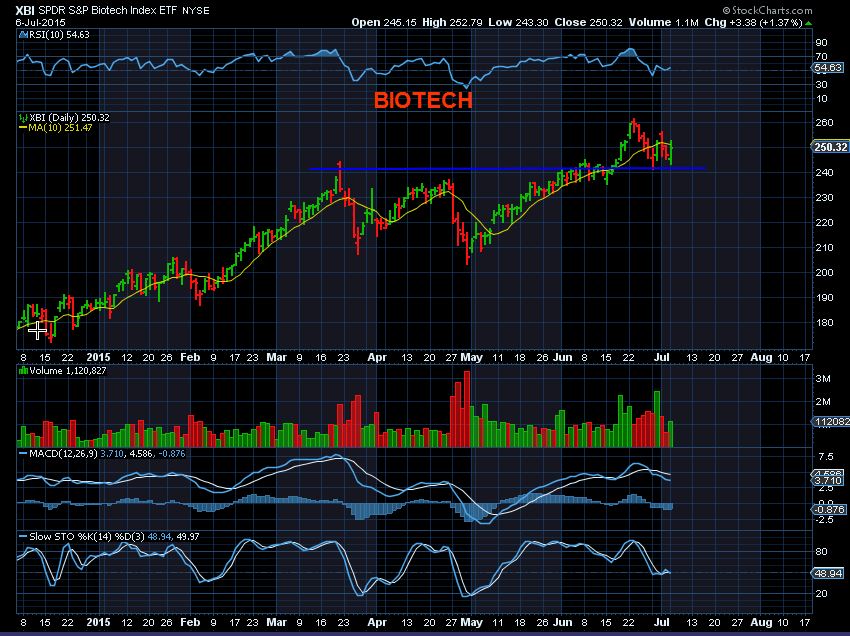
I had posted charts of IDRA, ZIOP, LJPC, HALO, EYES, BLRX, SCLN, KITE, etc – Traders may want to Look them up, some have moved even higher, some look like they could be setting up for a run higher.
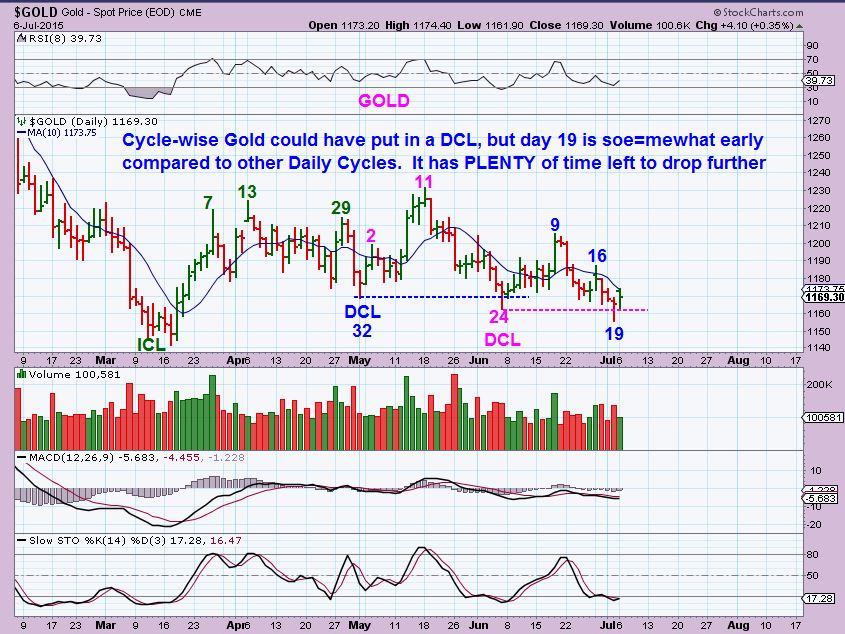
GOLD , SILVER , MINERS
If I was not writing a market report covering ‘everything’ and simply trading on my own, I feel that most of my undivided attention would be spent in this area. I think a great trading opportunity is fast approaching and I am trying to take note of the many different areas that affect the precious Metals. Lets do a quick review for now.
I got a rare buy signal last week. It does seem too early to fit cycles timing to be THE LOW. ( I am personally trading it as a possible DCL, but couldn’t outwardly recommend it as a low risk entry). As you can see, It is even earlier than normal lately for a DCL in Gold, so more downside timing wise is likely to occur. The last 2 daily cycles being 32 days and 24 days long. We tagged the 10sma Monday , we may now drop into a real DCL . That would make today day 21 & still counting down. Please excuse the typo on the chart please.
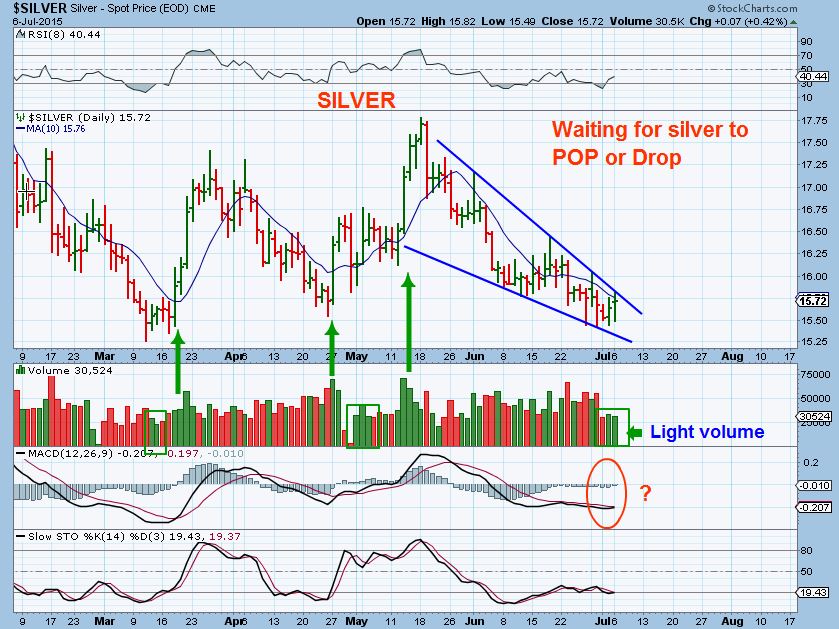
SILVER – really should be dropping to a DCL soon. Volume higher was light and the wedge has more room too.
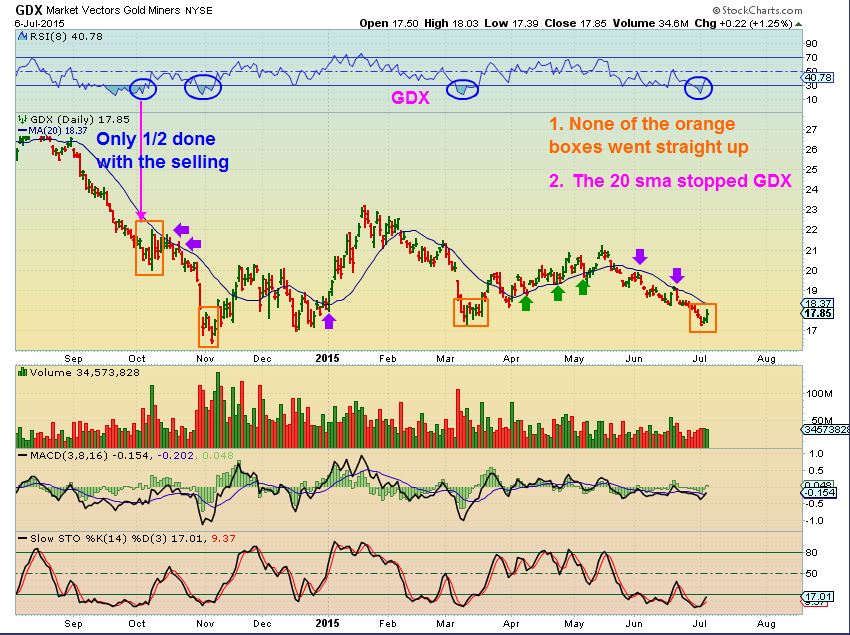
GDX – Some miners like CDE, EXK, PPP looked pretty good yesterday, but the expectation is for Miners to drop further. I pointed out in orange boxes here prior areas where that rare signal came in. Please note OCT 2014 again…it just moved to the 20sma in a flag and did a final drop to the ICL. That could be what we see here in time, a drop to the DCL / ICL.
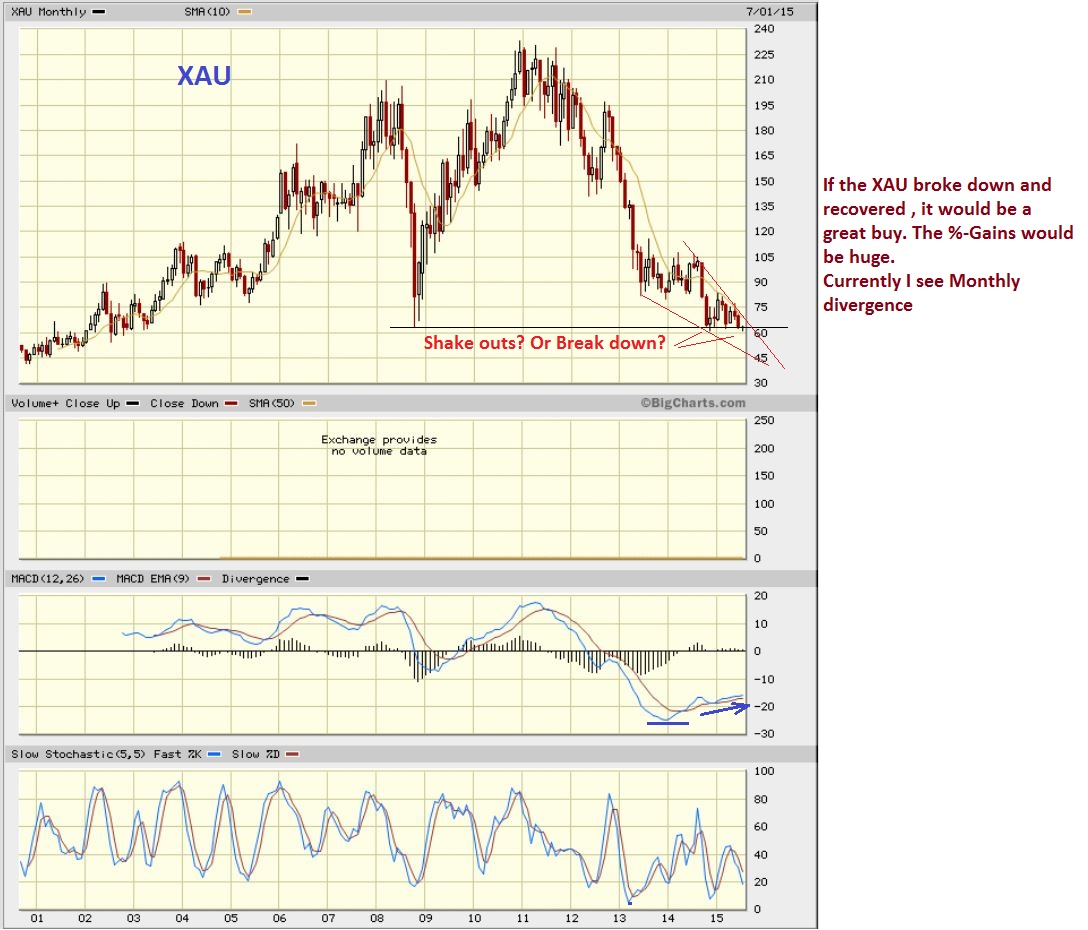
I am going to spend some time today digging into the Precious Metals markets a bit more. There is a lot to look at in the past drops to ICL’s and I want to review all the bullish and bearish factors in front of us. I need to stare at charts and get a picture in my mind of what to expect. The great majority expect a slam down to the $800-$1000 area and then a v-bottom flash back higher. I read 3 articles mentioning that the HUI / XAU are breaking down. They went below the 2008 lows.
That could be a shake out- Time will tell. If it was a break down it would be a tremendous buy in my opinion, but I still see other things that make me wonder if the P.M. markets will leave the majority behind. I really want to look into this area.
It is 9 a.m. and I need to release this now . I am currently very lightly trading, and I am waiting for low risk entry in certain areas. I think the markets are going to bounce or bottom pretty soon, but I cant be sure how well it will stick. It may just be a relief rally caused by short covering when it comes. It can still be very tradable for those in front of their screens . The CPCE number was EXTREME and it along with other indicators do point to a bounce soon. I want to look into the Metals markets today, so I may not be in the comments section much. I’d like to be better prepared for a future trade there. So much to look at! For now it is a traders market, but volatilty is everywhere. Stay nimble – Stay Frosty!
~ALEX
Lots Of Red So Far 
 WATCHING REVERSALS
Scroll to top

SCO and DUST! Wow……
I came really close to pulling the trigger on DUST yesterday at 17.2 but thought we might get more than a 15 minute bounce out of GDX. Darn! And I missed SCO, too. If we hit 10 day on oil this week, I’ll jump on SCO.
Has to be getting close to a great buy on NUGT. H&S pattern nearing completion. Refresh for chart. We might get to the ominus $6.66 number
$USD breakout! Refresh for chart
though day for energy and gold silver and really everything. Since I am out it is ok for me, but lost the occasion to short the metals into a possible DCL (ICL)
WTI fell below 50% FIB now sitting right on it, from March low
Just checked that, looks like a possible reversal at the 61,8% area .
Does it not have to actually touch the 62? Serious query.
61.8% perfect Gartley
TLT indicators all pointing up. If retakes 200MA and stays above I’d say it will be a monster. Refresh.
Interesting how many energy stocks are down and while oil moved higher some immediately went green. Maybe the ones to own once this thing finally bottoms? REN, XEL, EOG, RIG, PEIX, NADL GDP, SFY? Some better than others,
Good pick up on the turn Bill.
I was in & out today and saw this post. It perked my interest.
Thanks, Even a blind squirrel finds a nut once in a while!
lol – you’re more than a blind squirrel, I see you hunting for set ups often
I like UGAZ at $1.77! Refresh for chart
nice Bill. Got in UGAZ for a quickie. Tight stop. Thanks
CRK may be ready for a bounce
Yup- good call, I see you posted that 3 hrs ago
We are still following the Dimitri 32 year seasonal gold chart very closely…..the early July drop is so far lower than the June drop as expected…next would be a rally followed by ICL low in early August….the one I would buy if all things remain in alignment.
http://www.seasonalcharts.com/future_metalle_gold.html
http://elite.finviz.com/quote.ashx?t=gld&ty=c&ta=1&p=d
Refresh and you may be surprised to see how the last 5 years in a row played out. Also 2004, 2005, 2006, 2007, 2009 also had lower June/July than Aug . I only see 2008 and 2010 play out lower in Aug
What indicators are everyone using to guess the bottom in GOLD-GDX?
Millions dollars question! ahaha
once gold blood is on the street…. soon I hope!
Ouija board
Is it time to get back into energy? or is it another one of those pop then drop days? Look at the chart of XEL, breakout? refresh
Hey guys
I think there are some great ‘trades’ in these reversals today for those traders that are comfortable with fast action. . many Energy mentioned here have hammers so far, LGCY & SGY look especially good- VALE is a nice reversal, FCX with Copper in the news everywhere , GASL, UWTI for 3x madness.
NOT for the feint of heart or those waiting for a reliable low risk set up ( You’d need follow through above the 10sma for that kind of feel that a bottom is in.
Thanks Alex. As I mentioned earlier, I like CRK and also EXXI.
Picked up EWI this morning. So oversold, outside of its BB last night.
China for a bounce?
Yes, I think MANY MANY things got cranked to the oversold extremes. And they did run the 200sma as I mentioned in my report that I was surprised they hadnt done that. Lots of panic, but you still have to be careful in extreme sell offs.
You can get a strong short covering bounce, or those pop & drop ( pop to the 10sma and drop for example).
…. wow …safe to come out now CF? kidding of course..
… but i will say thank u again for teaching me patience…it was nice just watching the bloodbath from the sidelines instead of sweating my *&^$# off while in it… actually.. it kinda reminded me of being in the batters box… waiting on that sweet fat, semi low & outside perfect pitch I luv to rip to shreds.. … yeah… “be choosy” we used to say……. works here too
Thx & great analogy .
To be honest, I kind of wish I caught a bit more of the short side , but waiting for a good set up pays off sooner or later. Its certainly a lot less stressful on the sidelines (I did do a little trading today tho) 🙂
Nice animation too – didnt see it till I refreshed
It’s usually my blood in there…glad it wasn’t for once!!
Check out CHK
I will mention this – HK is acting well and what I look for . refresh.
There is risk in everything, but low risk here with this double bottom, lows held, MACD rising in sell off, and good volume.
TPLM = Bullish engulfing
A couple interesting charts. CLNE completed an AB=CD pattern, Refresh for chart
BAS completed H&S pattern.
$3 dollar drop & $3 dollar drop. Doesnt get much cleaner than that, huh Bill.
sure makes forecasting easy… lol. ive been keeping an eye on this one and chaachaacheeeta … didnt quite ring my alarm [pink line] so thanx for posting Bill – I may have missed it otherwise ..https://www.tradingview.com/x/iCBRVyKB/
I saw that reversal today, but just sat and watched. This bad boy had just lost $2/share in a week, and I think oil heads down intermediate term so I let it go. Did you pick up any energy today? I watched them all turn green long before oil but just watched. I’ve lost money on every energy stock I’ve played (good track record with actual oil though).
I did get a few positions. Hopefully I don’t get stopped out today.
We may have printed the half cycle low today in stocks. When AAPL and IBB break down then the serious part of the move into the intermediate cycle low will begin.
Gary, what kind of target do you have for the full low? I played the reversal today with XIV. But I’m not married to it, looking for a few days of quick gains on that then back on the sidelines as far as S&P, NAZ are concerned.
It looks to me like the PPT has prematurely forced the half cycle low today. That probably means the full ICL will be mild. A move to the 38% Fibonacci retracement at 2014 seems most likely, unless stocks overwhelm the intervention immediately tomorrow and continue down. If that were to happen then I would expect a much deeper ICL, maybe even a retest of the Oct. lows.
It’s tough to fight an opponent with a printing press though, So I give the greater odds to the mild scenario. Tomorrow should tell the tale.
I caught the move down in SLV this morning. Did I know it was going down today? No, and I was actually quite surprised by the move. Pre-positioned just waiting for it. Did last week sound the final death knell for commodities in the bear market? Maybe PMs can “V” back from a horrible bludgeoning in a few months while oil gets it act together after re-testing the bottom? Plenty of divergences and clues out there, but continue to think that a final plummet in metals is coming, probably pretty soon.
Bounce not looking good here 🙁
Fed statement released at 2.