When things start to look a little “off”, or maybe something just doesn’t look quite right, it shouldn’t be ignored. You may be seeing cracks in the armor and those cracks can, in due time, lead to further break down. Lets review some recent warning signs pointed out here.
In late May and early June we discussed the Dow Theory – warnings signs were present.
This was the JUNE 4th chart
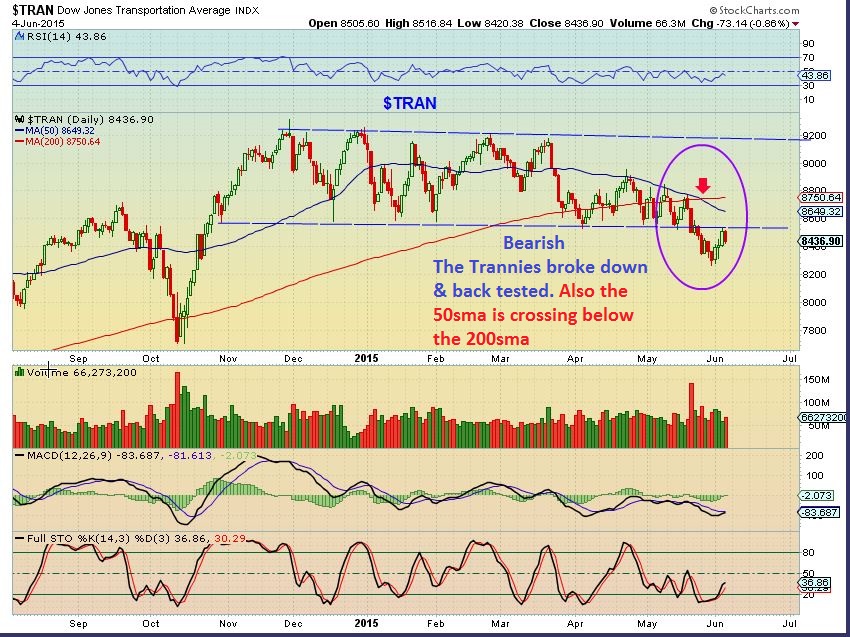
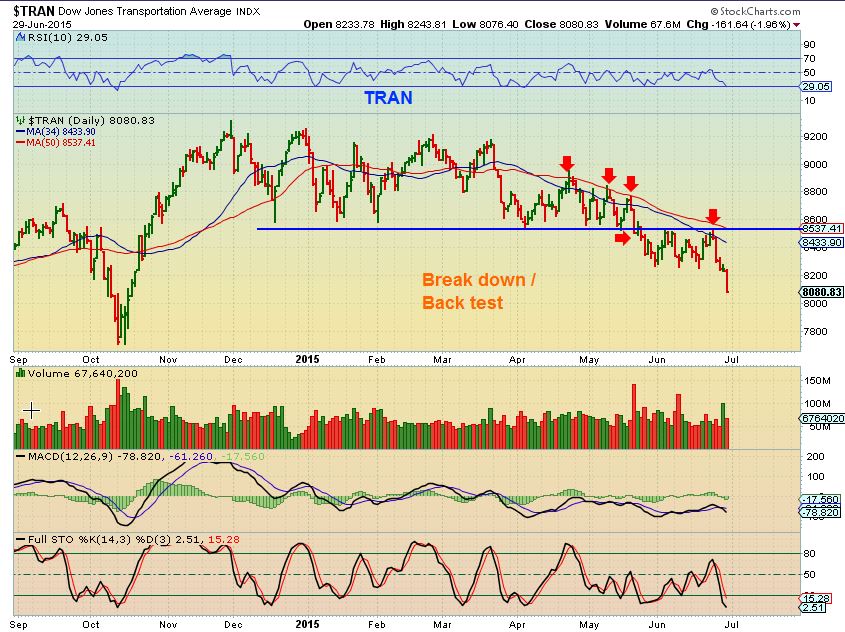
TRAN NOW-
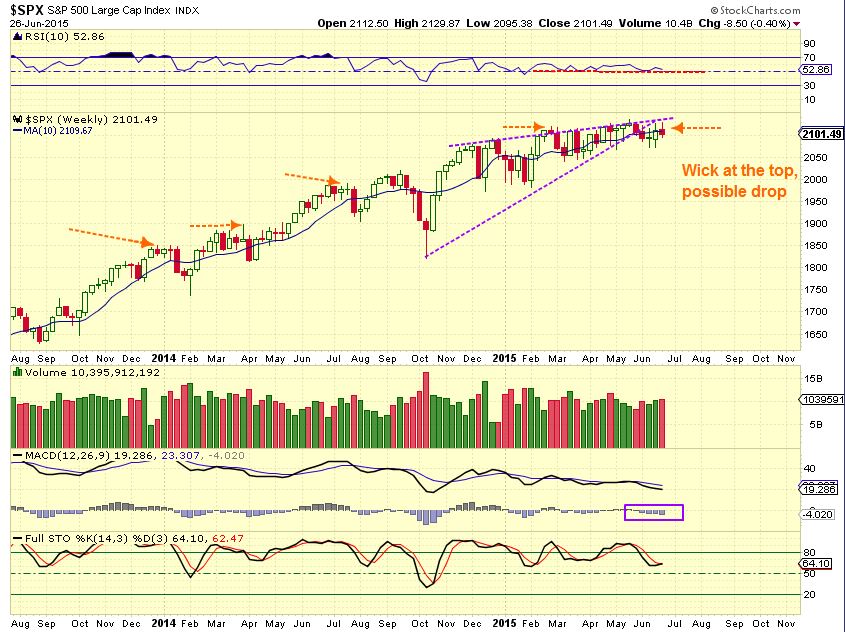
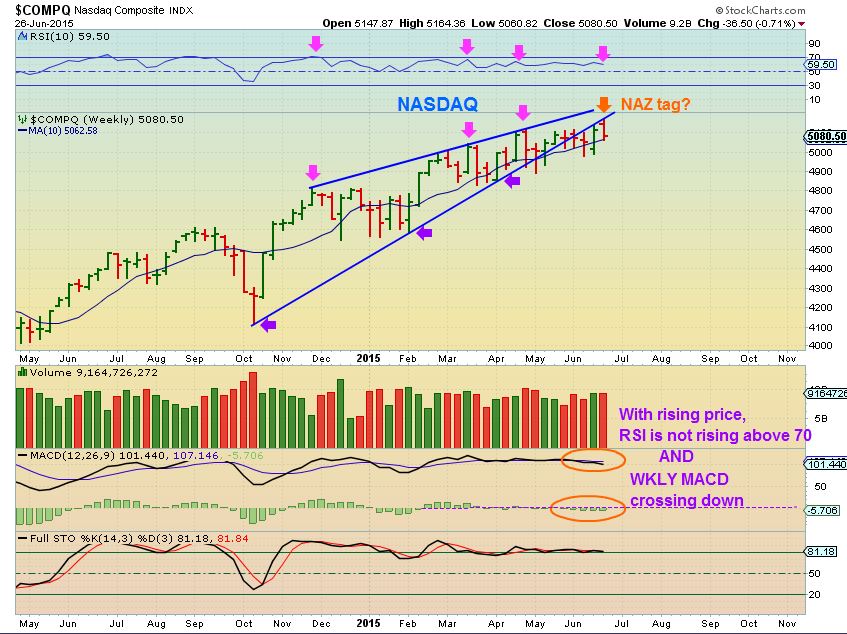
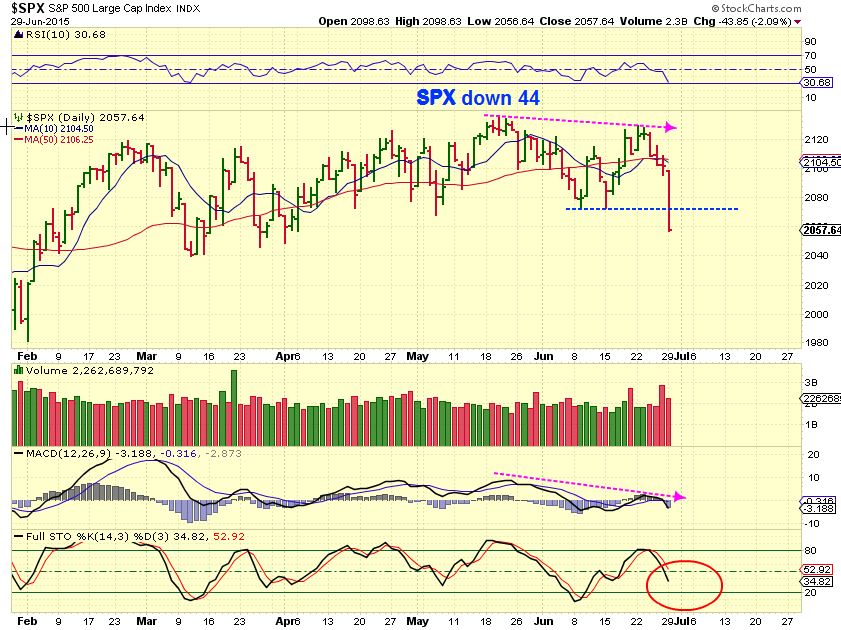
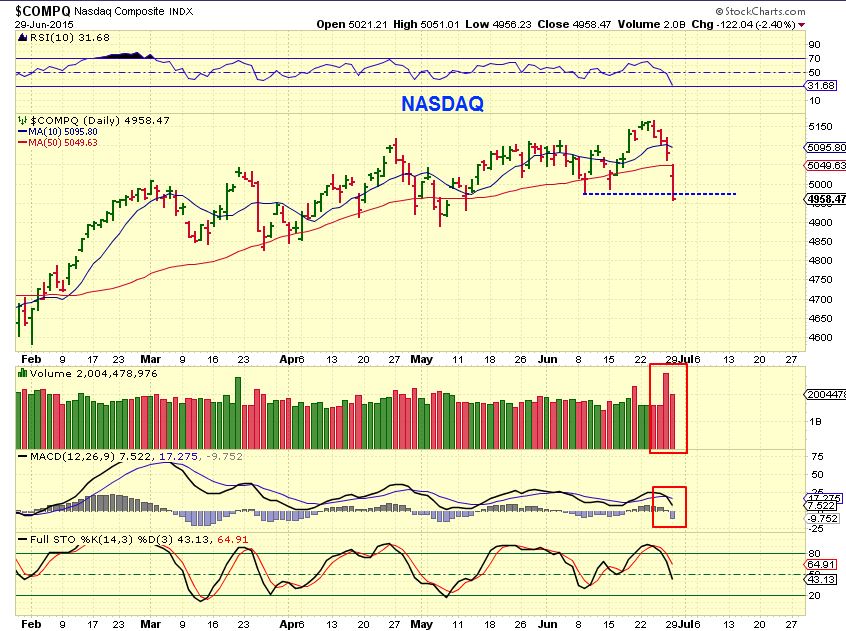
We’ve also discussed the wedges in the various indexes…
These 2 charts were in the weekend report, but I’ve been pointing this out for weeks
These 2 charts are the follow through ( yes, the Greek Crisis pulled the trigger). The futures are Green and there is “Hope” of a solution and recovery, yes hope of a “buy the dip” rally again. Warning: At this point it is wise to wait and see if this is just a back test of the break down ( see Tran charts again).
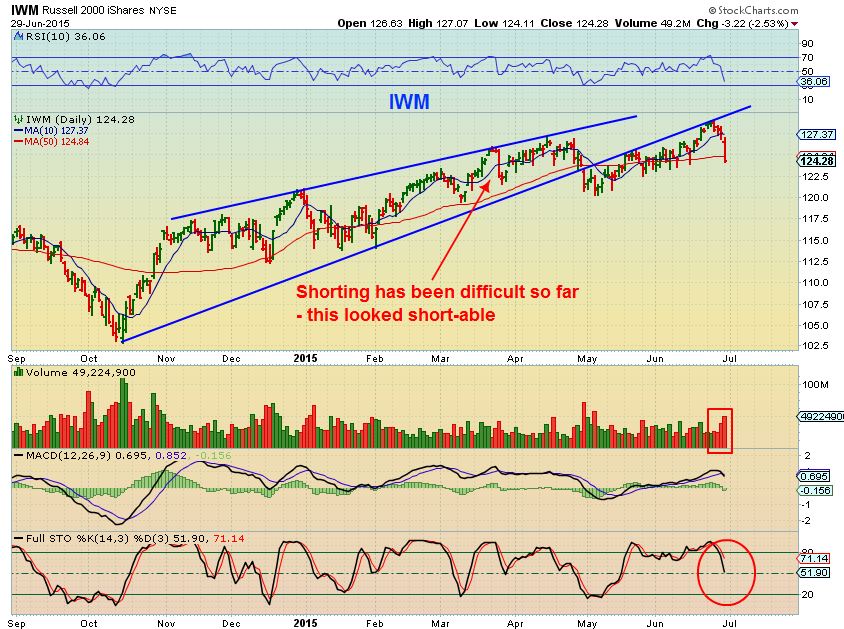
Even the IWM IWC, and RUT , which had broken to new highs got ugly. It looks like an easy short, but it has NOT been easy to short this bull market.
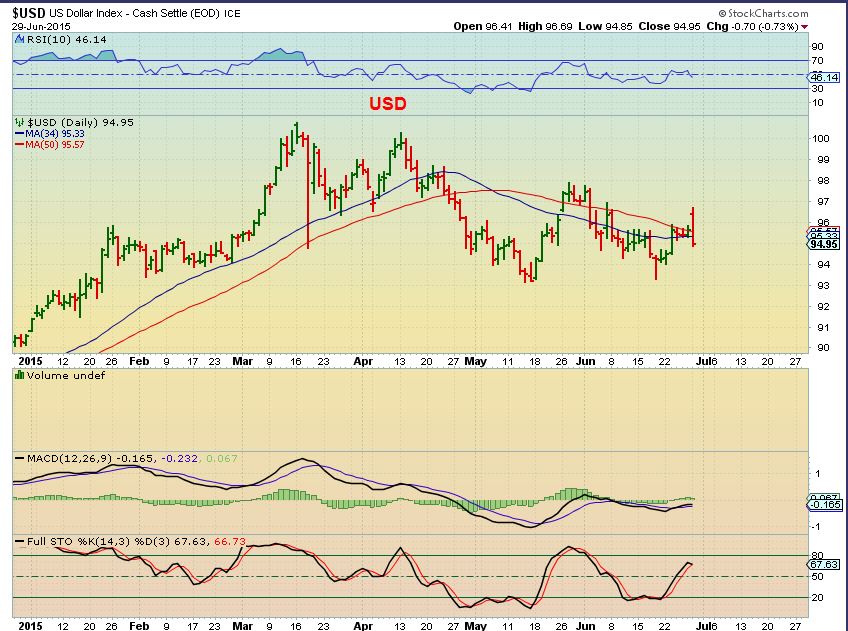
USD- Strong reversal back below the 50sma. Usually a bearish engulfing like this leads to further downside. This could have very big implications if we get follow through. An early failed cycle would have plenty of time before a low could form.
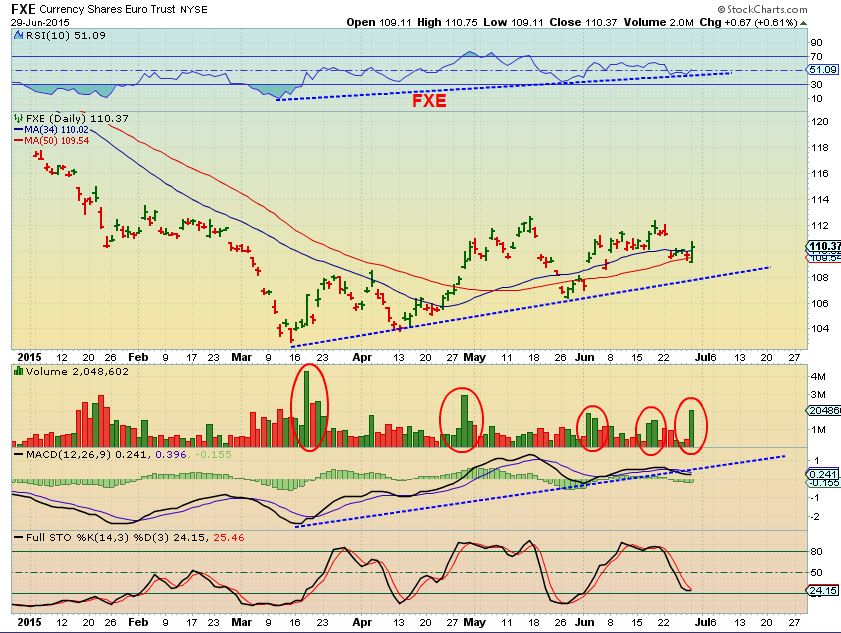
FXE – The Euro actually has looked bullish since March lows and many thought that the threat of Greece leaving the Euro would hinder the Euro. That looks like a bullish engulfing.
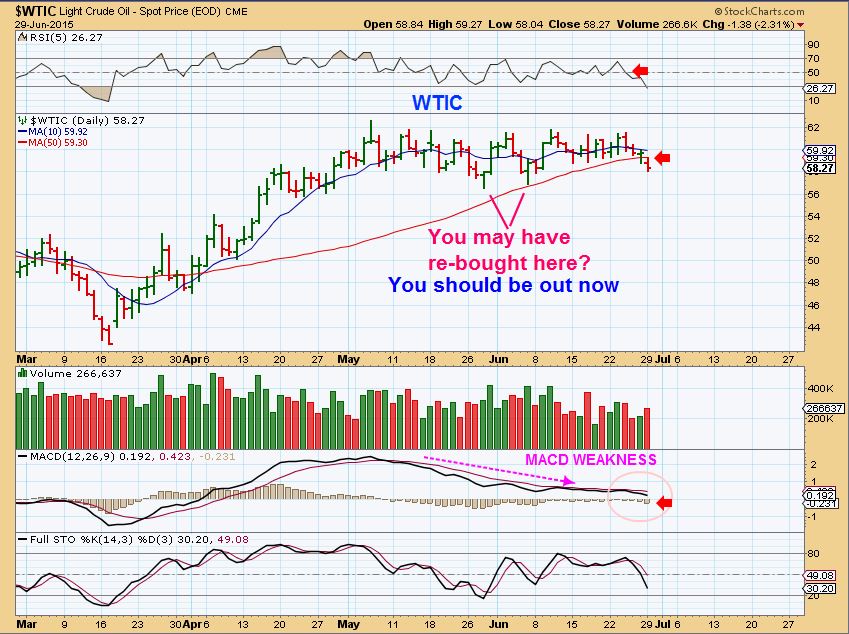
$WTIC- Oil futures are up, but the OIL chart also has warning signs. Energy stocks have staggered and I got stopped out of most 2 weeks ago or so. I am out of everything energy except SZYM so far. I am mostly cash , as mentioned in prior reports. Sidenote: Oil “Could” drop down to a 50% retrace and shake everyone out & then move higher, but looking at the MACD & RSI? It could just fall back to March lows too. That long consolidation should lead to a powerful move and if its down? Shorting or ‘SCO’ would be your trade (for higher risk traders).
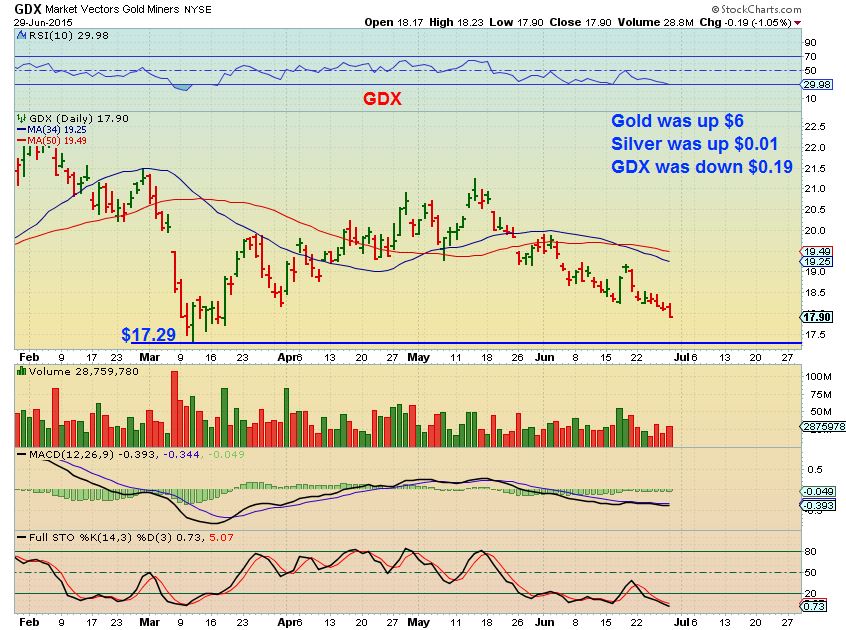
GOLD SILVER & MINERS
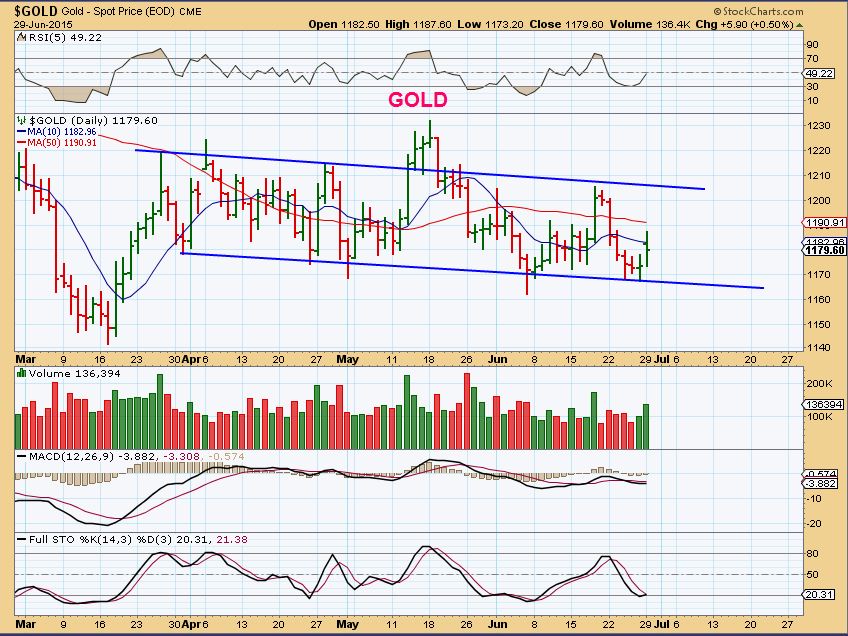
Monday Gold was up roughly $6 , Silver was up 1 penny, and Miners were down. I have been saying that Cycle timing indicates that we are in a 3rd daily cycle and that more downside is probable. I havent shorted it, because we have basically been going sideways for weeks . I see no trade at this point. Miners usually lead and they were down. Anyone jumping in long yesterday may get hurt soon. Those trying to trade Metals/ Miners in Yahoo blogs or other blogs or forums are mostly frustrated.
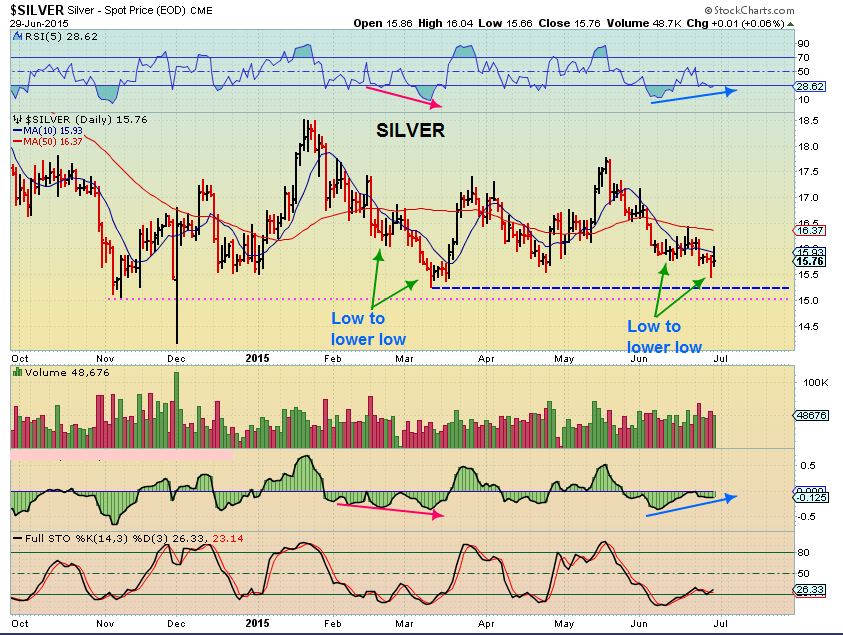
Silver – is actually showing an interesting divergence at new lows. I see this as a sign that Silver is possibly strengthening above $15.26?? We are above the November ICL. The March ICL formed higher than the Nov ICL. Can silver form another higher ICL ? That would be amazing amidst all of this volatility, but I dont want to get ahead of myself. I am watching many things at this time.
GDX – Miners were down while Gold was up $12+ at one point. You can see why I am not trading this. A good buying opportunity will present itself in time.
I am not trading very much right now. When things arent clear , or when there are warning signs of more volatility to come, it can be best to sit in cash and wait for the next low risk trade. Things are not crystal clear right now, but the Dow Theory does seem to be playing out here. The TRANNIES and UTILITIES lead the way lower, and we are now seeing follow through in other areas. Remember the charts in my weekend report too ( I will post a few below) – possibly more warning signs of things to come.
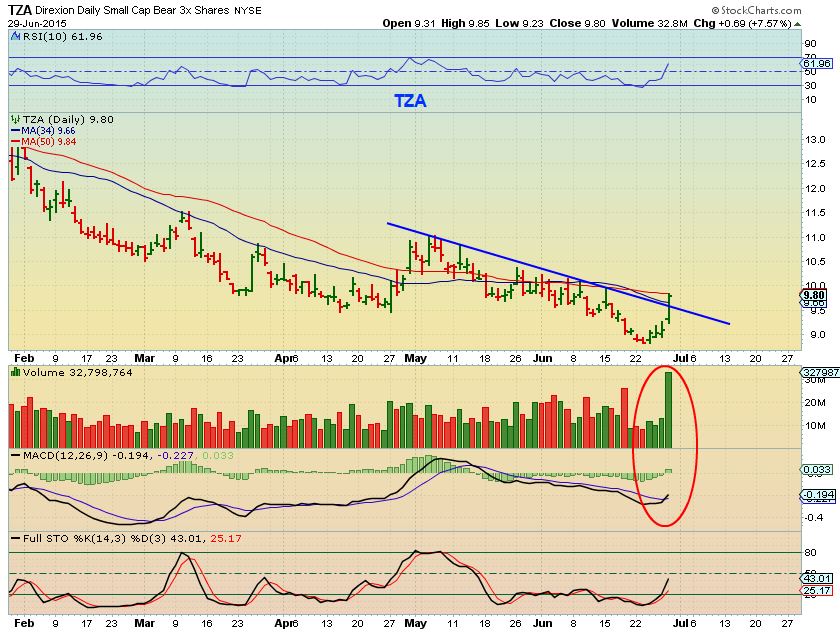
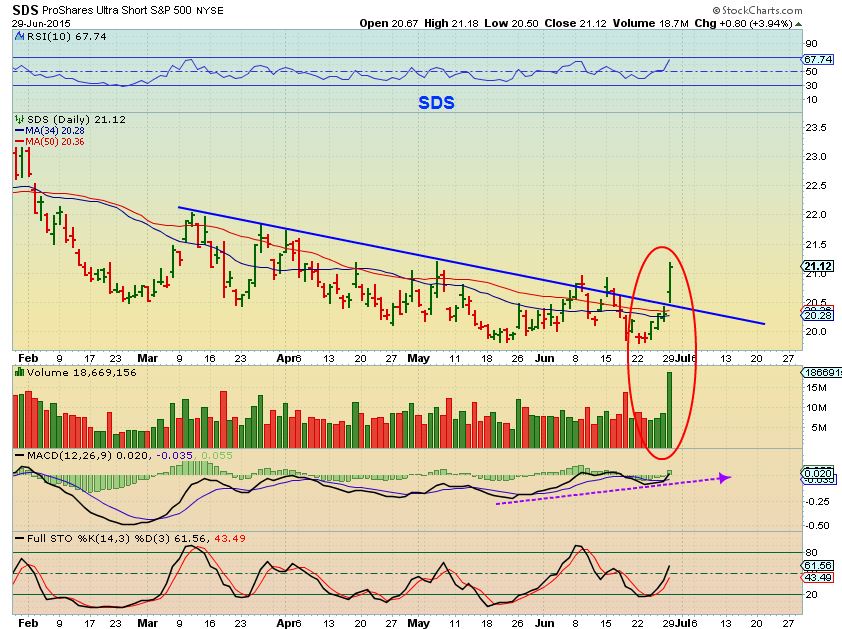
If the markets are going to do a simple correction of maybe 10% this summer, traders can play it by going short or using TZA, SQQQ, DXD, SDS, DRV, SPXU, SOXS, etc . They have broken out & may back test. Look those charts up if interested. Here are a couple of them
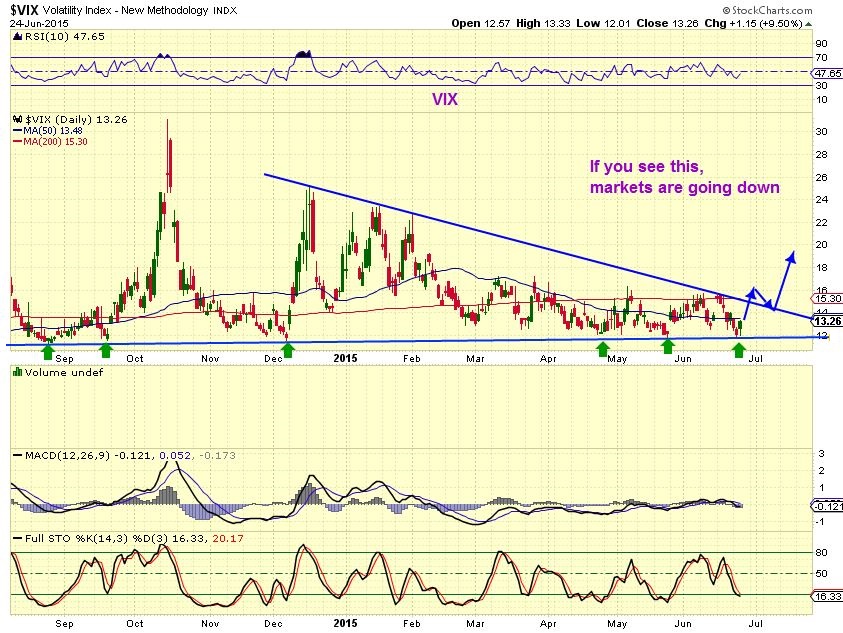
I also had pointed out also that the VIX may break out & back test and we could go short then. I posted this
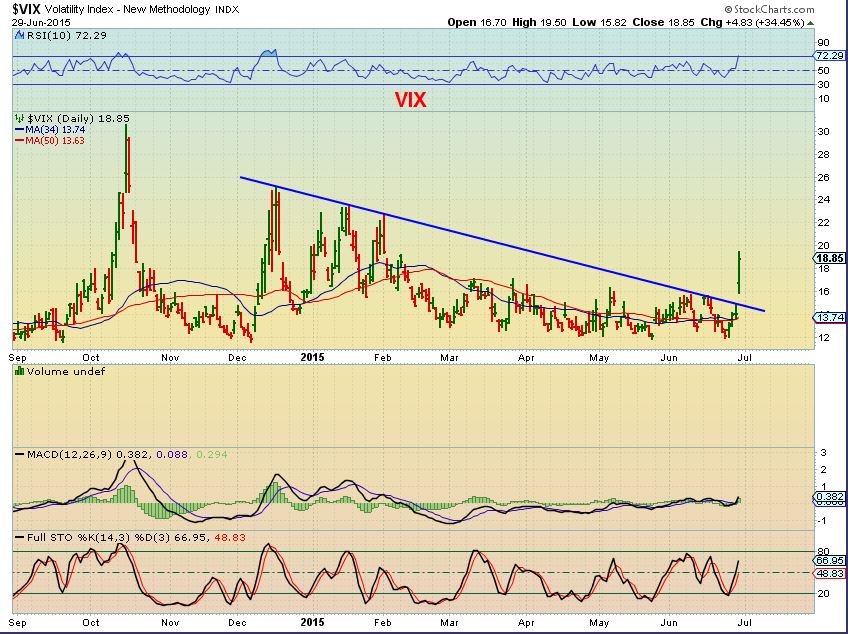
Well , we got this explosive move instead. This may be a bit more difficult to find a low risk entry. I am watching to see how this plays out. I would like to see the vix drop back down as the markets slowy rise and “test” their recent break down. Keep in mind that today may be the only day that we bounce, this may be the end of the buy the dip teams strong efforts. We could now see a summer sell off.
So today I am not really recommending any action, unless you yourself see trades that you want to take. JUNO got a huge boost from the FDA approval ( see that chart) and there are rumors of KITE being the next to pop. 2 Energy stocks did well yesterday ( BAS & CJES) – but how can I recommend them when the sector itself is in limbo? I will be watching the markets to see how things play out after such a volatile Monday. Keep in mind also that this is a shortened holiday week. Markets are closed Friday for a long weekend. What do you want to hold going into this weekend with the various threats to the markets? Terror threats on the 4th of July / Puerto Rico adding concern along with Greece, etc etc . Sometimes Cash IS King, patience pays off, and there is always another trade.
~ALEX
Weekend Report Bull Vs Bear 
 Greek Solution ?
Scroll to top

You didn’t mention USTreasuries as a potential buy / Summer hold. TLT up over 2.5% yesterday on great volume. TMF is 3x. Appears 10 yr double topped on Friday. That was the buy with a clear stop.
Yes, I didnt mention WHEAT, WEAT, CORN, etc , but they look very good too, even better after a pull back
Do you owe TLT JDWM?
Owe? Funny.
I guess you mean own. Would it affect your thinking if I do or if I don’t?
I own TMF.
Sorry JDWM.
No…. just see if I’m right I own the TLT.
Again…. sorry for misunderstanding.
No worries at all. Below Friday’s low is probably the Stop
Alex, whats your thoughts on using ERY here?
ERY (Energy Bear) currently
Too difficult for me to discuss buying in the middle of a move. I always wait for a pullback to the 10sma or something like it if its trending higher .
ALJ has been awesome thru all this.
WRES and EXXI are some ugly charts. REXX has held up so well.
RDS a double bottom. Could be a buy here with a tight stop
As bad as the energy sector is, Uranium is worst!
Very nice
Gossshhh -How many times NG dip to 50MA & bounce off ..its now an everyday thing !!! Every sector looks very tricky to “swing” trade . Great Blog as always Alex. Thanks.
I bought back into DUST yesterday. GDX broke the lower trend line, I expect it to at least go to $17.25 possibly $16.40. You’re right though Alex, I won’t hold over the weekend.
Not so sure it’ll drop that far. Miners seem to be holding up
Out of DUST
I sold DUST at profit yesterday, bought back today, couldn’t stay away. I think Jobs Report on Thurs could be rough for Metals/miners. Maybe that could put half cycle low in? Either way, plan to get out before long weekend. Too much risk to both sides.
USOIL, just thinking about this consolidation. If you go back to the same time frame a year ago and overlay the moves (the green chart pattern), its pretty close to what we are going thru currently. See the chart below. Alex, what are you thoughts? I know you said above to be prepared for more downside, certainly feels that way.
Regards bull or bear in general VIX has a clear huge resistance at 20 – downtrend since peak of 2008/09
Whats the ticker symbol for VIX on TradingView? Do you know? VIX doesn’t work
No idea. On Stockcharts it’s $VIX
Look at VXX Bill
Thats it Geurt, thanks!
VXX has horrendous contango issues, make it hard to chart over a few days. Maybe even hours. Look at VIX. but also at next 2 months out (helps to understand VXX makeup and contract roll). You can see front month and outwards on CBOE website.
VIX also has a rounded bottom since early 2013 to date. Something could well be afoot…
WMT didn’t hold the 2013 lows. Going lower? Wow!
Reversals in Miners look rather “REAL”, especially Silver miners. Caution if you are in Dust & JDST. I got an actual BUY in GDX earlier , but it may not be a long term buy, many are in sideways consolidations..
See EGO, SSRI, CDE, AG, FSM,
SA & CDE look “real”
Thanks for the heads up. I think when NUGT met that $8.12 price a lot of buyers bought in looking for a double bottom.
I have been staring at the Metals / miners all morning. Mixed signals , but they still point to strength in certain areas. Draw a trendline along the bottom of CDE from March and it shows an ability to trend higher, even while in a 3rd daily cycle. (I’ll attach a chart, refresh)
.
Usually in Miners you get the heavy sell off in price when you have that heavy volume such as last week.
Good observation
Yeah, some are showing what I would call ‘interesting’ signs of bullishness at a time when they should be weaker or even being sold off rapidly. CDE, PZE, TRQ, BAA, GSS etc recently, but also RIC , LSG, since 2013
Some are sideways , but also not really breaking down when you would expect to see weakness (SA,EXK, etc)
Yet Others ARE at lows (EGO, AUY, etc )
Its a mixed bag, but better than what we used to get….complete slam down in the 3rd daily cycle . If we get a 4th daily cycle, we’ll see if they can hold up then.
Why is it, GDX has two lower points, yet NUGT has already reached historic lows? I would have suspected the opposite with decay.
The decay is in NUGT, so it drops faster.
An example is that if GDX went sideways for 20 days , starting at $22 and only going to $23 and $21 in between, but lands on $22 after 10 days, Decay would cause NUGT to start at ( lets say $10) and land lower than the starting point 10 days later.
GDX $22 to $22 in 20 days, NUGT $10 to $9ish
Right, but we have lower lows in GDX, not NUGT
No, it’s new lifetime low in NUGT today. GDX is $1.3 off 52 week low. If GG doesn’t improve GDX has no chance.
major resistance around $5.82 for CDE…..
not sure I buy this rally.
I dont follow? CDE was at $6.35 2 weeks ago, I dont see the major resistance
yes, the resistance stopped CDE today (day high $5.85).
I just will feel better once this level is conquered
It will be by the close. see a 15 minute chart 🙂
Are you in? or just looking 🙂
Scalped NUGT for a trade. I got a short term buy signal on GDX at 11 a.m., so I got into NUGT and sold the double top ( on a 5 minute chart) when the MACD didnt confirm the second rise, but I am watching closely
same here. Love NUGT for a scalp.
long CDE here, tight stop.
Yes, keep it tight. I thought we would get a day or 2 bounce in Miners (like a 1/2 cycle l bounce) , but it still seems to early for a daily cycle low in Metals to be in
CDE failed at resistance 🙂
not sure about tomorrow. It’s sitting pretty on VWAP.
holding overnight.
/NG is firing up
fwiw……
Harvesting VIX profits if it is below upper BB line at the close, that would be a SM Buy signal.
Harvesting WEAT profits.
‘Harvesting Weat’ –
🙂
That’s just corn y
C’Mon JD, dont ‘Sugar” coat it, what are you getting at
Speaking of Sugar (SGG) that would have been a good buy last week too….missed that one though. 🙂
Yeah, agree.
JO (Coffee may be close)
Concur.
Waiting for that upper trend line break though.
silly boys…
Refresh for the price of popcorn at your next movie
.
Turn in commodities? Wouldn’t you expect Gold, and Oil to tag along?
Good question. Very strange movement in the various markets though.
If it were a meaningful rally higher in CORN, WHEAT, SUGAR, etc , I would expect them to eventually. The dollar truned higher today and UUP has strong volume, so its hard to tell with the possibility of a strong dollar here.
tee hee
DBC, is it for real?
Shoot….missed that break out…..might come back to the 50 sma ?
I hope you took that one LeChiffre. btw…..we need to find you a nickname I “always” miss spell your avatar name….lol. 😉
Call him Lee?
What about DAG…I like that bullish engulfing, but I hate that low volume ETN
Yes, same here. Volume sucks.
Call me Xman (my name is Xavier)
Done ! 🙂
Magneto? Xavier?
Magneto’s nemesis.
Prof X
But you knew I would ask that.
I will be taking this trade if SLV can break that upper trend line….not before ! imho 🙂
I agree, do you use the PSAR to trigger trades or just a reference?
I use it as “Verifying” my position and I also have used it as a Stop at times. Rarely do I use as a trigger.
BAS…. in limbo (refresh)
I like that bounce off of the 10sma.
Meanwhile REXX continued higher.
Most else was not so pretty
REXX has really held up
REXX is doing it. (don’t own it…, own REN…)
REXX looks good, but I got stopped out lower 2 weeks ago, missed this move so not chasing now.
REN selling done? (chart)
I got to tell you, I don’t trust this. Today is nothing more than one of the pop days we have seen since May started. Oil up stocks up, Oil down stocks down. Too hard to pick a bottom. We are right in the middle of the bull flag that formed in USOIL. We won’t get a breakout until oil hits $62. IMHO
Alex, I can’t wait to read tomorrow’s report. I can’t make heads or tails out of all the movement today.
CRK, selling done?
Wait for $3.23
Thought I would note that the moves in currencies were due to an intervention by the SNB trying to artificially prop the euro up. The big pattern is a T1 in the dollar with the move only half over. Once the extended consolidation has run it’s course we should see the dollar rally to 115-120 by this time next year.
This might be the driver to push stocks down into their 7 year cycle low.