Lets get right to it, this was a BIG move Tuesday…
$USD
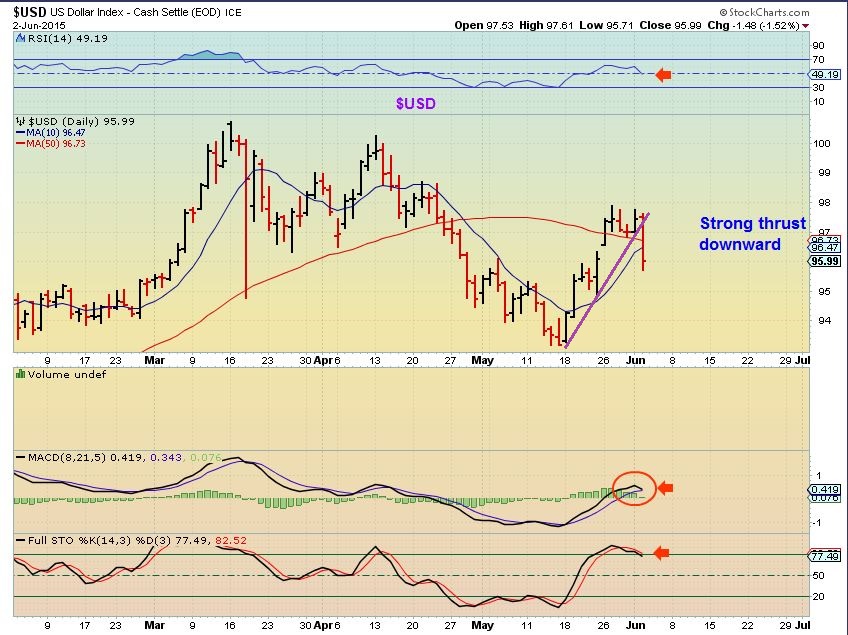
Interestingly, there really was no big change in the DJIA, SPX, or NASDAQ, so I have added no charts of them. They ended a little down , however….
The Commodities reacted favorably-
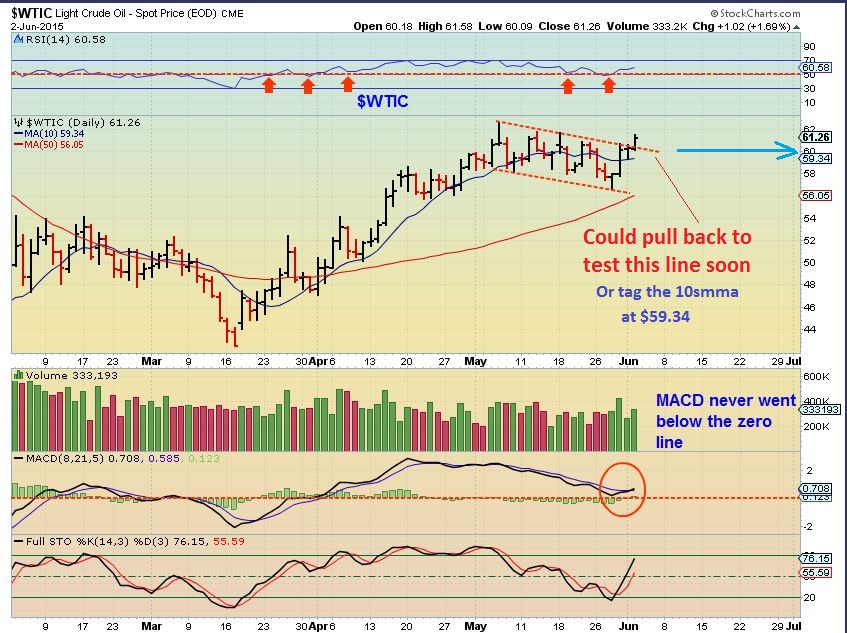
$WTIC- Oil has been bullish and I expected follow through ( though you will get pullbacks along the way).
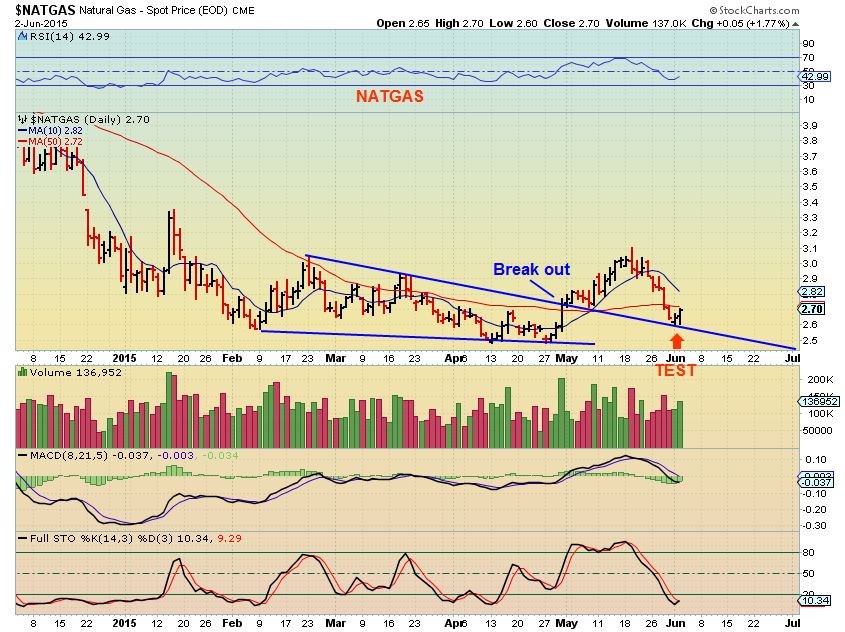
NATGAS – This triangle trend-line was drawn May 22 as a possible pull back target. Test the break out.
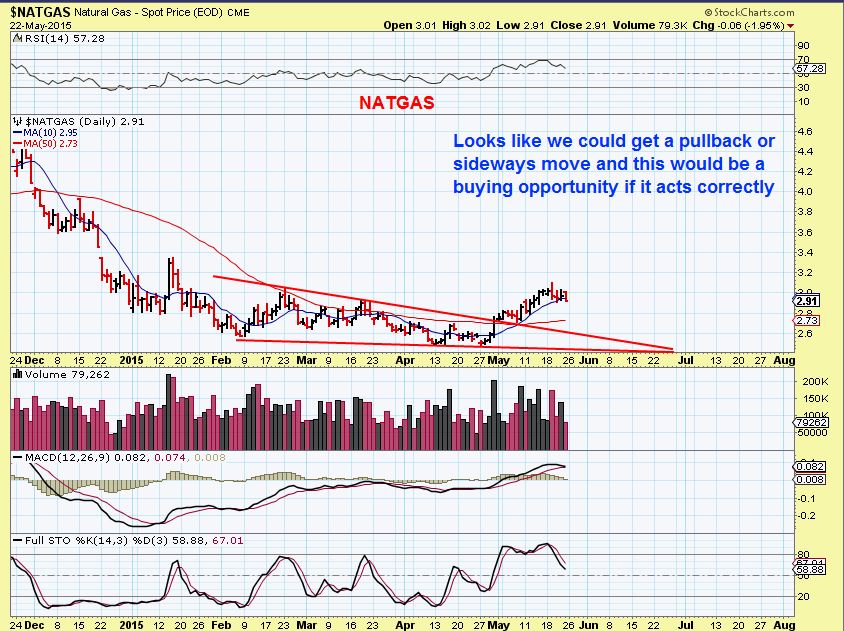
In Mondays chart below I said that NATGAS often has a couple of days at the lows. This was a low risk buy
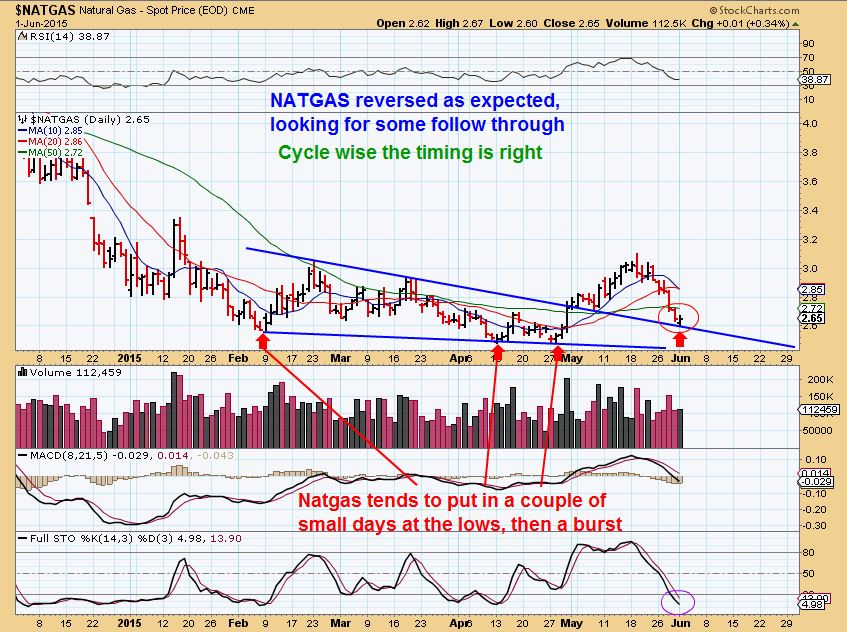
NATGAS – June 2, we had our second day reversing higher and this is a bullish chart. Pushing the 50sma (resistance)
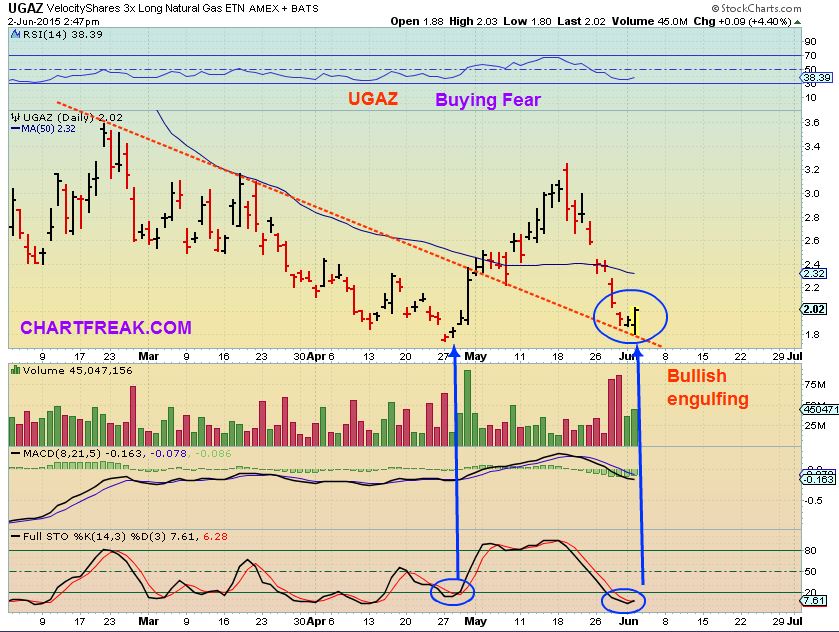
UGAZ- This has a bullish engulfing candle / Reversal. It is a Buy.
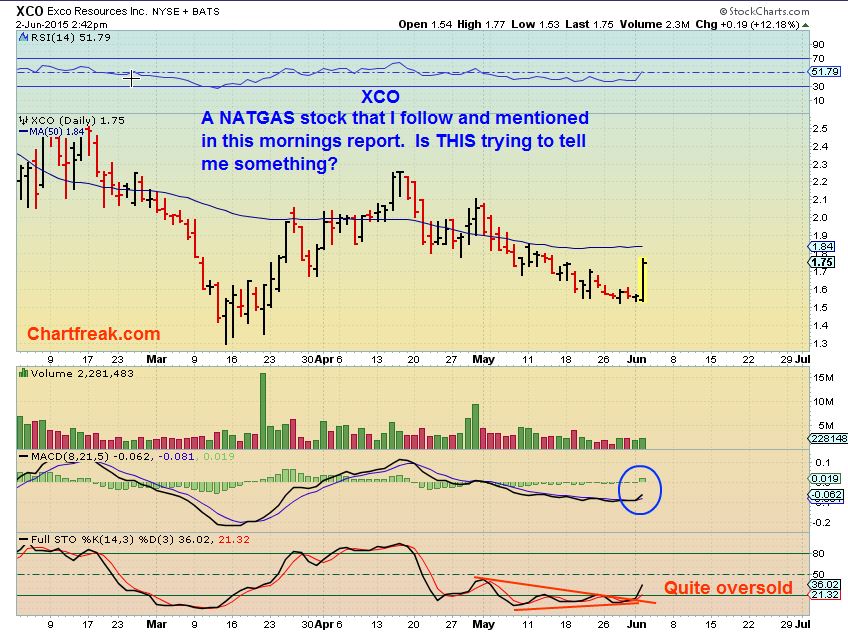
I mentioned that XCO is a NATGAS / Oil stock that I watch with NATGAS, Nice reaction.
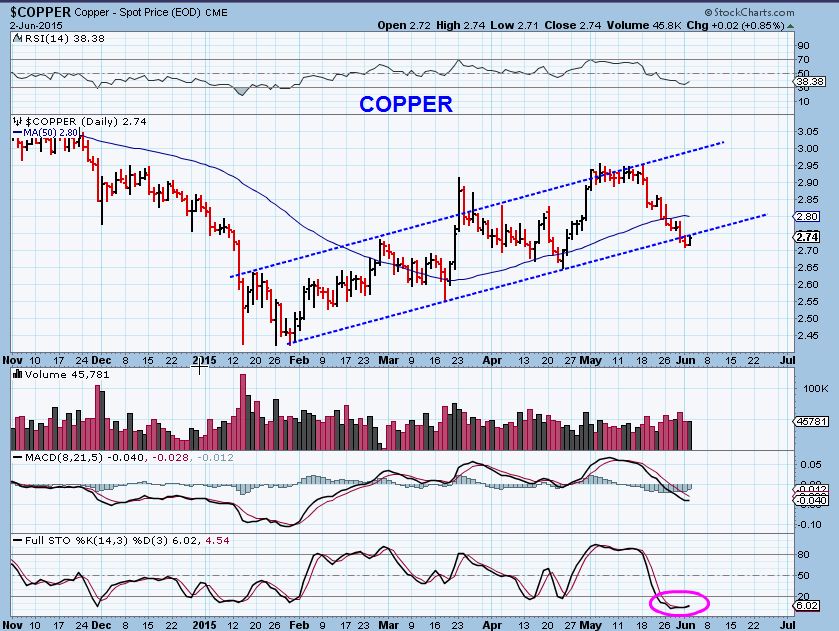
This was COPPER on May 22. I mentioned how quickly it had dropped and I was watching it to see if it was rapidly breaking down.
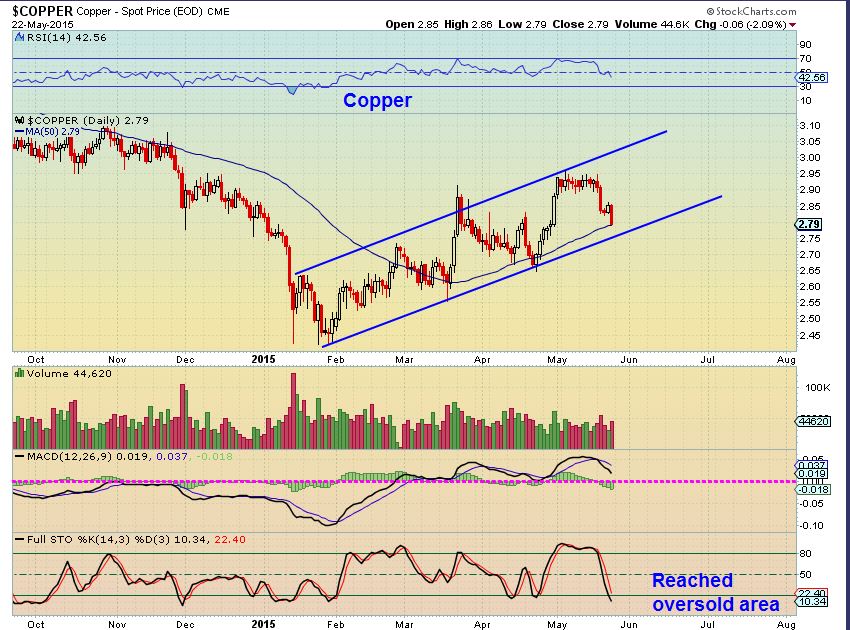
COPPER Tuesday June 2 – the selling slowed down and now it is really oversold. That was a small reversal Tuesday. Will COPPER recover?
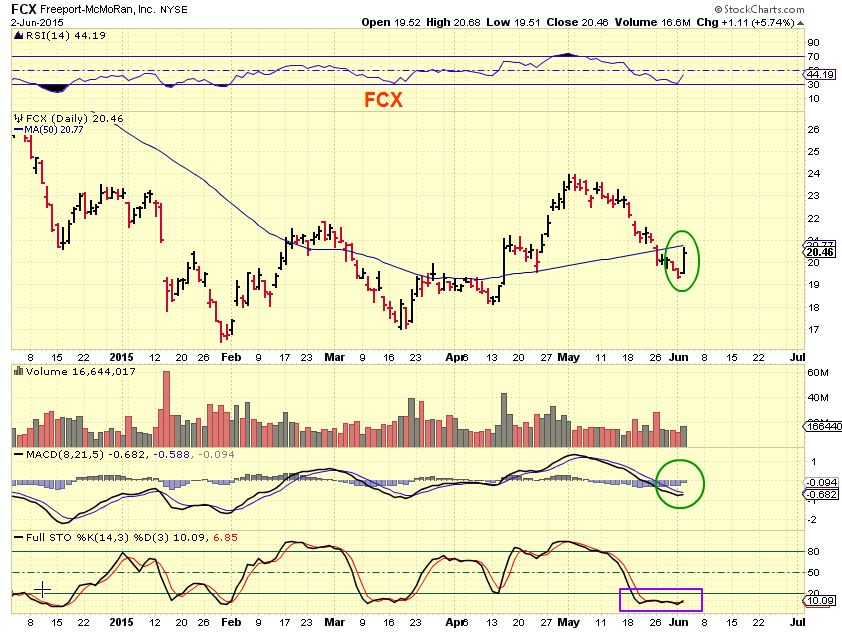
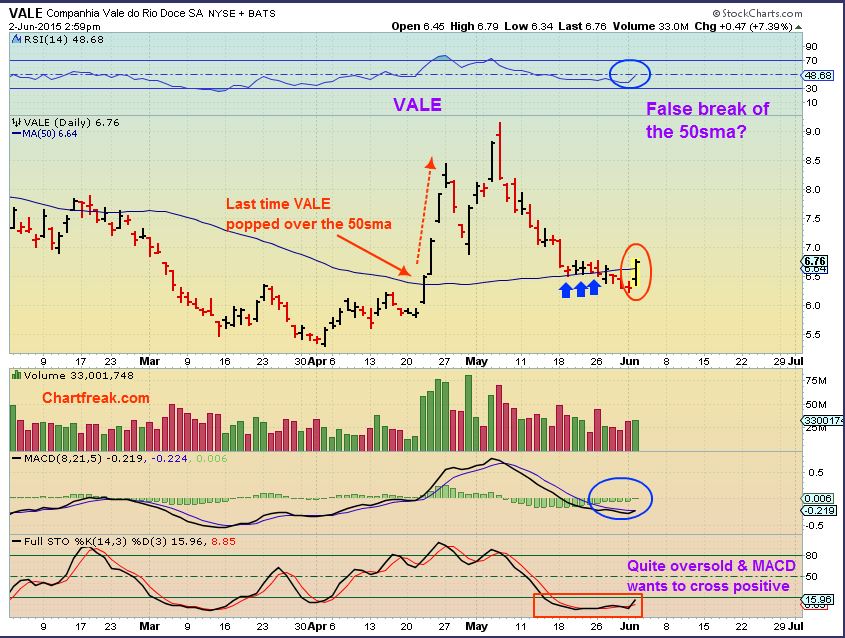
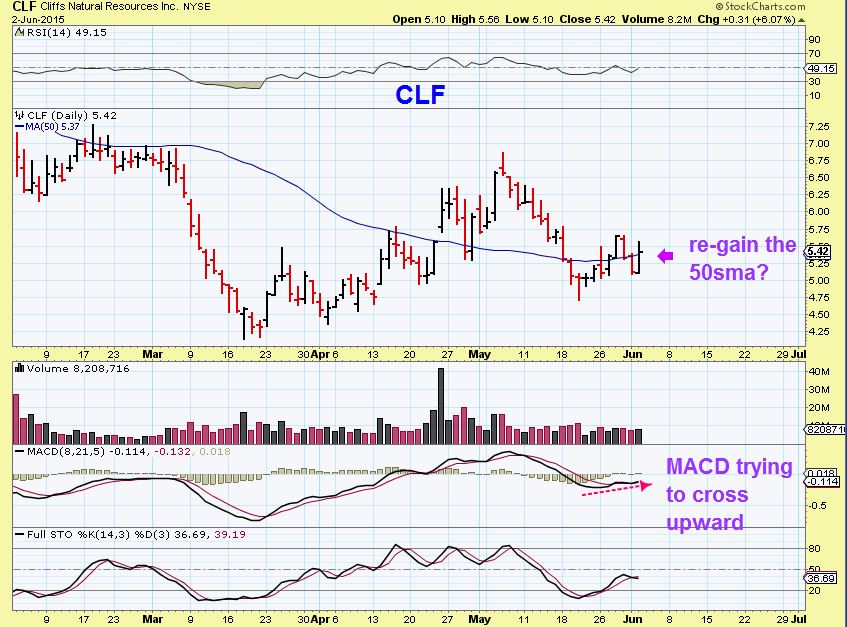
FCX – A Copper / Gold Miner. Is this leading Copper? That was a strong reversal and it could re-gain that 50sma
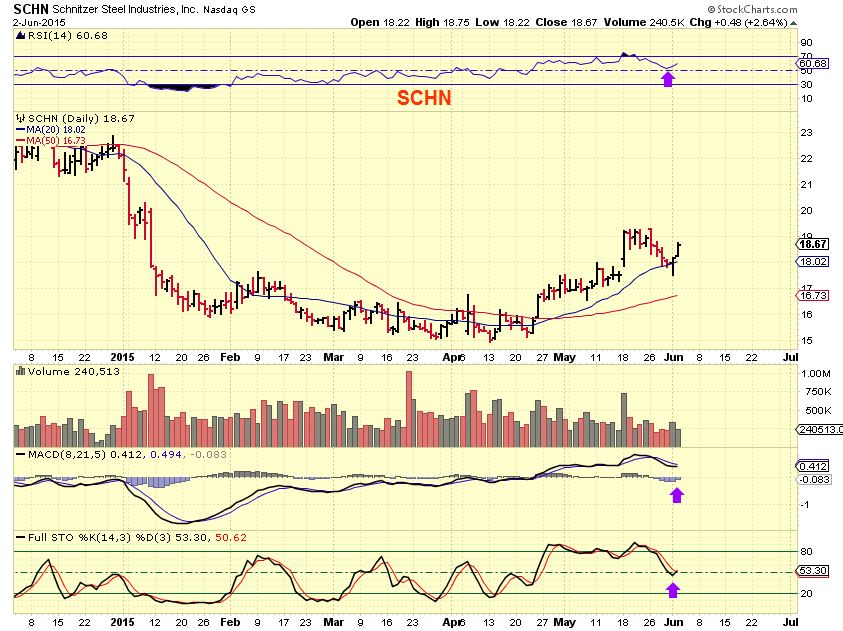
STEEL – very nice move in steel
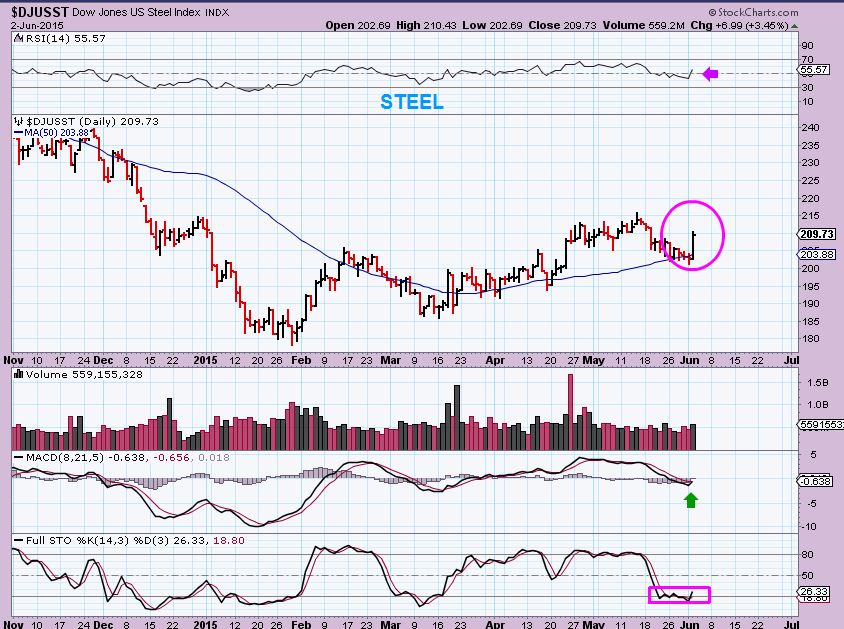
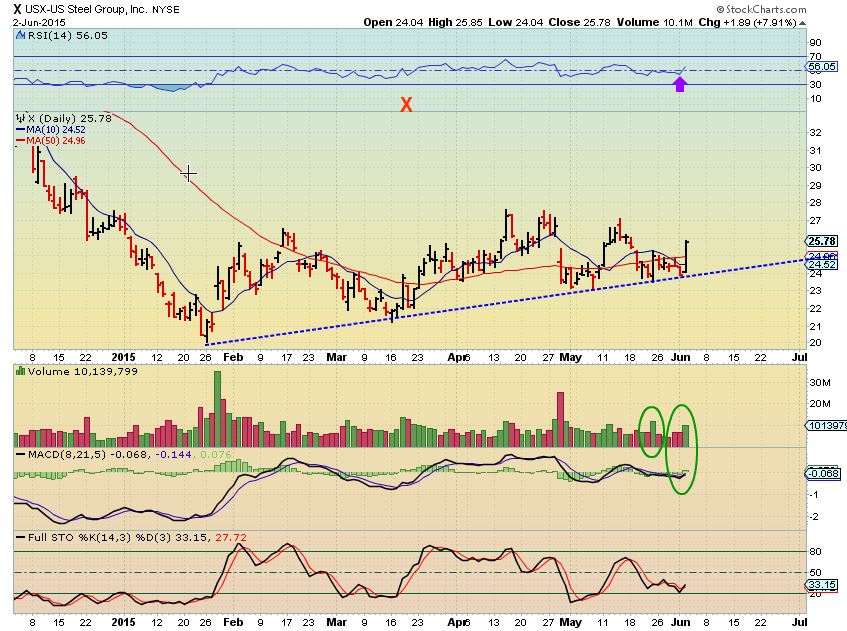
STEEL STOCKS like X, SCHN, AKS, ZEUS acted very well
Other commodities also reacted very nicely.
And then there was GOLD/SILVER /MINERS – Lack-Luster and disappointing, but not unexpected. I havent liked the overall look yet and mentioned that I wasnt taking a position yet. The large drop in the dollar lead to a gain of $3.90. That was quite a Muted reaction. 🙁
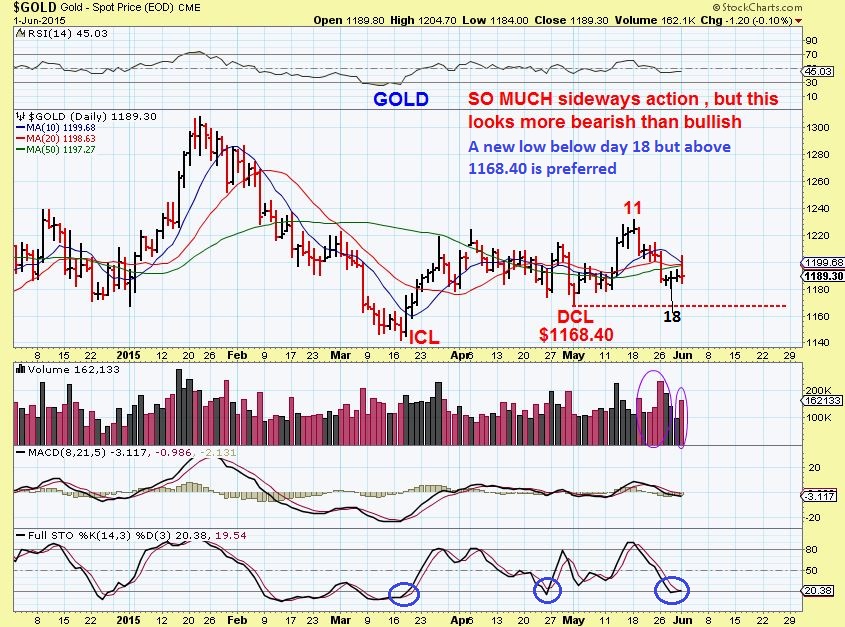
Gold June 2
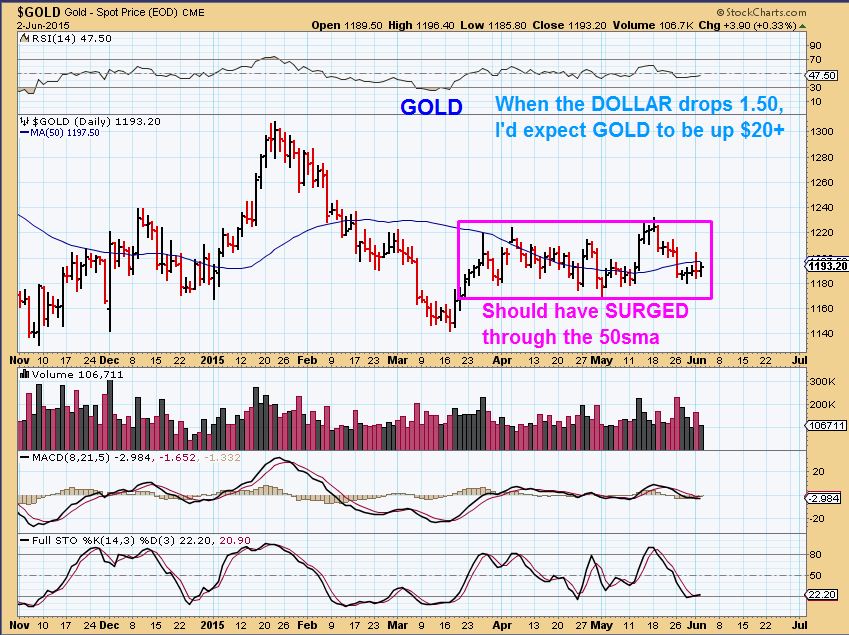
JUNE 2- GOLD appears to have formed a daily cycle low on day 18 as shown, but after todays minimal reaction the the Dollar drop? I wouldn’t be surprised if we are on day 21 and just go sideways , bounce around, then drop giving us the real daily cycle low on day 20-something.
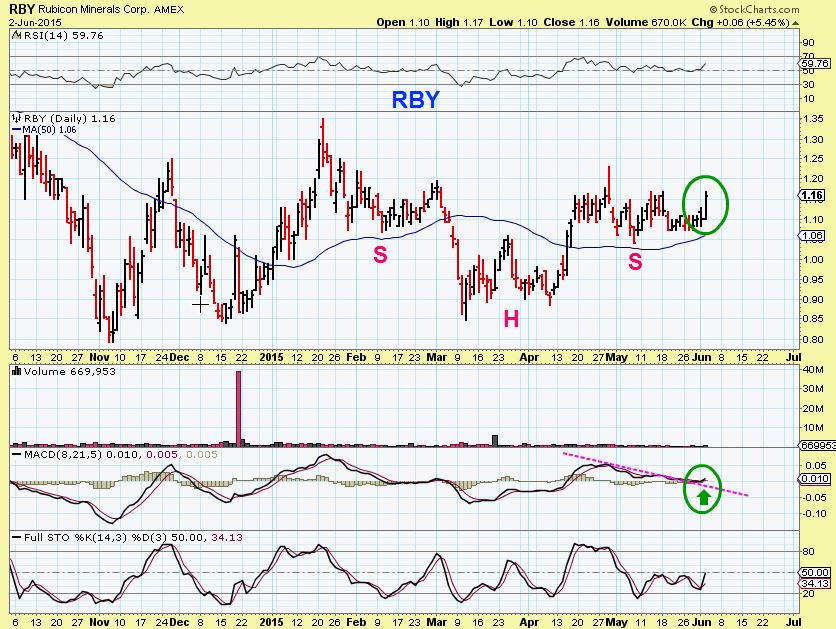
I keep mentioning that various Miners keep forming bases and Bullish patterns. I wasnt impressed with GDX at all today, but a few miners did look interesting. RBY, TC, FSM, HL, and many others have long consolidations and what look to be constructive bases.
RBY
So at this point I want to again mention what I have discussed at length in prior reports, especially weekend reports. In 2015 , We could be seeing the early stages of trend changes. Many commodity and even GOLD/SILVER stocks have been forming some really nice set ups and long productive bases, Weekly wedges, etc . EVERYONE is waiting for GOLD to drop to $800 to $1000 and yes it can, but when EVERYONE is saying they cant wait to buy down there? Often they get left behind by design. OIL, NATGAS, STEEL, ALUMINUM, the CRB, and so on may stealthily be under accumulation and the $USD may be stuttering at highs. Time will tell, for now the trades may be buying pullbacks in OIL / NATGAS / STEEL / ALUMINUM ( CENX, AA).
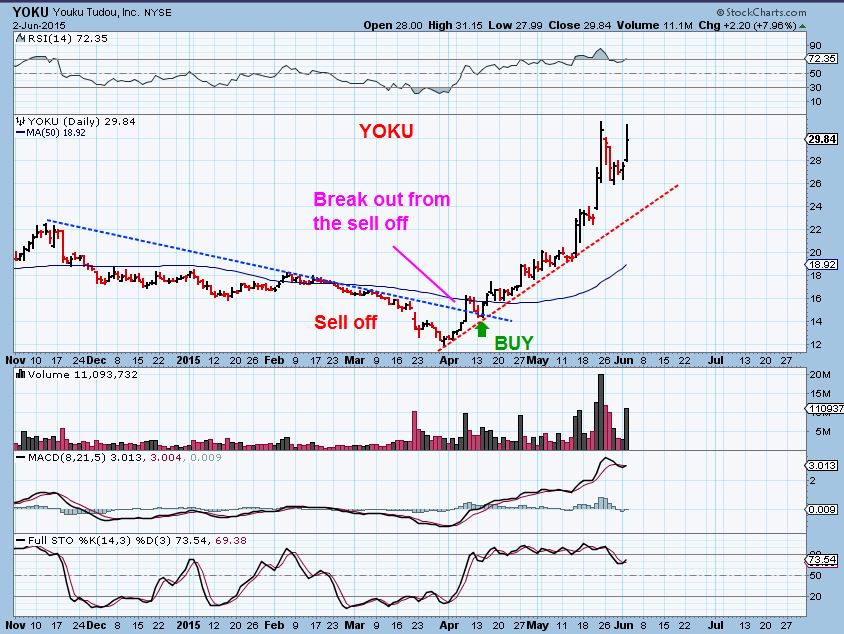
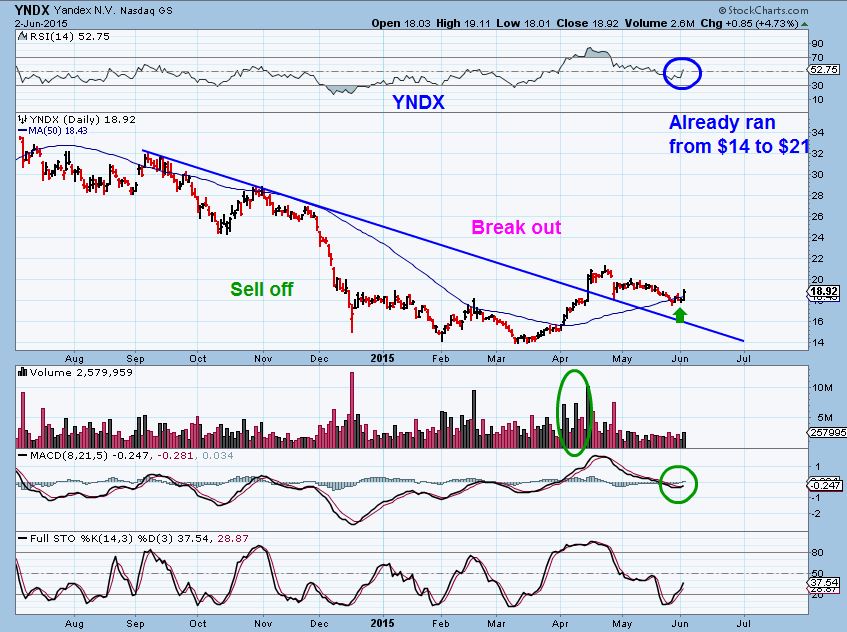
The TECH and BIOTECH stocks are currently popping and traders are trading those. I have shown several set ups. The ones from yesterday did well and are still valid. While the markets (DJIA, SPX , and NASDAQ) have mostly gone sideways this year, trades are being found. Many China Tech stocks are running strong after pulling back. I posted in a list of buy set ups that included YOKU & YNDX 2 months ago . YOKU took off like a rocket, lets compare it to YNDX Now ( I also have a warning about the Shanghai posted at the end of this report, 🙂 but this set up is for traders)
YOKU – it broke out from a sell off and tested, then ran. Huge gains $12 to $30.
YNDX- similar set up. This already ran from $14 to $21 and has pulled back. Above the 50sma, it is a buy with a stop just below, target $26 area.
As I write Futures for OIL are down over $1. It is still a bullish set up and I believe OIL has plenty of upside, lets see if the XLE & OIH and some of our energy stocks can resist the selling. Have a good Trading Day.
ALEX
LESSON:
I want to show you an explosive wedge pattern that no one wanted to buy. It was a long base & a wedge pattern on a weekly chart. Rumors last year were that China was DONE. I have mentioned here quite a few times that buying after a sell off isnt always easy , but if you are catching a move from a base the %-Gains can be rewarding. Last Summer I had posted the SHANGHAI chart when it was hated, but it was forming a constructive base & wedge pattern after selling down. Here are two versions of what happened after that break .
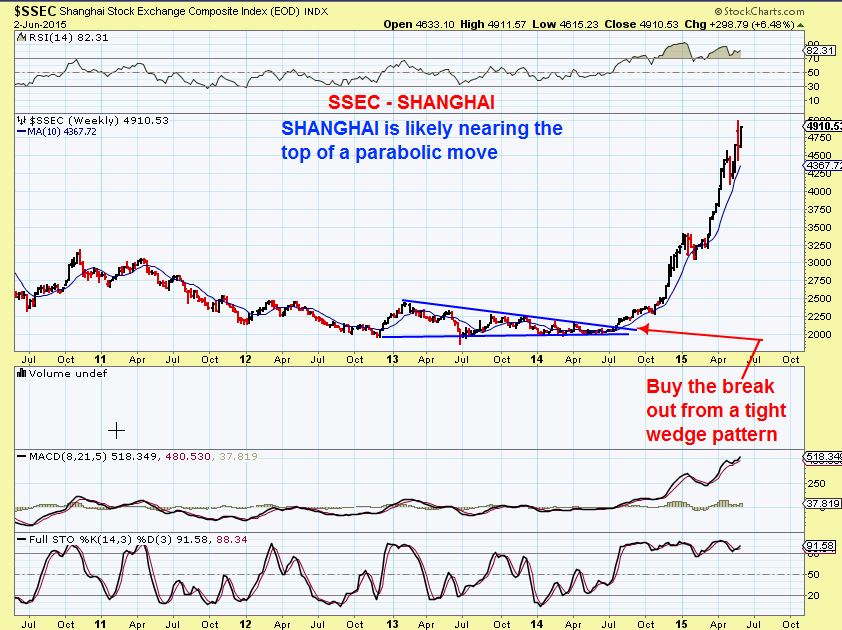
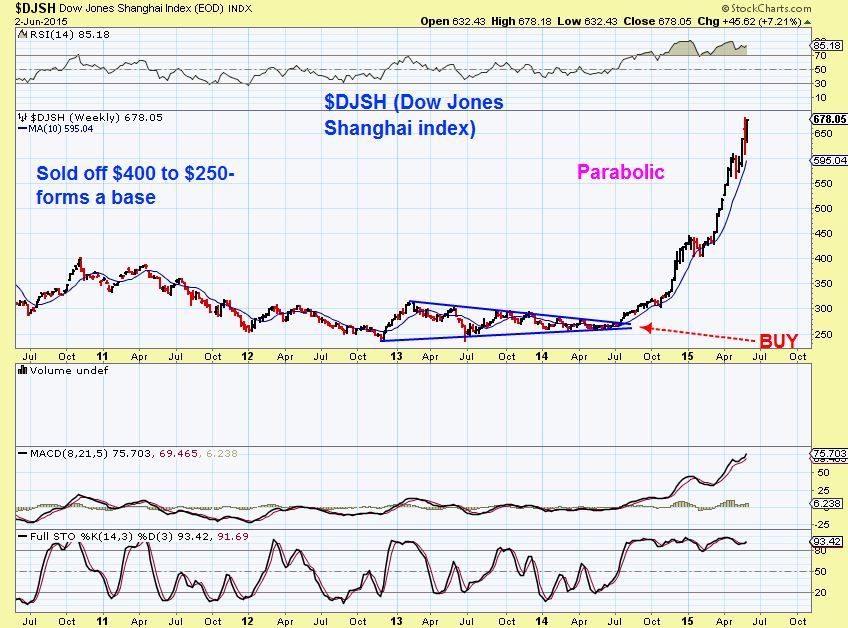
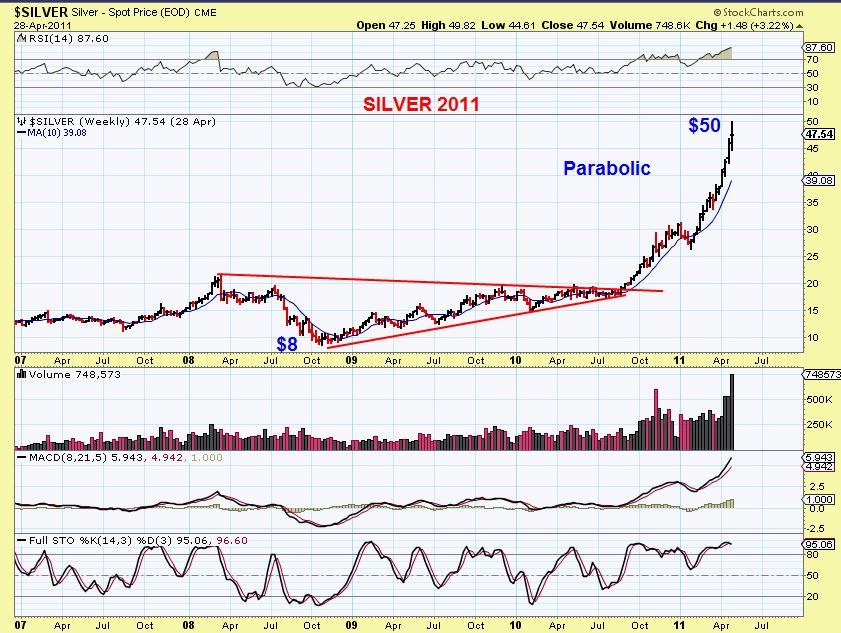
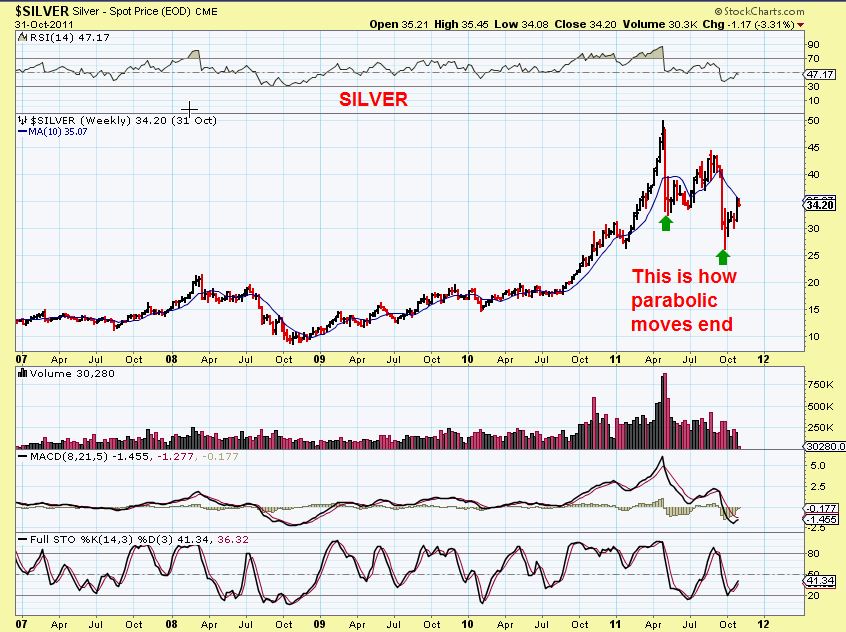
Some people want to be in the SHANGHAI market now, they feel they are missing the move. Buying it now is extremely risky, since it is looking like a parabolic top. There may be more upside, but you can wake up one day and see a slam down, since that is how parabolic moves end. You may remember the ‘top’ of the parabolic move in SILVER as shown here. Silver was so breath-taking in its run higher, that many felt they were missing the move. After waiting on the sidelines for weeks, they bought near the top. lets see how that worked out .
SILVERS parabolic move. Looks a bit like SHANGHAI now, doesnt it? If you saw this would you feel you needed to get in ? Missing the move?
A week later SILVER crashed form $50 to $34. Parabolic tops are dangerous.
SO I like to look for PROPER BASES as they are forming and Buy Low / Sell High , or trade a stock that is trending higher that has already emerged from a base. My point? You may be seeing bases forming in various commodities now, as smart money accumulates positions low for the ride higher later this year/ next year? Many Miners are great looking bases .
LESSON 2
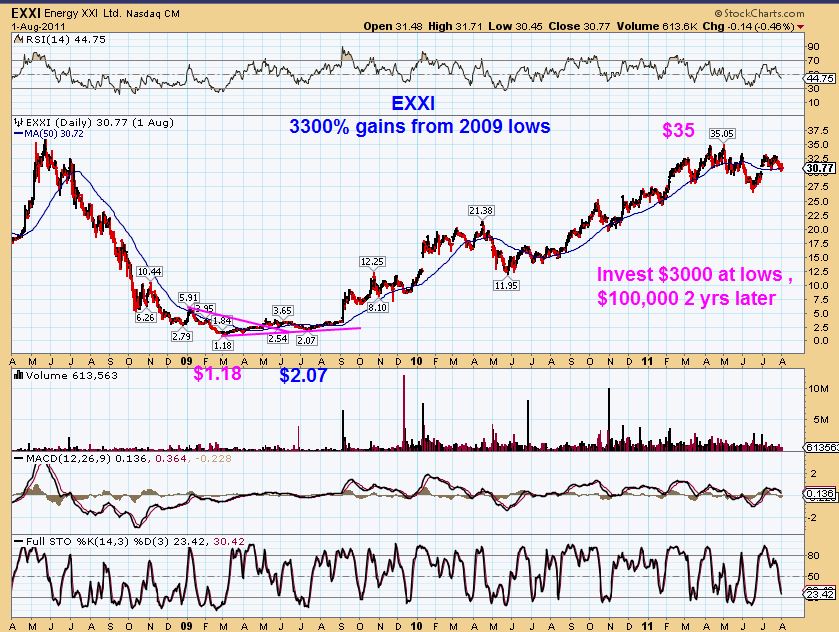
For my newer readers I have shown this chart several times. I want to share a different view. EXXI in the 2008 sell off. The company was sold off to an extreme and formed a base from Jan 2009 to AUG 2009 as it went up & Down from $1.18 to $3 (like many oil stocks now). IF you bought $3000 worth and put it away and held on, it would be $100,000 in 2 yrs! Read on…
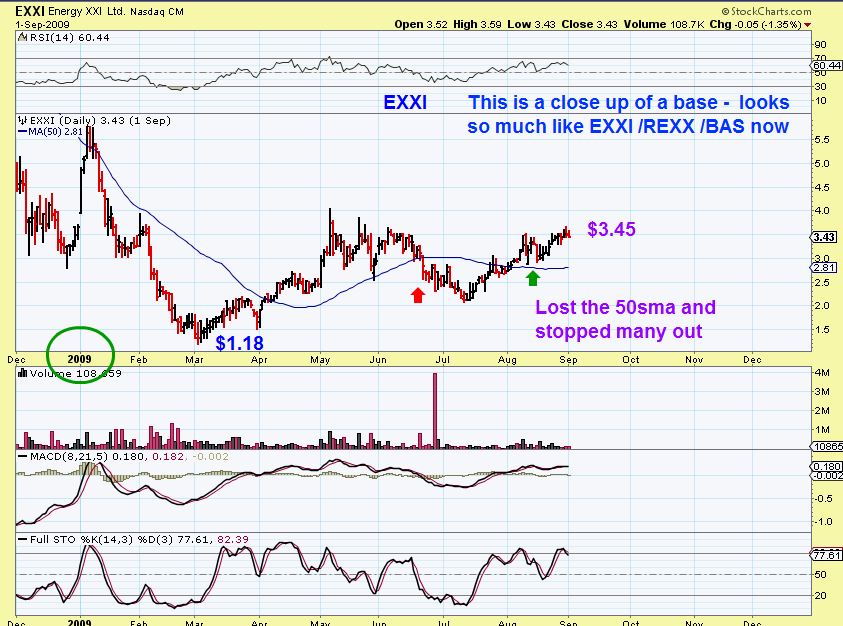
IF you zoom in on that EXXI chart, it was not straight up in that “BASE” period. This is a close up of that EXXI chart in 2009, notice the shake out, drop below 50sma, etc like we are seeing now in ENERGY stocks, then recovery. Inverse H&S pattern.
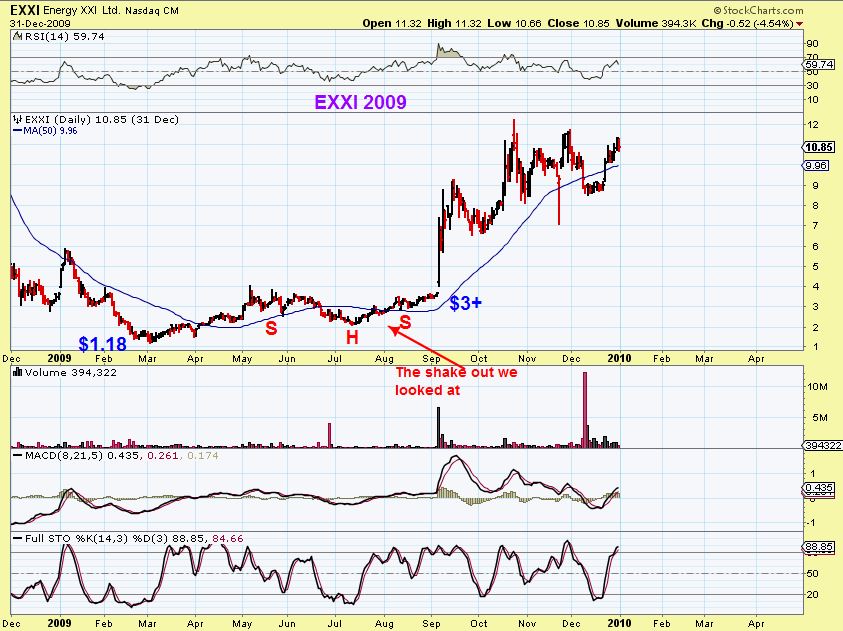
This is the same chart with 4 months added on at the end of that year
SO for now we are traders looking for set ups, and there will be shake outs and rough rides. I think in the long run, if you believe in a recovery in Commodities / Gold & Silver and can keep the bigger picture in the back of your mind, you will have some great %-Gains in the future.
Now let me show you this. That above EXXI chart again, inverse H&S pattern and regained the 50sma. It went from $1 to $4, back down to $2! Ouch. Then to $35 .
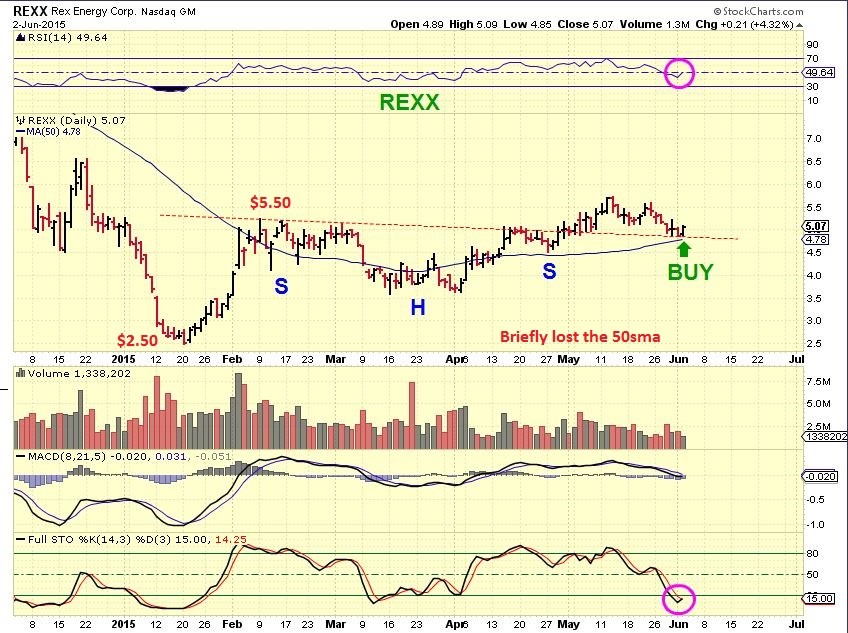
REXX has done the same now. Most know that I bought REXX at $2.60 and set that aside in a different account. I still trade REXX in my main account with separate funds . I hope to be selling what I bought at $2,60 at $35 🙂 This chart looks just like EXXI in 2009 above.
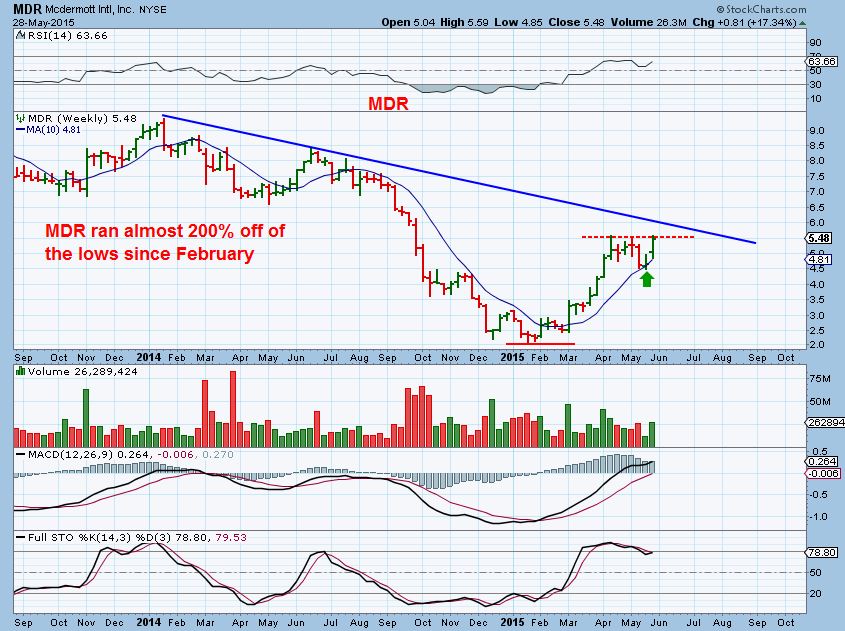
MDR doesnt look like much of a move longer term, but…
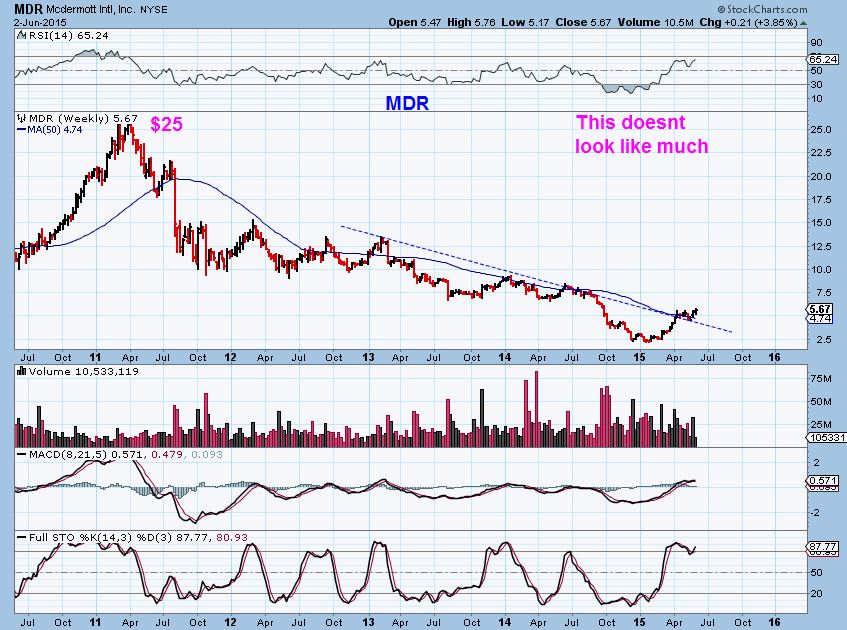
I see possible recoveries in the making
BOOM 
 Steel
Steel
Scroll to top

Re TLT – look on weekly chart. Long bottoming tails, 3 of last 4 weeks
Yes, and this weeks not over yet, could add another
Just broke last weeks low. I still think it looks terrible overall (and worse today, of course). Next key support is 117; if it loses that…
Sure. Seems a low risk buy at these levels, with tightish stop of course
Re NBG – up 9% in Athens. Also above 100SMA as NY price is
I like that chart
Volume is nice, y’day and today.
Thank you for outlook on China. I’ve been in BIDU for 2 days as a swing trade and will bail out today. I have been thinking China will bust soon and I don’t want to wake up to have lost my gains. BIdu has been very good to me the last 2weeks. 🙂
Hey wishfull-
I just threw it out there , because it was a beautiful move I look at how much it looks like SILVER though, and it is just a matter of time. It just cant be different this time.
It might have more upside for now , however , hard to tell.
Oil 2008, Silver 2011, China 2015 = Eiffel Tower…
Yep, it’s a classic parabolic move.
Looks like /NG is acting as planned by lingering in the bottom for a little longer.
Did everyone see what the Dollar and EURO did? The dollar was just up by more than 50cents to 96.50, just plunged to 95.50
Yep, and strangely gold didn’t react much at all, on either move.
This could cause a short covering rally in the EURO. I looked on an hrly and both the USD and EURO look like possible A-B-C-D moves
I didnt see OIL or anything react either
Seems a fake rise in $, pullback continues
Got out BIDU in Pre-Mark. Phew, glad I did. Lots of overhead. I’m a happy camper!
Yep, it’s right in that zone I pointed out couple weeks ago where I thought it’d be a good short. Failed to get thru last week and now struggling again with less momentum. And now the 200 DMA has tipped over.
Anyone trading Uranium Sector today? Think its ready again Alex?
Looks like buying opportunities Today.
Look at those STEEL stocks mentioned in the report. ( X,STLD, AKS, SCHN)
I will add again to BAA in the future if it fills that gap ( now at the 50 SMA) and gets oversold and does a reversal
Got down to .27 today. Didn’t quite fill the gap or get to 50DMA yet. What do you think? Also did you see ZBB today. I still have it.
I did not see ZBB until now, very nice.!
And yes, I added on that dip, but I am just accumulating a position on dips. my real cost is much lower
ZBB , CBAK both look to b breaking higher from their consolidation, ZBB has better volume.
VLTC looks very interesting too , (not energy )
I’m pondering an entry into SZYM again
Posted this in April at $24, almost back to highs again . Sometimes these things take time : ) Hope someone got it ( I didnt)
Alex,
Those developing long-term potential trades are interesting indeed. If you would continue to occasionally point out these LT setups (eg, EXXI and REXX), that would be much appreciated.
Thx Rube,
Sure , and I am trying to mention them from time to time as a reminder. For example in todays report : At this point we can now see with REXX and BAS that buying & holding in January would have been extremely tough due to the sell offs, same as EXXI in 2009 . REXX at $2,50 in January is VERY tough to buy & hold, but only 6 months later REXX is a double.
SOME Energy stocks have dropped all the way back to lows and form a different style base. They “Appear” ugly , but As long as they arent going bankrupt, they may do well too over time. I will show an example here ( refresh for the chart). You can compare this style base with the SHANGHAI chart in the report. You can see the potential f it breaks out higher in the future.
Bought GDP and WRES Yesterday.
PES doing well today 🙂
USD taking another hit today……Key Indicator for me and my commodity holdings.
USD getting crushed again. I wonder why we aren’t seeing more upside in commodities and especially GOLD and miners? Short lived drop in USD perhaps. Watch your stops.
I agree Bill.
I am beginning to think this might be a HCL for USD, which would Not bode well for most commodities. I may start building a long position in the USD soon.
FXE looking strong
Alex,
Are you still of the opinion that the May 17 USD Low was an ICL or is a DCL a possibility ?
It is possible that that was a dcl, and is now Extremely Left Translated. I dont think ICL’s roll over this much in the first daily cycle.
I concur ! Thanks.
Hi Alex. I am wondering how you manage your buy and hold account as far as stops are concerned. I was planning to hold BAS for some time but just got stopped under the 50SMA
I’d go with the last significant low on 5-28-2015. The low was $8.31 so I’d put my stop around $8.30
If you got stopped out of Bas at this point, I’d say you used a very tight stop, since it just broke below the 50sma and I only currently see it 10 cents below. If you look at the past week, it broke slightly below the 50sma 2 days ago & 2 days before that and recovered, so going by that you would expect that it could do that again, and use a looser stop.
If you get stopped out, you can just buy back in when it recovers the 50sma , because you know it wasnt a genuine sell off type move. You lose commission and may enter at higher prices, but longer trm that wont matter. I dont use a tight stop on buy & hold because I dont want to get stopped out repeatedly. I just make sure a sell down isnt extreme.
My buy & hold accounts started with my January buy recommendations, so my stops rarely come into play. Even when I add higher I allow plenty of room, because my cost average is low. IN past times of 2009 (See my chart in the report of EXXI) price dipped below the 50sma and recovered. In my ‘trading acct’ I got stopped out of REXX & others when the inverse H&S formed. In my buy & hold, my stop is looser and often down near the lows.
If I were starting one right nowright now, say a BUY & HOLD in REXX- I would put a stop loosely below the 50sma
Lastly- If I have a BUY & HOLD…I only have 1 or 2 and I dont use so much money that it bothers me one way or another if it acts volatile . Like I showed in the above EXXI post….1000 shares at $2 or $4 , later on at $20 or $30 is a huge gain.
What BILL wrote is a good idea for a loose stop because it may not get hit, but if it does, youre glad you’re out in case thats a H&S top that formed.
Thanks Alex/Bill. I used the previous dip under the 50sma (8.59). Good to learn how others manage stops.
I will say that the volume is getting a bit strong in this selling on BAS. I dont like that . It will have more volume than that May 19 swing point, and if it breaks that point with strong volume, it could sell off further.
Re PMs: 10s:2s still on mildly rising trend. Refresh
Thx JD
IEI at distinct trend line
Grundlach is big bear on long bond http://www.cnbc.com/id/102695095
Yeah, all 3 think no interest rate hike in 2015
which they say will be negative for long bond
My current theory is definite rate hike this year, puts final plunge in gold then it gains traction as we realize negative nominal rates – inflation outpacing interest rates
Alex, what do you make of this, the dollar down for a 2nd straight day, Gold down and crude down? Strange
They dont always correlate.
I believe GOLD is in its own cycle and the counts are right for weakness. In my gold chart I mentioned that GOLD “appeared” to put in a short daily cycle may 28 with a day 18 dcl, but if we break that today it can extend the daily cycle count outward. I prefer that , a dcl at day 20+ and now we are on day 22 since we did break those lows.
Or we break down & sell off. The REAL by is coming weeks from now at the next ICL. Any move higher from here is more likely to be short lived & fail than succeed
Alex, how do we know next ICL will be a good buy? The fall/winter was decent (if you escaped the Dec trickery unscathed) but this ICL was just flat lousy. Couldn’t the next one suck also?
Stopped out of BAS with small gain.
Stopped out of TLT with very small loss.
I dont like the look on BAS today.
The MACD tagged and didnt crss over, price lost the 50sma , volume picking up. doesnt quite look healthy unless it reverses at the end of the day
boy ugly day for crude and co
Miners are setting up ugly. Big Money has been dumping GDX in after hours yesterday and today. Beware
where do you find this data?, chart is looking ugly indeed
No offense intended but the idea that Big Money would wait until the illiquid after hours market to dump stock is, well, illogical and frankly ridiculous. Why would “they” do that? I could be missing something so I’m open to an explanation of this.
Horribly, horribly bearish action in commodities with $$, down. I picked up $$, to hedge my commodity bets and then just lost on both. Ouch! My energy stocks actually did fine today, but crude and gold were nasty.