
SCARY, HORRIBLE , UGLY (Or Not?)
I want to show you the chart that I had in my morning report for OIL Wednesday . Please notice that it says that OIL may pull back to either the upper trend line or $59.34. It also could pull back to the 50sma in this consolidation and be perfectly healthy…
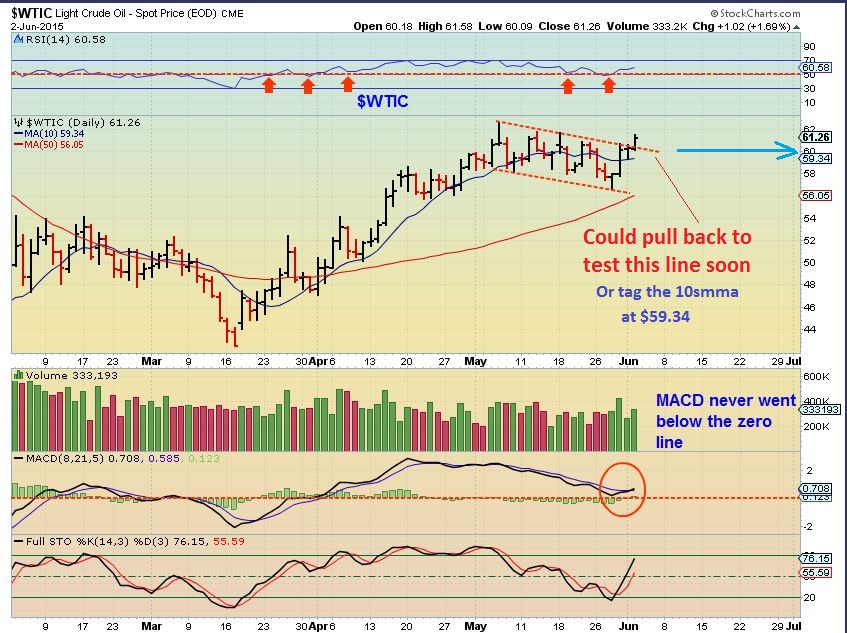
So what did OIL do Wednesday and what does it mean? …
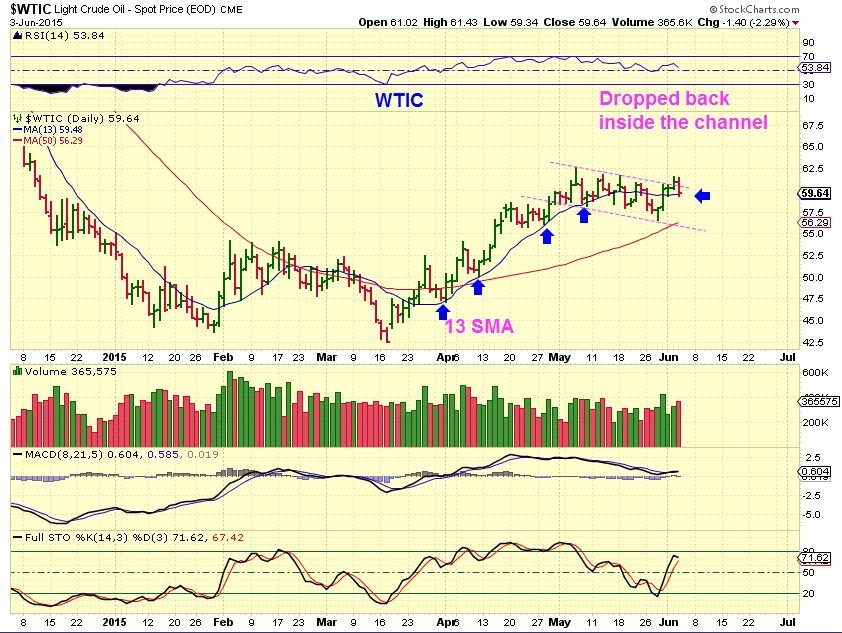
WTIC June 3 – No big deal. I’m writing this because there was a little bit of emotional panic by a few yesterday in my email box and even in the comments section. Thats fine, and maybe I am misunderstanding the comments? Possibly some meant “Oil was UGLY because the dollar was down & oil was down too” ? I am not making fun of anyone, I am just pointing out how to look at a chart and decide if it was really UGLY & Scary, or not and I dont have time to personally answer all the emails.
This chart of OIL is not ugly. It’s Bullish at this point. Look at the 13sma on the way up, we landed on it yesterday. If that gives way, yes we can drop further to the 50sma . Is that damaging? Lets review what I found for the sake of everyone.
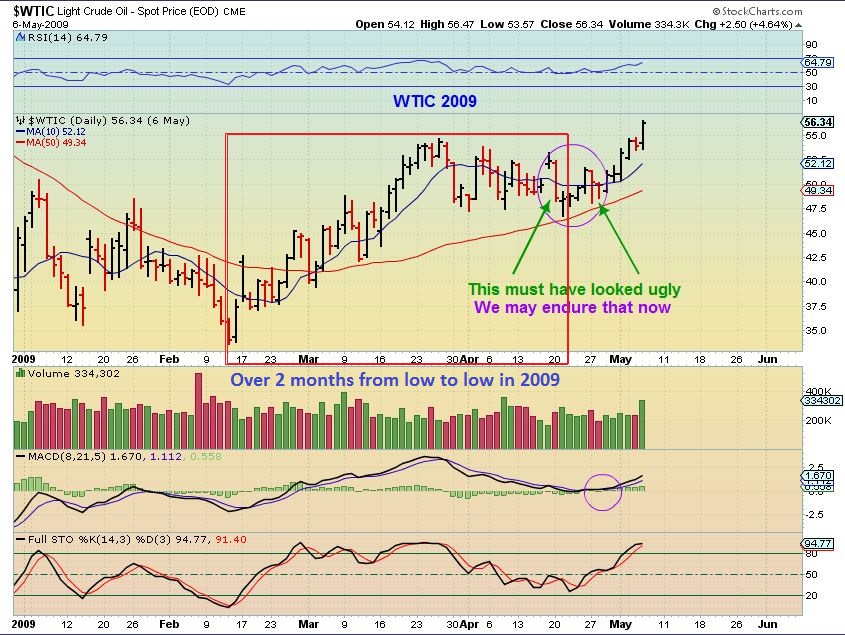
To further help, I went back to the 2009 lows. It looks just like now. Like now, we had roughly a 2 month run from the Deep ICL (lows) , and then a consolidation down to the next daily cycle low (red box). Were there any Sharp Down days near that 2nd low? (Green Arrows). Yes, scary Ugly drops much bigger than today. That 1st green arrow was from $53.21 to $48.19 in 1 day!! That over a $5 dollar drop in OIL.
What was the end result? A DCL formed. We then had 4 days up and then another slam down on day 4 and 5 of the new cycle, followed by a monster run higher. By the way, we are on day 5 too, if that was the DCL in oil last Thursday.
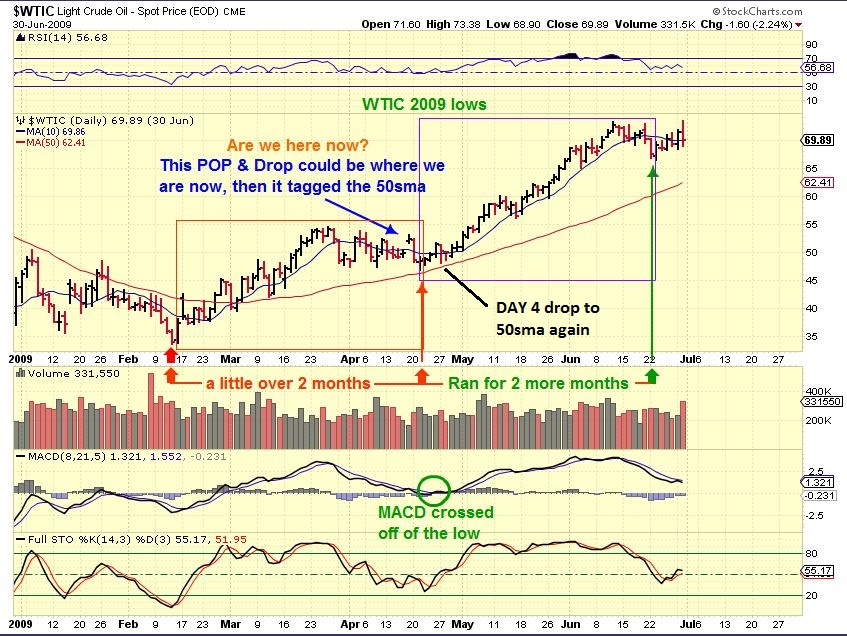
I hope that was helpful in putting things in perspective. The 2009 lows had a one day drop of $5+, yesterday we dropped $1.40. Use charts to guide yourself through the wiggles. That doesnt mean we cant crash at anytime in any market, but yesterday was not a crash.
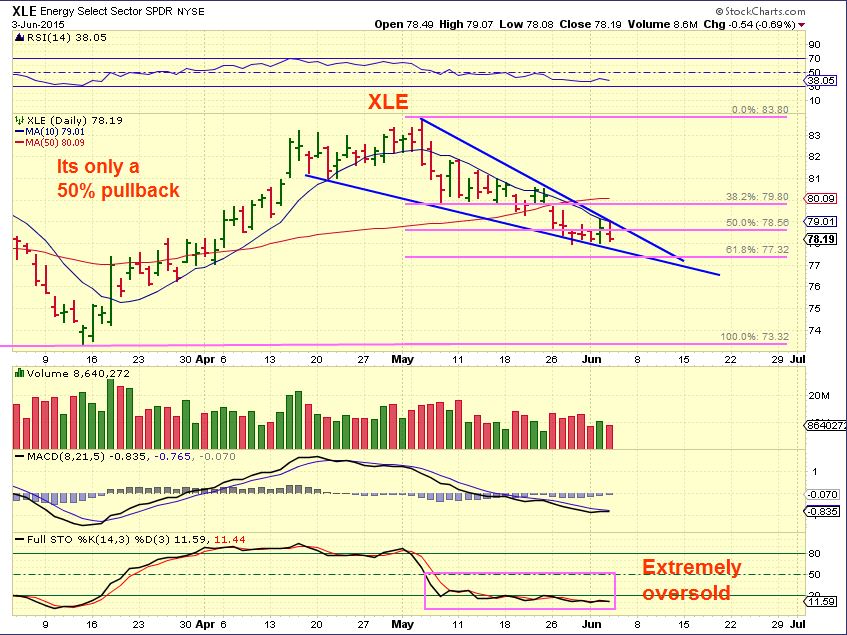
XLE– The energy stocks are tricky, some are losing their 50sma and re-gaining them. Some have just traded in a large range. The XLE is not so bad overall either. Extremely oversold, I would expect it to run with OIL soon.
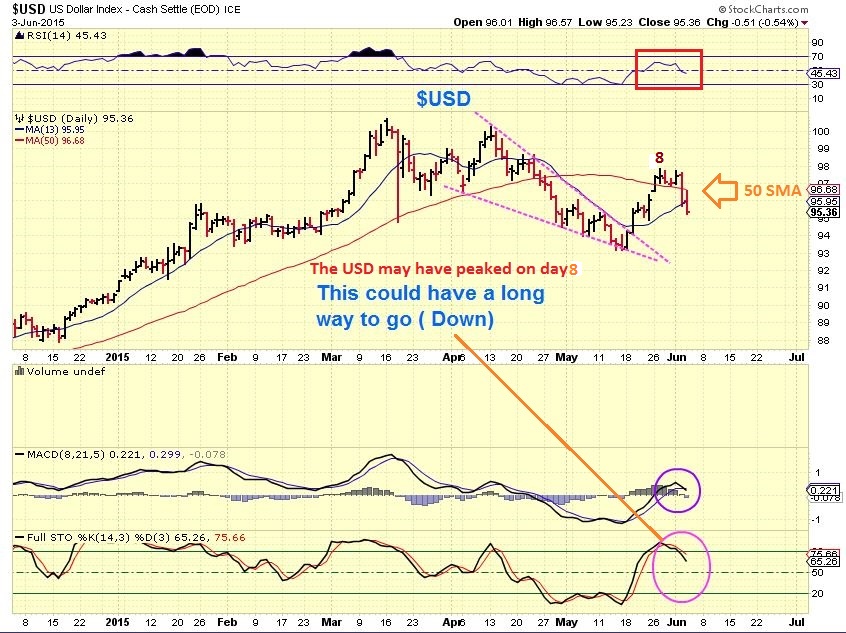
The Issue concerning some was that the $USD was down again , and many wondered why everything wasnt reacting strongly. THAT I cannot answer without guessing. Here is the Dollar.
$USD– it peaked on day 8, lost the 50sma, and the MACD, RSI, & STOCHASTICS seems to be saying that this is not done falling.
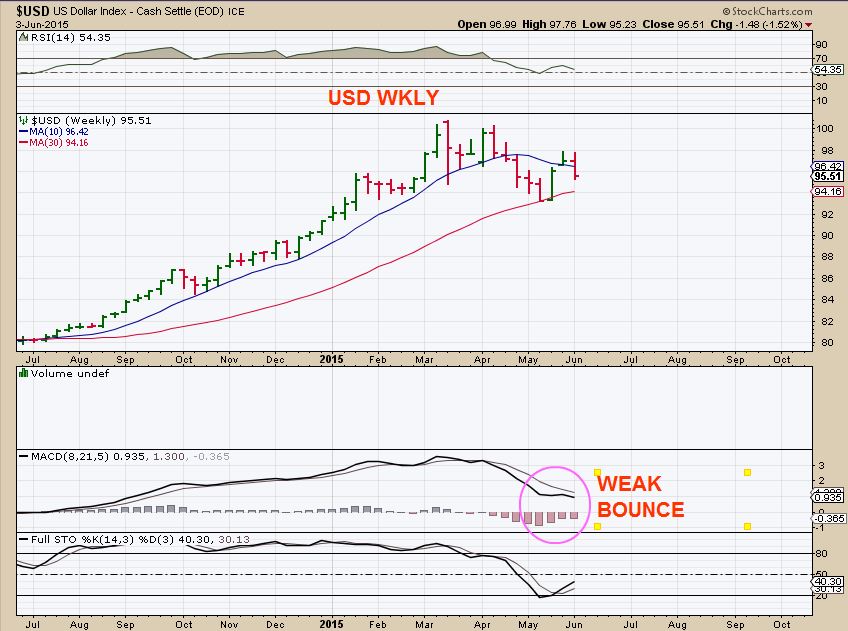
USD WEEKLY– if this doesnt reverse by Friday, it was a weak bounce and could continue down. $94.16 is the next strong support here. I Think “Is this a H&S forming?” when I see this. Normally I would say that commodities should benefit, but I need to wait & see what happens after todays non-correlation.
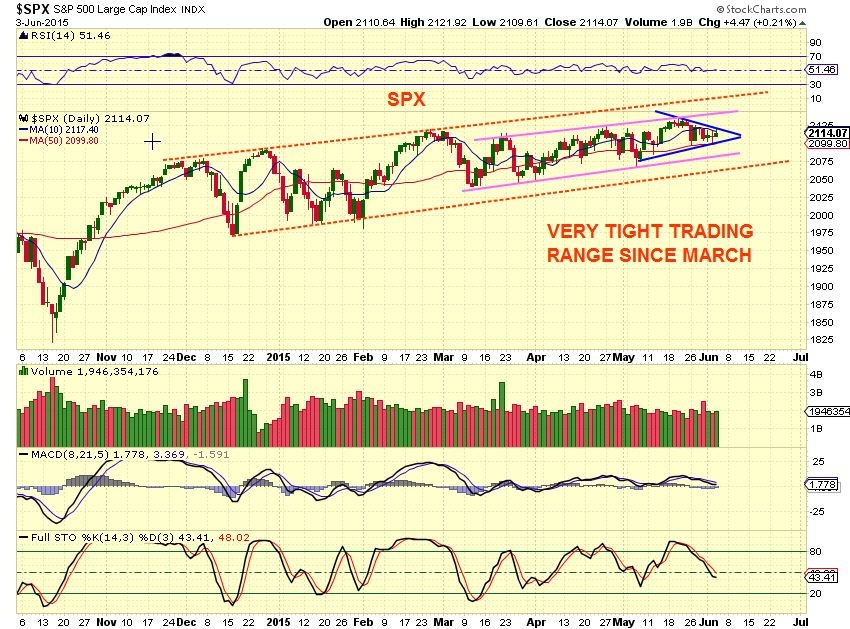
SPX – The equity markets continue the same. Sideways , choppy, tight.
$NATGAS- is at our entry area. It was rejected at the 50sma twice, but is still above the trendline support. Natgas often lingers for a couple days at the lows. I dont want further break down with the inventory report today.
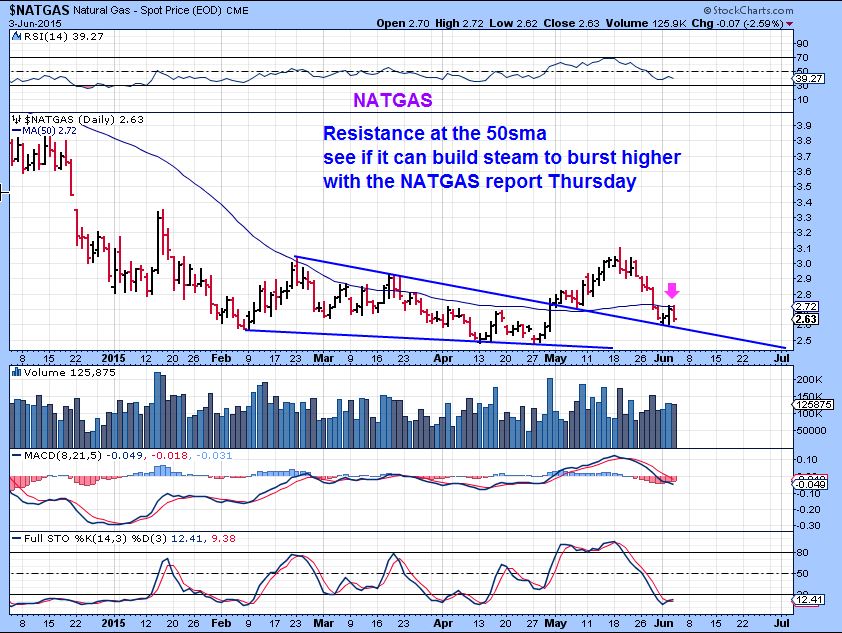
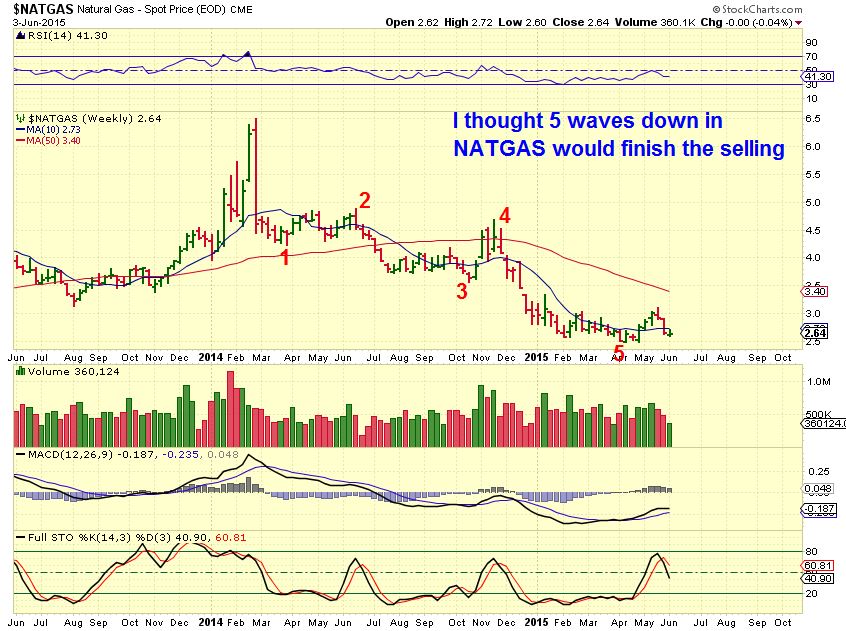
IF NATGAS drops below the trendline Thursday with the inventory report, it may be best to stop out & wait for a reversal. It could double bottom at the $2.50 or break down further, but I honestly have expected the lows to come in, and I think we have seen them. Why?
I thought this may have been a complete 5 wave move down, but I dont like the wkly stochastics and I am not an Elliot Wave expert, so lets remain cautiously optimistic.
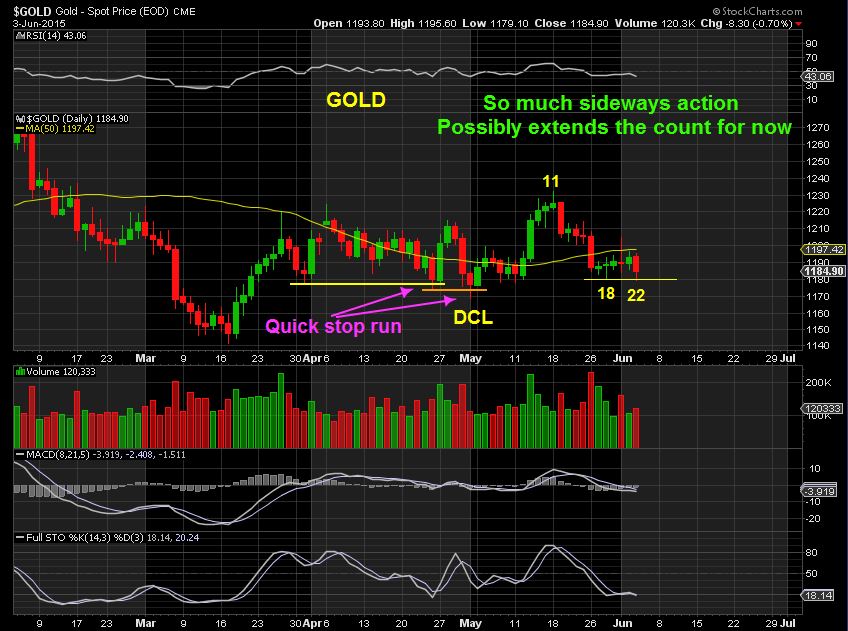
GOLD – dropped lower than the day 18 lows, and I mentioned that I would actually like to see that for clarity and a longer daily cycle would be more normal. I am still not trading this , except for some individual miners that I own.
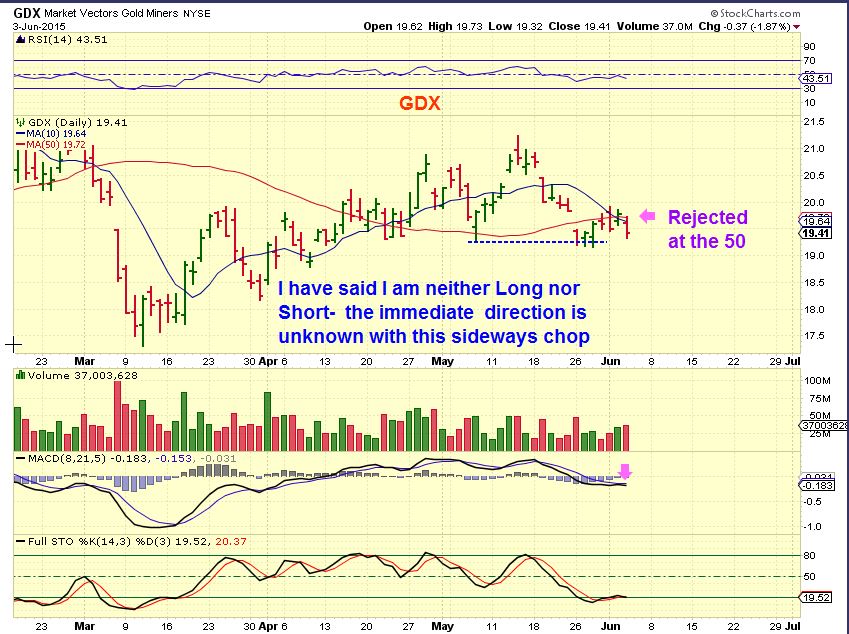
GDX- Rejected today again at the 50sma. It looks weak and could just drop, but aware that it has dropped below prior swing points and recovered often, as shake outs leading to the real Daily cycle Lows. This will likely remain weak and difficult to trade for a while.
The markets remain sideways and choppy in all areas. Up 100+ and then down 100+. Again, I see people getting shaken out of both long positions and short positions from the whip saw action and uncertainty day to day. I am pretty much only in a few Energy & 2 individual Miners myself . There are some areas in Biotech and Tech itself that are breaking out and running, but for now only traders will benefit from that. I mentioned Steel stocks, some Biotech, Some tech & Energy set ups recently that are looking ok, but again that seems to only be for faster traders in front of their screens. For most who cannot sit in front of their screen all day, it may be best to sit on the sidelines until we get a trending move again ( I expect OIL to trend higher soon, and energy stocks should benefit). Thanks for being here and stay tuned!
~ALEX
.
Just a few ideas for active traders / in front of the screen all day. Stay alert and remain cautious in fast/ volatile markets
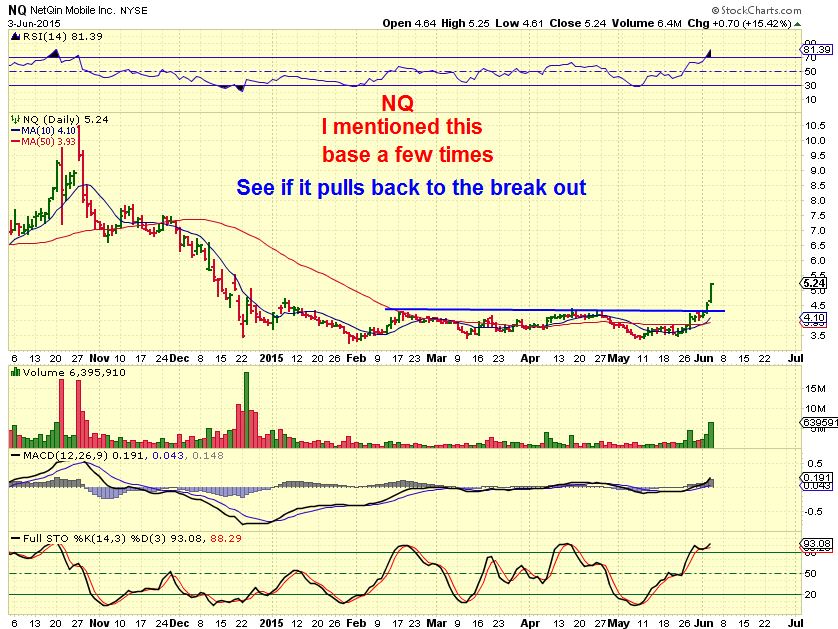
NQ was mentioned a few times. $4.15 here last week.
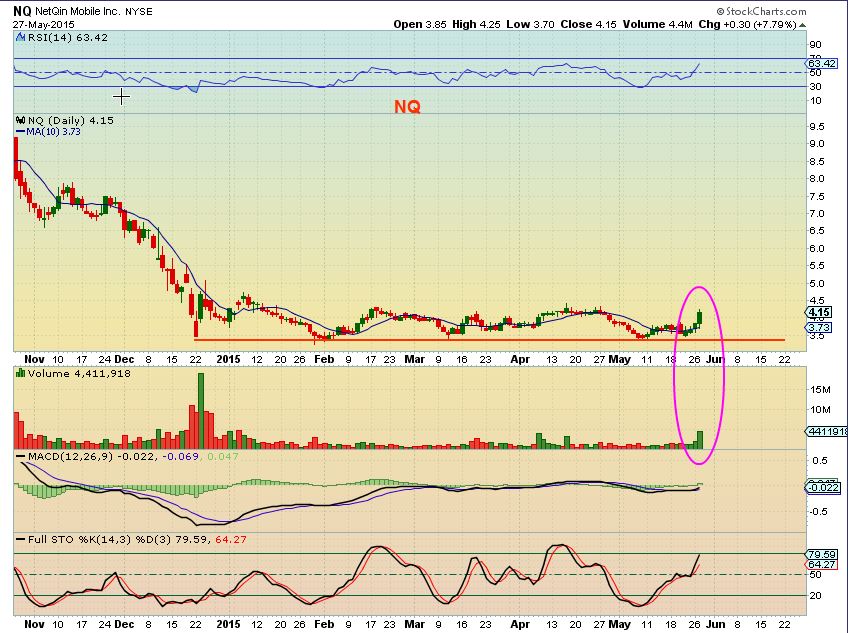
NQ now – It may just keep running coming out of this base, but a back test might be a buy.
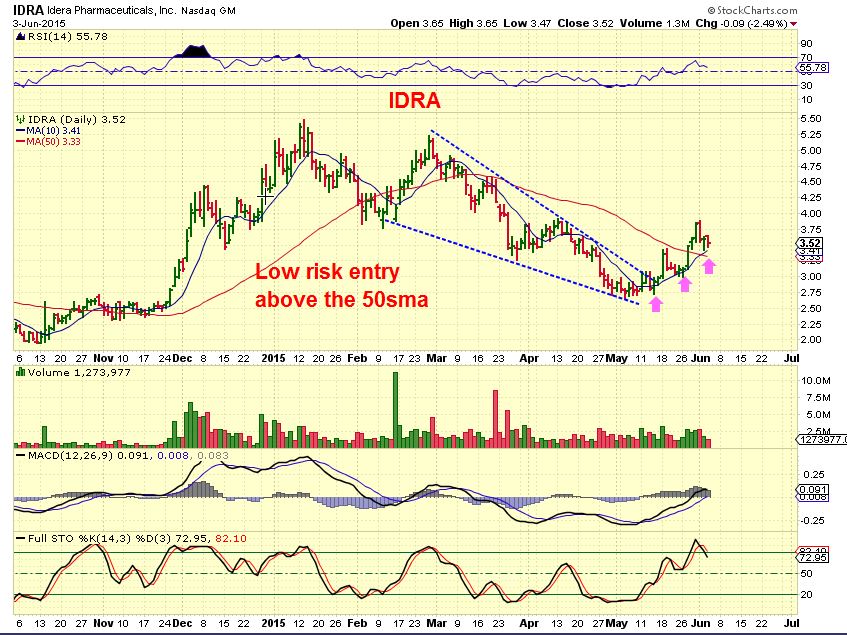
IDRA– watch the Pharma stocks closely if you own them. They can Fly or Die in a day of earnings.
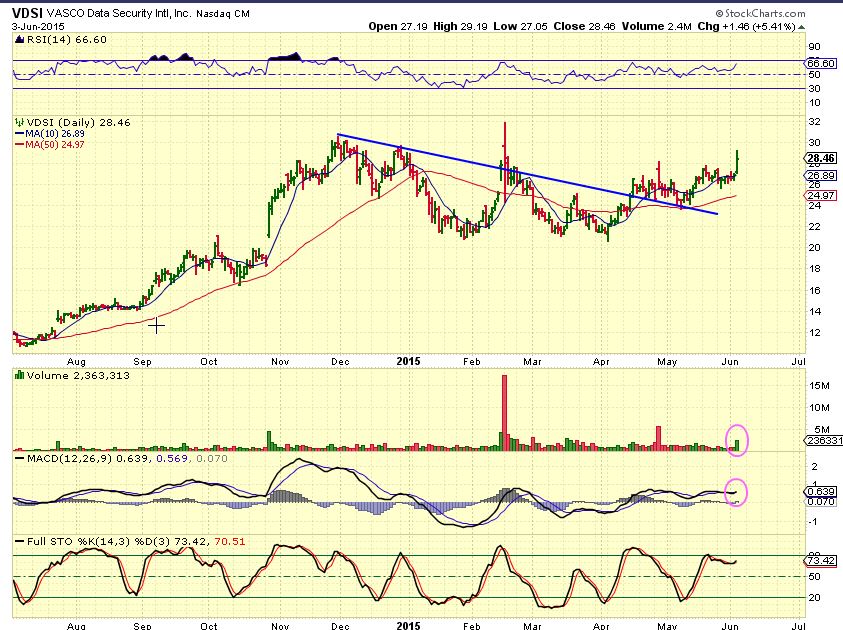
VDSI – security stock that I posted a few times. Here at $24 , Still looks very good. This was way back in APRIL…
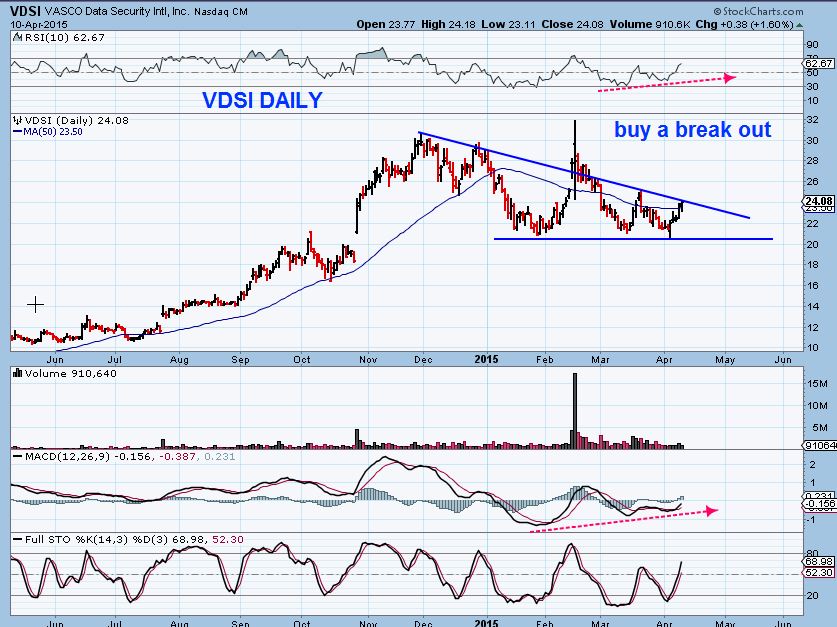
VDSI – Now $28.46 & looks about to attempt a break out. This took 2 months to get here, but when it runs, it runs.
These I posted JUNE 1 and they are still set up correctly
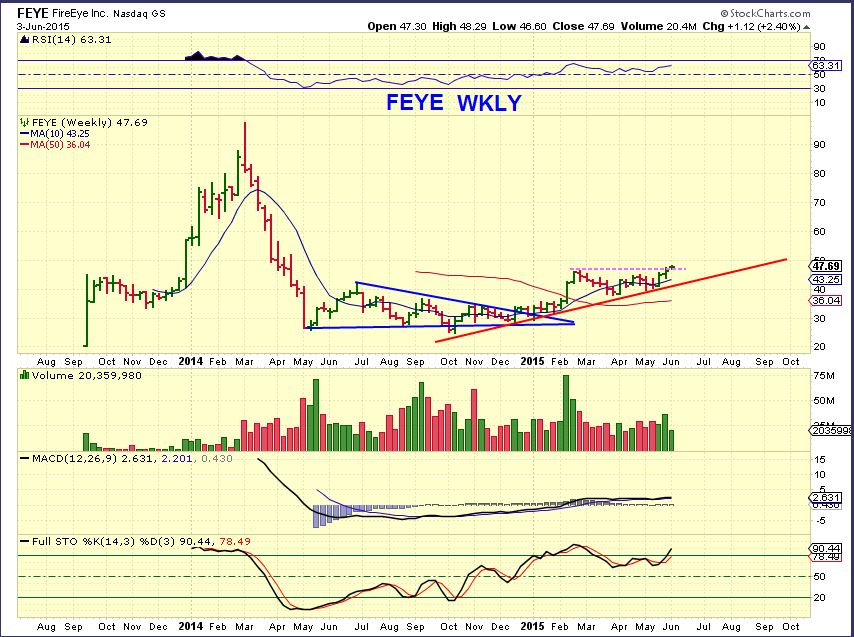
FEYE WKLY – it was in Jan that I started pointing out this base pattern at $33. (Looks like plug wkly now) .
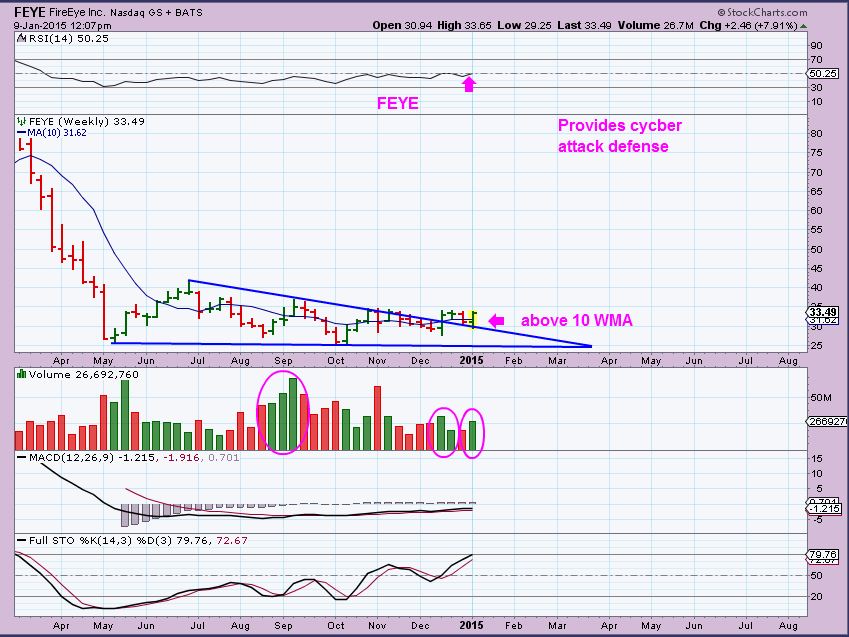
It has been 6 months, slow progress with lots of basing. I like the potential over time, former highs were $100 area .
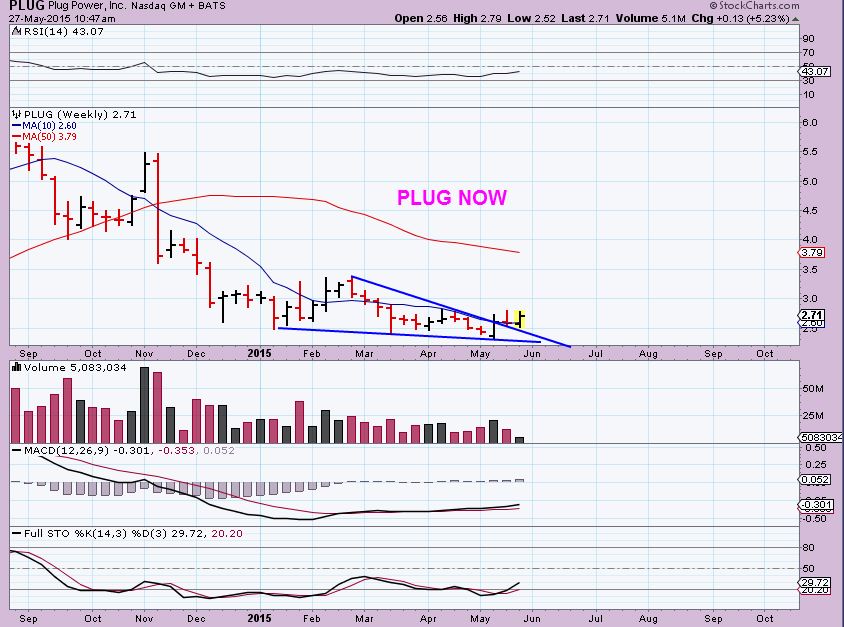
Plug – notice how this looks just like FEYE 2 charts above . It took weeks sideways higher before a nice POP.


THanks Alex, the Dollar down strong this morning, hope for a pop in the commodities sector.
Hey Bill, I ‘m not understanding it, but no reaction again in commodities. I guess we have lost the correlation and they are all just trading in their own zone for now ( Cycles)
Don’t forget the currency trends often reverse on or close to an employment report. The dollar may be forming it’s half cycle low this morning. That could explain why commodities are struggling. They are anticipating the resumption of the secular trend in the dollar.
agree on the dollar. I am on the sidelines mostly except for plug and rexx
There is a rumor that MCP is preparing to file for bankruptcy.
The only news I saw related to debt, etc was JUNE 1 , below:
Molycorp Elects to Take
Advantage of 30-Day Grace Period on $32.5 Million Semi-Annual Interest
Payment on Its 10% Senior Notes Due 2020.
Found it –
http://www.wsj.com/articles/rare-earths-miner-molycorp-prepares-to-file-for-bankruptcy-protection-1433390086
Thanks for the heads up, I got stopped out this morning.
TLT MACD bouncing from the signal line, on a higher low?
Looks like Interesting divergence on a possible stop run ,huh?
In 2015 , it is lower lows and lower highs so far, but thanks for the updates to keep it in front of our eyes.
I’m going long TLT today.
Tightish stop but reward:risk better here than 122 the 200SMA.
Possibility of retest of low at 116ish
Well waddya know? 50% FIB hit.
Darn, missed my entry, will try again tomorrow!
Was I wrong in thinking there was a NATGAS inventory report this a.m.?
in 15 min at 10:30a
Thank You , I thought it was 10.
It hasn’t been warm, I think this week was baked in to poor weekly performance. Next week we are sure to see another large injection. This may continue to be a tough trade for a few more days based on fundamentals.
Didn’t see what the report said but a mild negative reaction. It’s very oversold here.
Nice reversal of that drop below the trendline, so far. Closing key, of course.
Refresh for chart of UGAZ – right to the trend line again. Slam down & recover (So far) & oversold.
Yeah, lookin’ good. Nice bear trap, it would appear (while guarding against overconfidence here).
UNG immediately was down 2%. Now up 0.3%.
Looks like a bullish reversal UGAZ ..now that reports are out of our way..we wait? Maybe;)
I’m wondering if we are close to a swing in GOLD/MIners. It wouldn’t be expected to do too much, but interesting move in SA, and reversals in NG , CDE, RIC, PZG while GDX/GDXJ are pretty red.
SA, NG, CDE look pretty good
The continuing relative outperformance by the juniors is really interesting too. Nice rounded bottom forming here: http://schrts.co/CVi02n
Yes, I agree. Ignoring all the doom & Gloom and theory- Juniors seem to be accumulation stage at the lows here. I look at 4 month charts of those mentioned above and those are nice gains. ( NG, CDE, BAA, GSS, TRQ, SA, PPP, EGI , etc).
They could drop , but they prob wouldnt break their lows.
About GDX and AH action. Not sure how to explain it. Just noticed huge spikes of volume a few minutes after the close. Big money, or a lots of small fishes. They’ve been right the last few days. (i.e. gold puking down )
I’m curious where you’re seeing the huge spikes of volume (i.e. info source). At ThinkOrSwim, for instance, the price went up/sideways on negligible vol the last 2 days, so I’m wondering where you saw this.
Realize that the end of day (last 5 min, usually) always has the biggest vol in GDX. So don’t confuse that with after hrs.
For the most part it’s just rebalancing. You’ll see that end of day spike almost everyday. The bigger the move the move, the more out of whack it gets, the more end of day volume. Of you don’t see the actual bid/ask move AH then you can ignore those spikes. Very common. Check underlying security of you want a better picture of volume.
the most rational answer. Thank you Cason.
I still see the bear flag working out. This is NUGT but it shows up on GDX as well.
Bill…. can you show us?
Many thanks.
I see the same thing Alex is showing above, refresh to see charts.
Yeah, I drew this and it was in the report JUNE 1 ( refresh) . I pointed out the engulfing candle and gap fill. Oddly, some juniors still look good ( NG, CDE, etc) . It is a game of individual stock picks lately
A hot jobs number tomorrow could provide another big thrust down.
Stopped out of BAS and YNDX this morning. Getting interested again in SZYM.
A couple of interesting moves in the energy list I have with OIL / NATGAS Down. ( REXX dropped & recovered, staying above the 50sma ).
GDP, SFY, XCO, GEVO, BWEN, CBAK (ZBB still looks good). CLNE, SZYM
MPO is still looking good, holding up quite well and still looks poised to break out; BBs widening as it holds above the 20 DMA, etc
HERO is green today. Doesn’t look particularly great on the daily but maybe a fake breakdown below the Apr low and on good vol, though no great. Forming a more complex right shoulder for a IHS? Or bear flag poised to break down? We’ll see.
REXX was about to stop me out and reversed. Thank goodness. Most of rest look bad but considering oil and S&P at this point…
Another day like this in energy though and I’ll have no choice but to eject.
Stopped out of BAS, GDP, UGAZ, and MCP this morning. Don’t get it.
I know Bill, REXX is acting correctly and most others are not. I am only in PLUG, REXX ( even REN, which I liked the wkly is just broken at this point,
REN is holding ground on its 100dma
(what a selloff!)
Nice spot. It’s possibly a stop run on the 2 prior pivots. a reversal back above $1.20 would be nice.
Alex, remember this one?
Bill, are you in DUST ??
Nope, still no action either way in Gold or miners.
Yes, I do
RJA (Ag ETF) looking interesting again. Fake breakdown? It’s back above the 50 DMA and MACD is pos (and pos div too). Still a watchlist, not a buy IMO, but interesting in the larger commodity picture.
Interesting, but super light volume. I looked at other AG stocks POT,MOS, AGU – nothing stood out
Yeah I was going to mention vol; definitely not ready yet, but one to watch.
I can’t possibly imagine being more bearish on gold and miners than what I am seeing in recent action. Reaction back up always possible but I’d short any and every pop at this point.
Bear flag on /GC (15 min)
I dont want to talk you out of a trade, but when I see CDE, NG, and a few others today and look at what I wrote about GOLD in the report, I would NOT short here.
This COULD be the DCL forming in GOLD. Timing is fine for it.
No, please do! That’s why I subscribe! The move in silver this week seems a bit much, so I sold to close SLV puts but kept ZSL. I expect solid jobs tomorrow to put pressure on PM s tomorrow, that could put DCL in for run higher next week. Small positions only right now.
Overall, expect much, much lower this summer. If we can catch start of 3rd DCL then short that quick top, it could be pure evil on the way down.
I agree with catching the top of the 3rd, that may be a great short 🙂
It’s great. I am my own contrarian indicator. 🙂
In case readers don’t see posts on older threads: TLT just touched 50% FIB of 1/1/14 to end Jan 15 rally. Refresh.
Reversal on the $USD & UUP . UUP right at the 38.2% at the recent lows ( refresh for charts)
I see MACD and RSI turning down. And this fits with Euro strengthening. $ weakening?
It does, could be a triple top? Divergence at the top if it runs up that high. The EURO chart since March has made progress, higher lows and all…. have to see how things play out.
You think there are such things? If it gets there its more likely to be building to keep on rising.
Yes, Head and Shoulders are triple tops, and there are other forms. I cant say if the dollar will break out or fail at this point though.
Refresh here / click to enlarge. They do break out upside too,
Sure
But the more a resistance is challenged (or support) the more likely it will give way
Oh yes i see what u mean. I hadn’t seen h and s as trip tops before
turnaround for FCG…. at last?
UGAZ looks like a shake out/reversal at this point too. I posted a chart way down below and it seems to be holding.
bought more UGAZ today. it’ll be at $4-5 before we know it
I agree, I stopped out and bought it back up when I saw it,.
PZE remained healthy through out all of the wiggles
Crazy stuff. Check out a 30 min chart of SPY. And that is why I have been neither long it short general market for some time. And the bond moves this week have been crazy!