It seems that things continue to play out as outlined here over the past few weeks and months. Lets look at the charts.
SPX– watch this number. SPX needs to bounce soon.
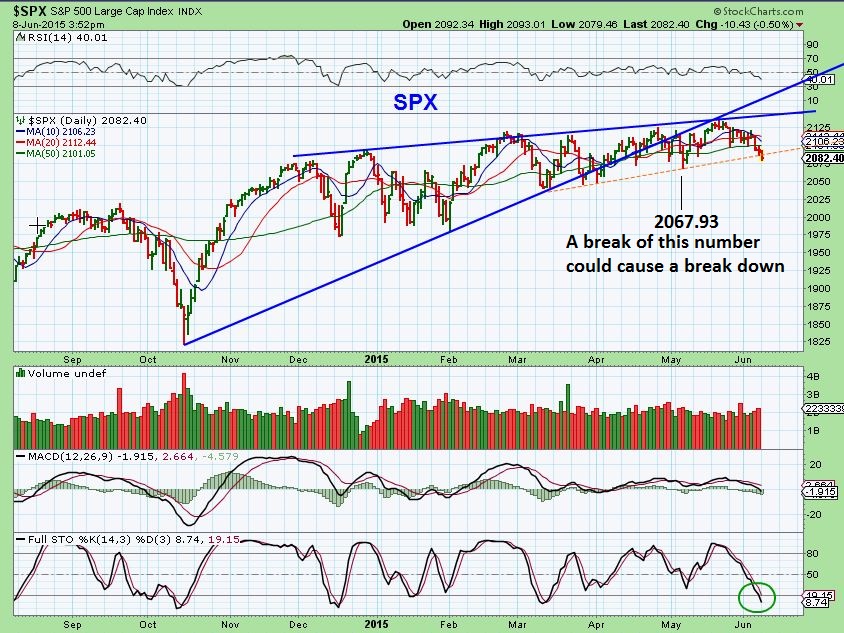
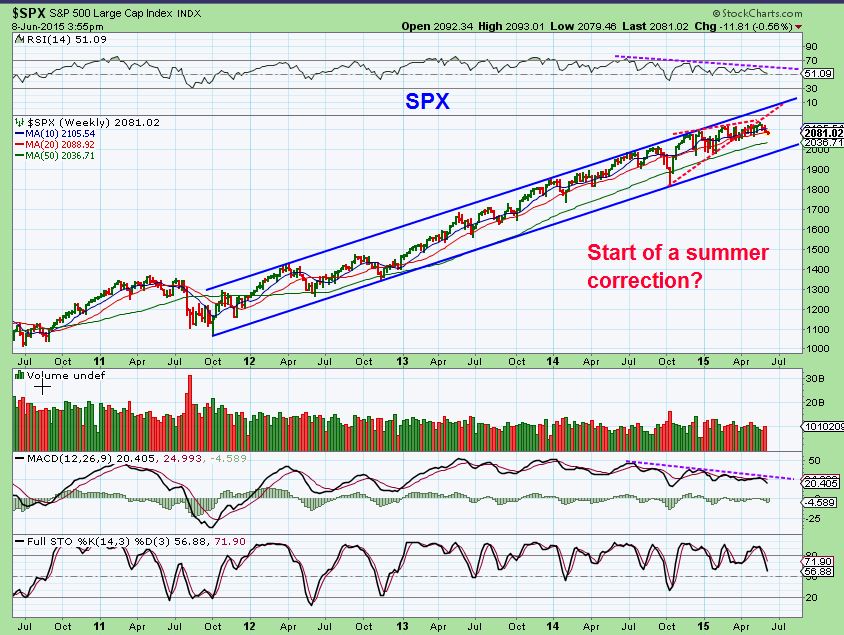
The markets have not had a healthy correction in years. A long term chart shows …
That a healthy correction would likely scare many and you will hear talk of a crash even more than you do now. A 10% correction on the SPX would be a bit over $200 and would break this channel .
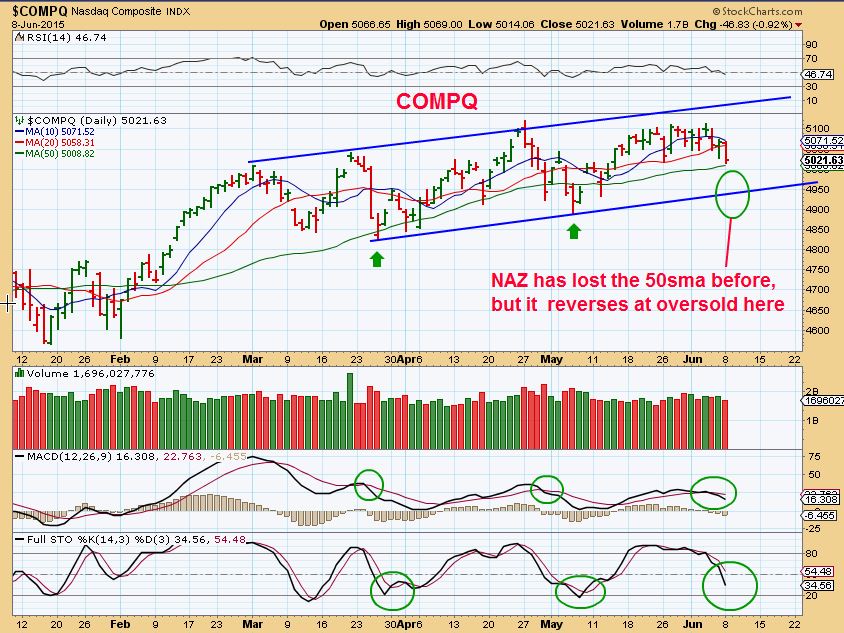
NASDAQ – I am watching this area, since in the past it seems to have been where reversals take place. If you trade the NASDAQ using TQQQ or another vehicle, you could keep this in mind for a low risk entry ( look for a reversal). A break of 4888.17 is bearish.
USD – This looks rather bearish with a day 8 peak and we’re on day 16 heading down ( L.T.). STochastics is NOT oversold, but that mid point can be a reversal zone.
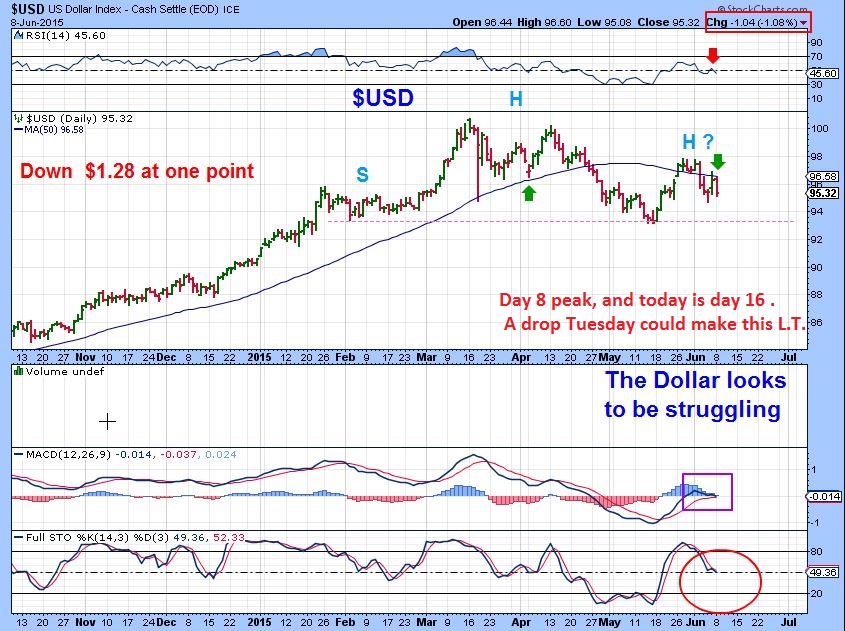
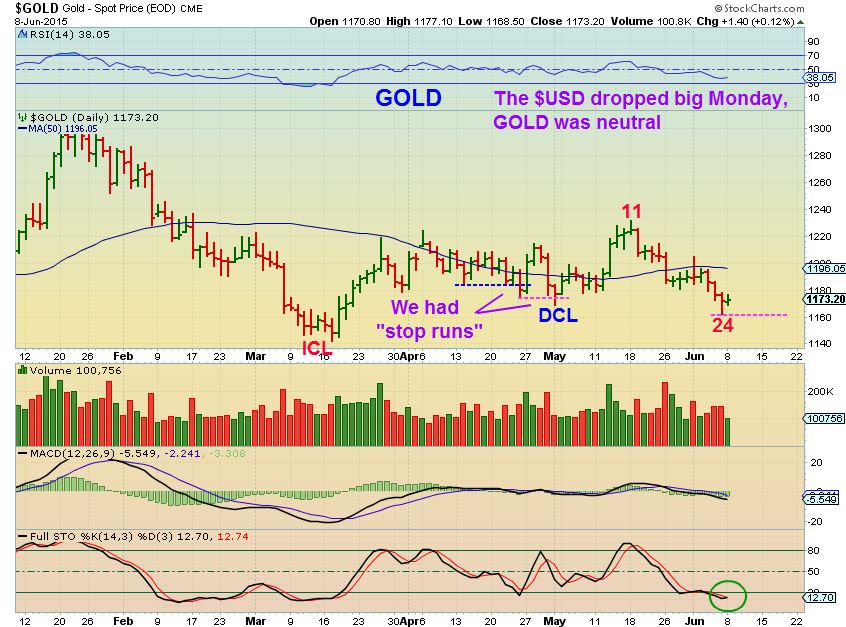
The dollar dropped BIG Monday, over $1.28 at one point. OIL & Gold didnt respond as one may expect. There is a disconnect , I am not concerned at this point.
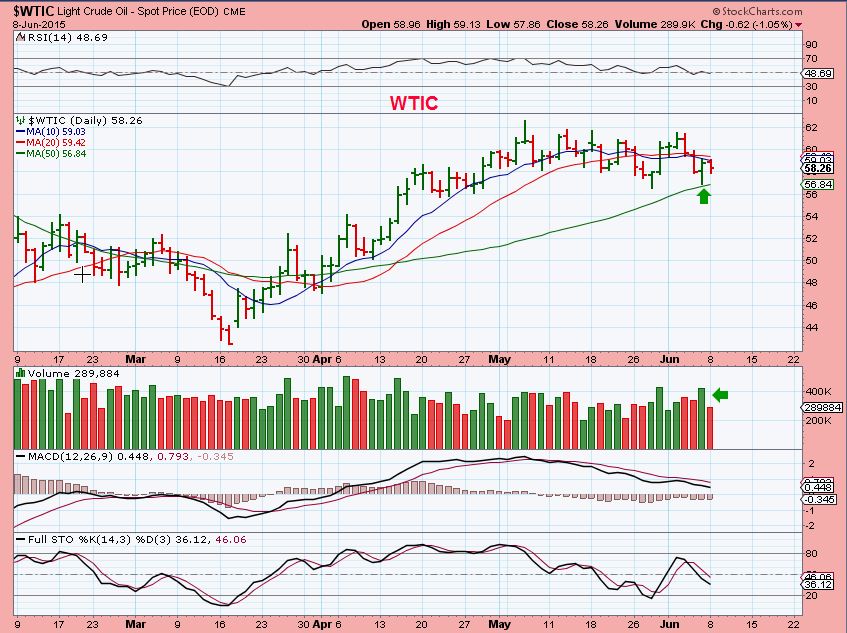
$WTIC – Not a big drop in oil , resistance at the moving averages. I expect higher price still, holding positions above the 50sma.
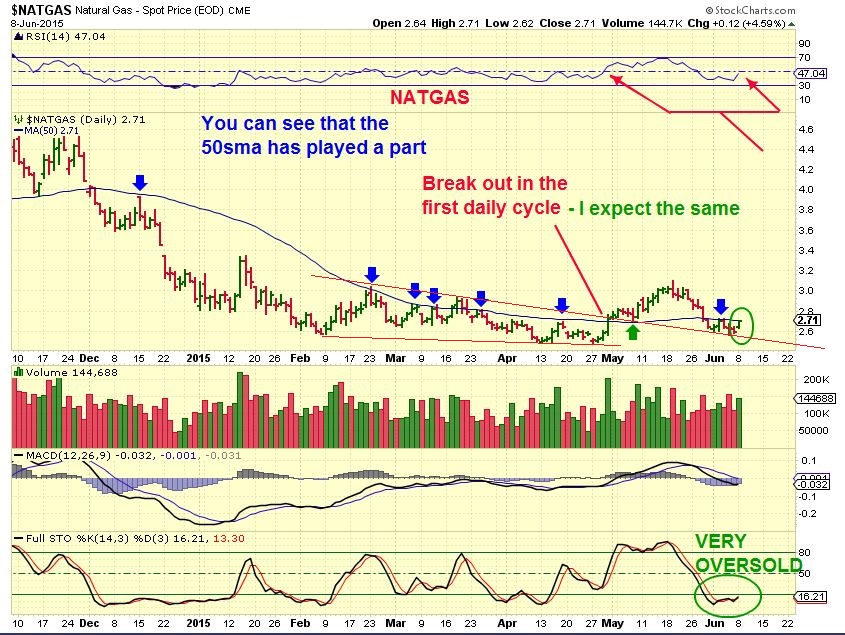
$NATGAS- popped as expected off that trendline. 50sma acts as resistance.
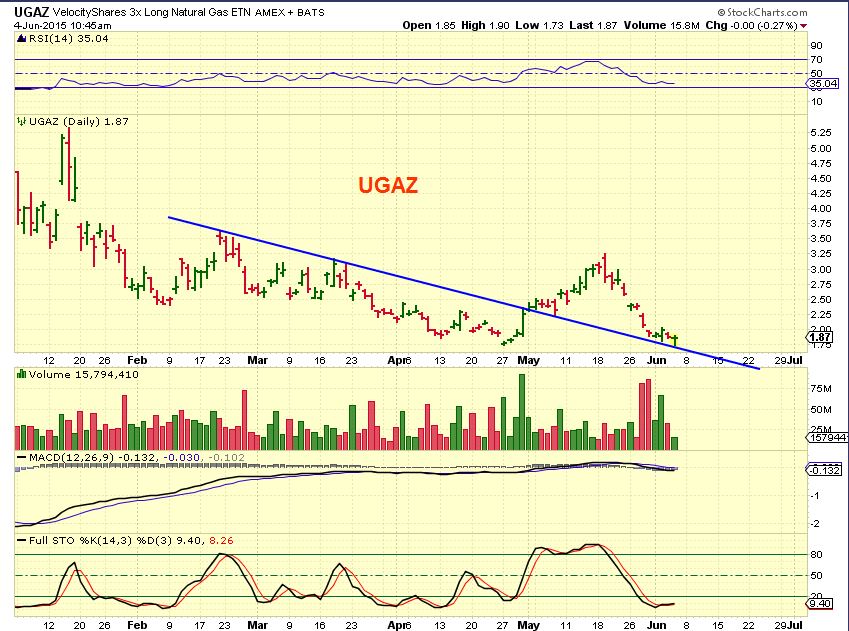
UGAZ – June 4 was the buy. Its above $2 now.
GOLD – I said in the weekend report that I expect a bounce , not huge rally. We are oversold, cycle count is in the DCL zone. It also has done a stop run at this point recently, extending cycle count to day 30 or so, so It may get tricky and tough to trade. Only Active traders should trade it if they are in front of their screens. Others may even want to short it soon (Watching the 50sma) .
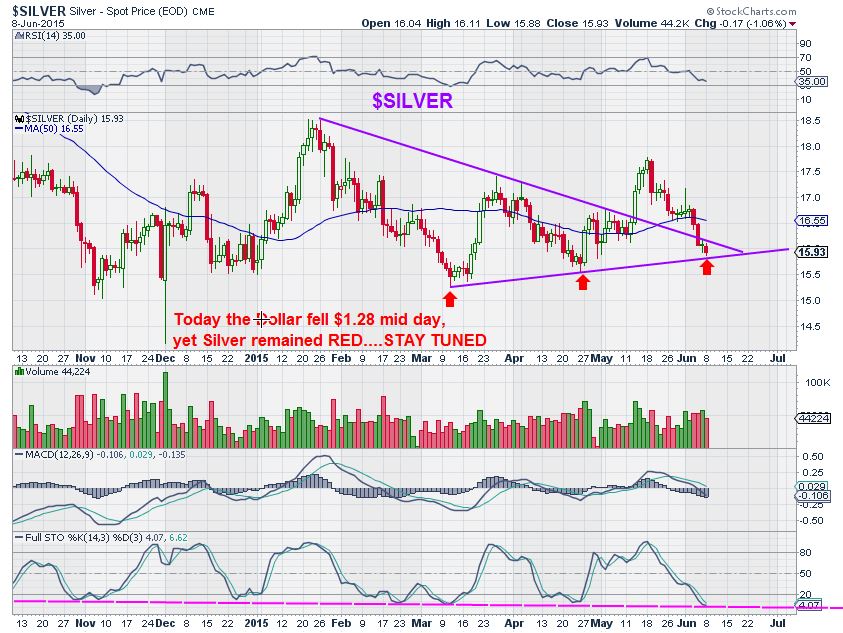
Silver – has held up well all along. The Dollar was down $1.28, Silver stayed Red. Oversold. Hmmmm?
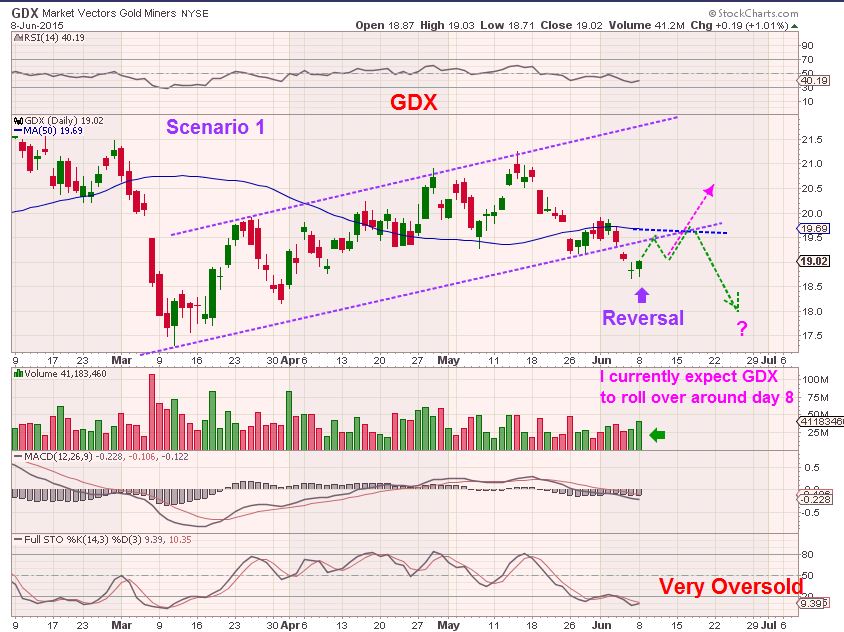
GDX – I look at this chart and see a few possible scenarios, I will just share 2.
GDX 1 – We’ve broken down. 8 or so day ‘bounce’ that cant really recover, short it.
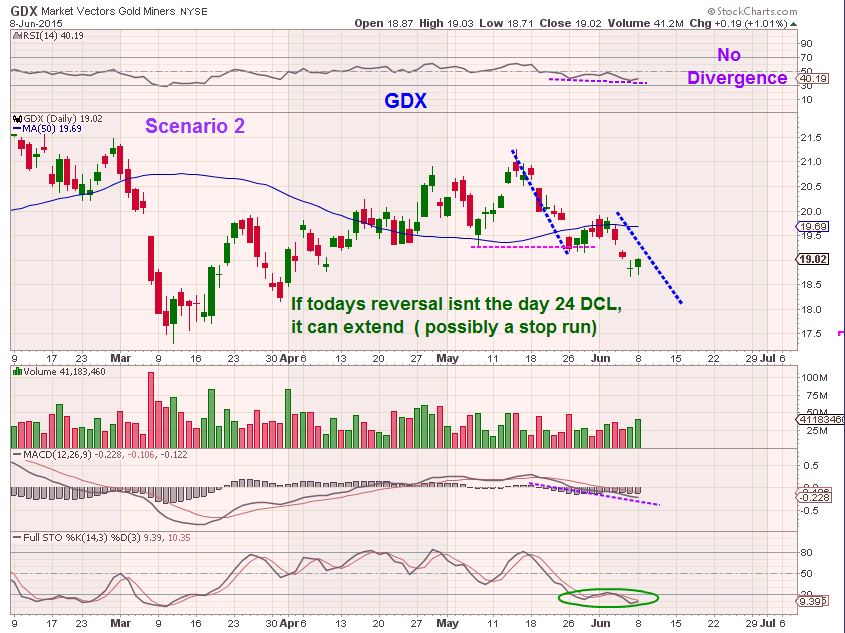
GDX 2 – Very oversold really, but an A-B-C-D down is not complete as I see it. Futures are up currently, so we could get a bounce & then stop run and drop a bit further later this week. Then I will reassess.
Other stock set ups mentioned this week could remain valid. They didn’t break down with recent selling. I just want to point out a few Miners here, going along with the recent idea that some of these Miners have the look of shaping up, bottoming, and even recovering. USE STOPS if you invest .
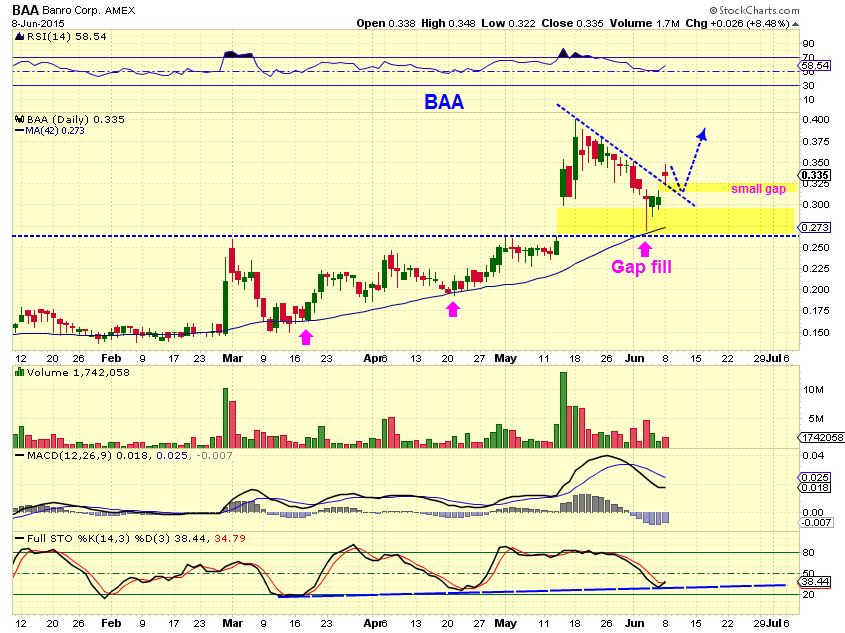
BAA – I have accumulated this one on dips. It continues to act correctly so I am just showing it as a Miner acting correctly. It had a Gap, filled it last week, but gapped up on good news yesterday. That gap may fill on a future dip. RSI remains above 50%
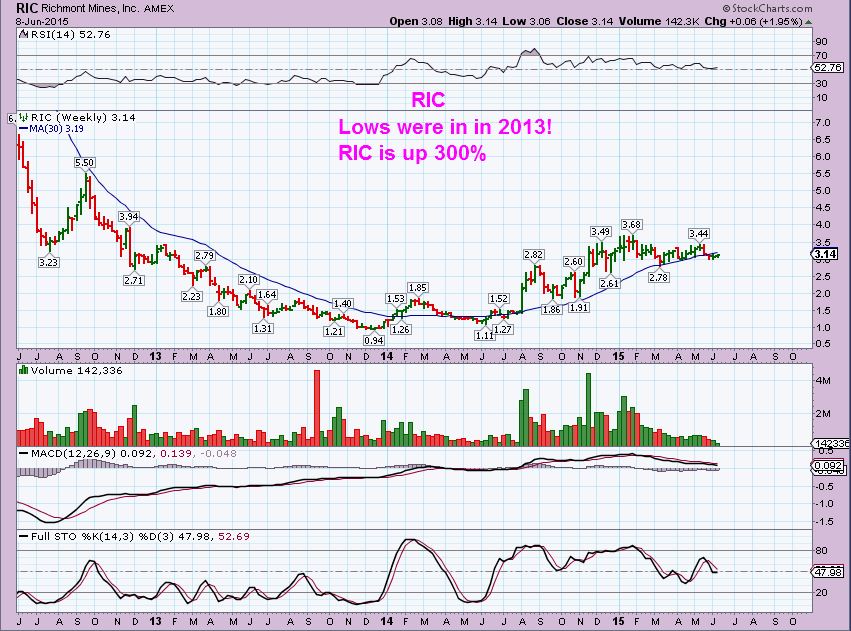
I have mentioned Miners that are acting correctly like TRQ, LSG, RIC, etc . They haven’t been hurt in the Gold sell offs and seem to have found a bottom a while ago. For example –
RIC- Lows were in 2013 actually.
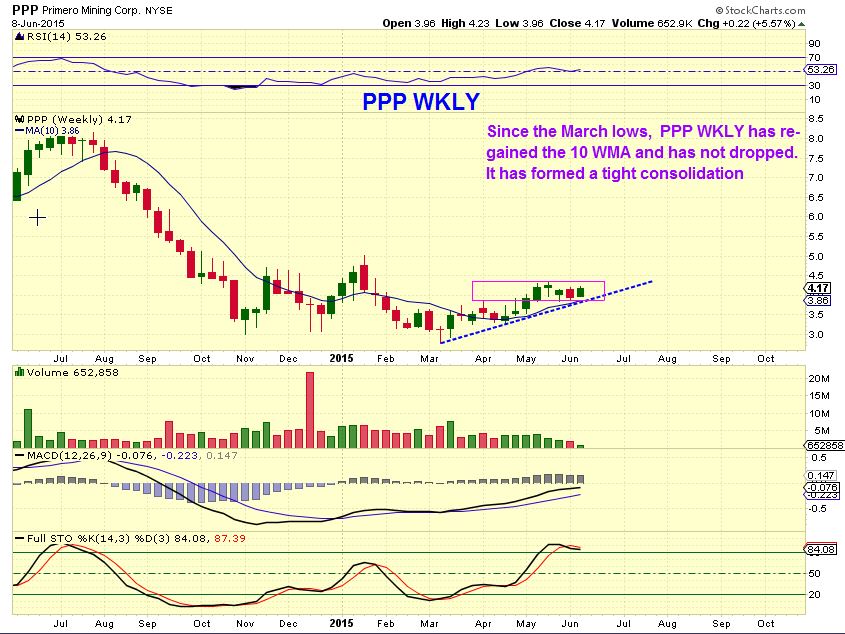
I have noticed a new contender in the Miners that are showing potential. You would use stops if you own these, since I expect Gold to sell off into an ICL . This seems to be under accumulation like LSG, RIC, etc and may hold up relatively well. Do NOT buy & hold without a stop however.
PPP- The weekly is acting correctly
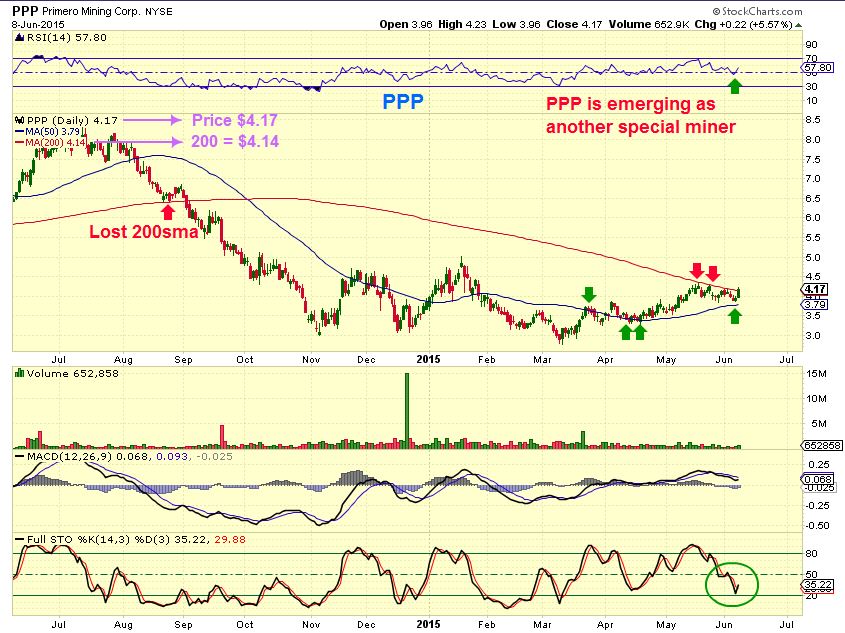
PPP DAILY – It was pinched between the 50sma and the 200sma. PPP has closed over the 200 sma for the first time in a while and soon could get the 50/200 cross . This was resistance. If PPP continues higher, the 200sma may now act as support .
Armed with this information you can approach it several ways.
1. BUY now above the 200sma and scalp a quick gain this week until it gets overbought.
2. Buy and hold using the 200sma as your stop when Gold sells off into an ICL.
3. Watch how PPP acts going forward and when Gold sells off, if the 200sma acts as support you can buy it here later
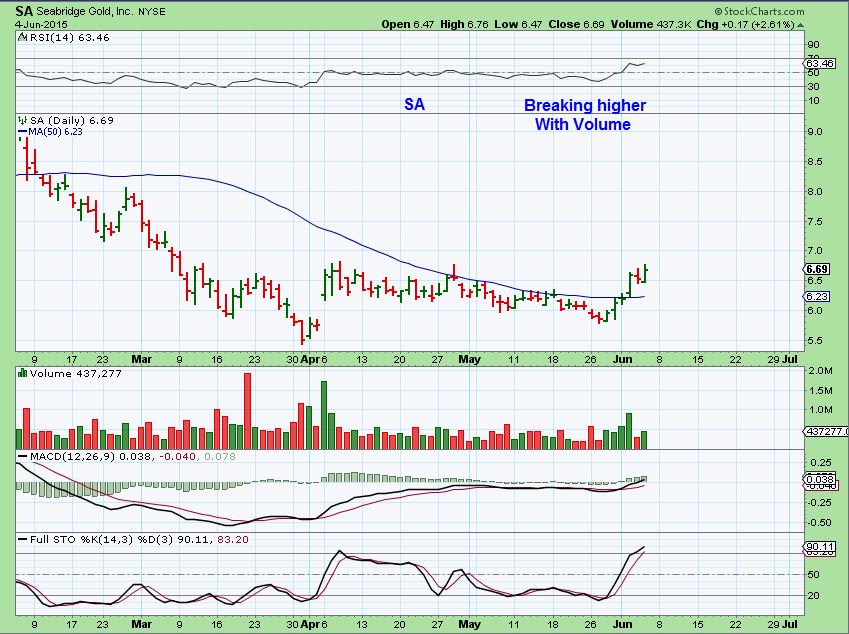
I also liked the looks of SA, SAND, and IAG recently for Gold miners. Not as ones that look to have Bottomed at this point, just resisting Golds current selling. I mentioned SA with this chart as GOLD sold down. It has since gone sideways above the 50sma.
So the Equity markets have continued selling off, the above charts show areas to watch for possible reversal or damage to the charts. The USD is selling off again after looking strong in the reversal. OIL & NATGAS look good. The Metals market seem due for at least a bounce, but I expect it to be short lived. Best wishes in your trading and I will keep an eye on how things unfold and see if anything “interesting” develops as we move forward. Thanks for being here.
~ ALEX
MINI-LESSON FOR YOU – I hope you can follow this explanation of a trade that I just did where I locked in small profits and missed a nice run.
I have mentioned that PHARMA and BIOTECH are running strong.
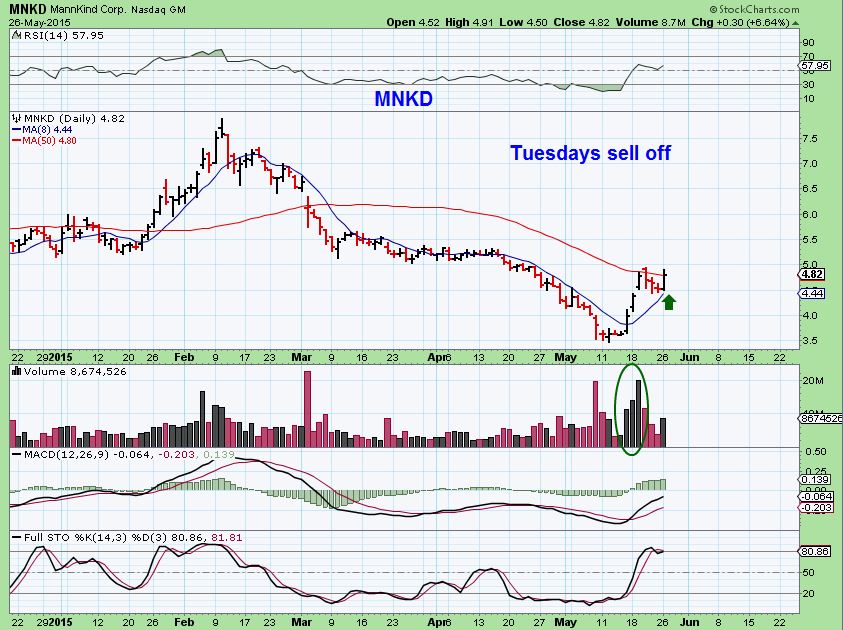
You may recall that I bought this reversal set up in MNKD. Let me walk you through this trade.
CHART 1. MNKD was rejected at the 50sma , but on the pullback to the 10sma ( I used the 8) volume was drying up. It was going to reverse & try again, when it reversed I bought it. I then sold WAY TOO EARLY. A nice trade in near $4.50& selling near $5.25 area, but …
CHAT 2 . I sold near $5.25 and look at it now. What happened?
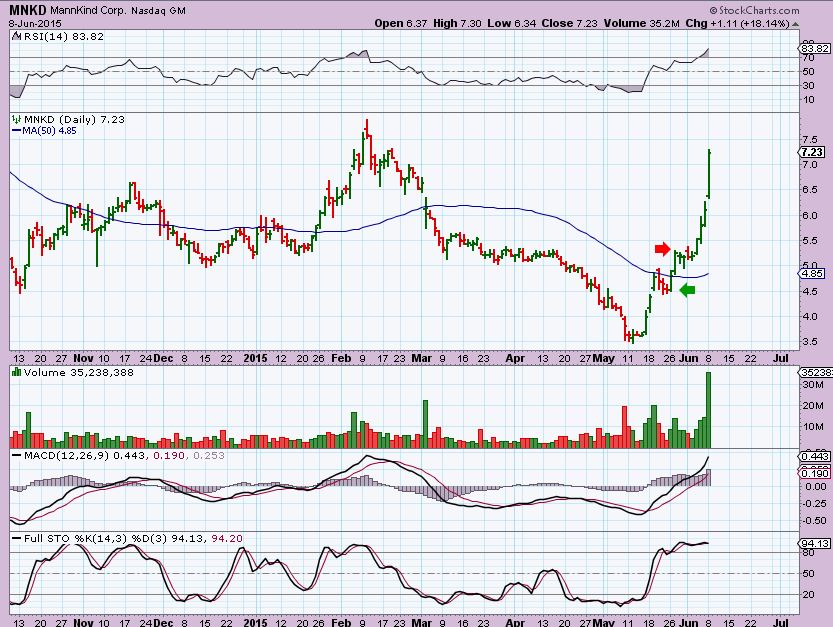
Why did I sell? In 2003 I took a T/A class from a Trader that was really sharp. He taught me that if a stock sets up like we had in Chart 1 and you bought it, you should take profits it if it passes the prior high with less volume, because at least that candle high will be tested in the future. It also may just fail & drop.
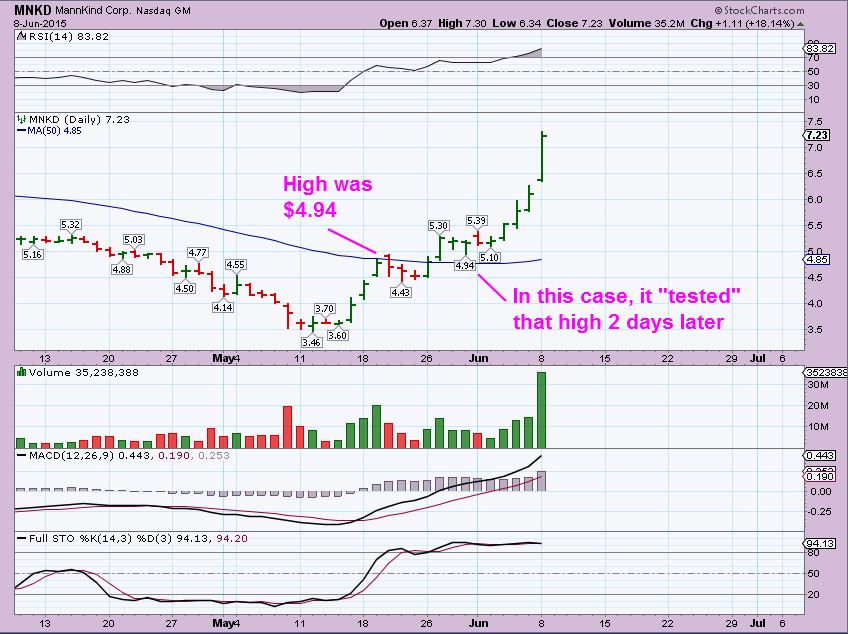
Amazingly, I have seen this happen Millions of times, and when MNKD passed that peak of $4.94, I sold near the end of the day because volume was still too light. You want it to match or be better than that swing day.
Guess what? That Peak of $4.94 was actually tested intraday 2 days after I sold on light volume ( That is the new buy since the 50sma resistance was broken & could now act supportive) and off it went. I missed that re-entry. I have seen price reverse lower to test that candle and drop fast on heavy volume & break back through the 50sma, that is why you sell and take profit. This time the test was successful, and off it went with increasing volume. Sometimes you win, sometimes you scratch your head and say….WHAT??!!!
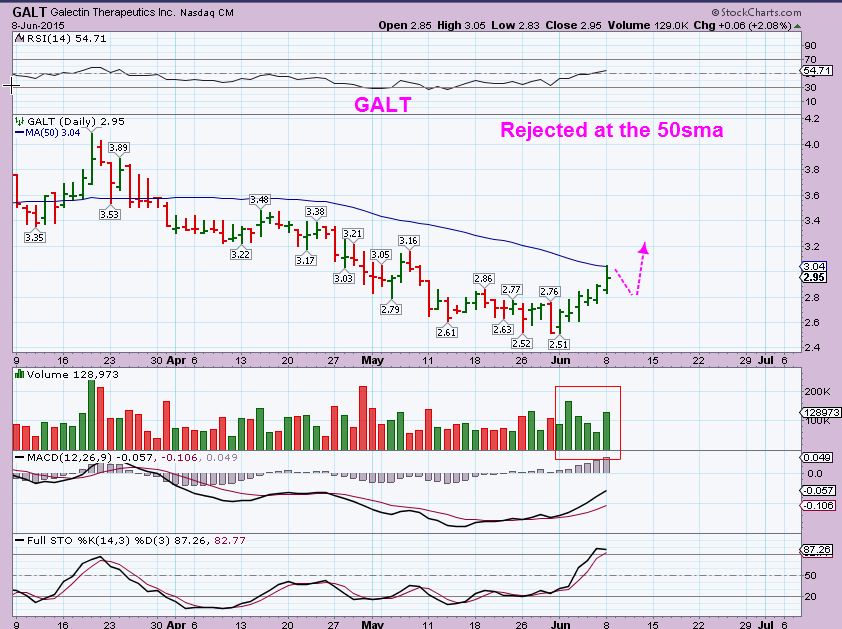
SO now I am watching GALT. I have traded this stock in the past and the exact same thing happened to me in the past – LOL. I am ready to see if this surges above the 50sma now ( buy) or drops like MNKD did and then reverses to attempt a break above. It is just one that I am watching as a trader due to the recent volume buying.
-Basically the lesson is : When you learn a rule to trading and you see it play out over and over again, you have to stick to your trading plan. Sometimes you win locking in small gains, but at other times you may miss a great trade ( I just did) , but discipline always wins in the long run. Thats why we honor our stops and trade according to our plan and not our emotions.
33 Charts 
 Whats Your Favorite Color?
Scroll to top

Excellent lesson & reminder…tx
Thanks , I actually remember telling you that I sold MNKD that day after posting the reversal. In fact, You probably havent stopped laughing yet 🙂
…not laughing per say, it’s more like a ‘chuckle’ and a sense of well-being that comes from knowing I have a comrade-in-arms or kindred spirit…..so to say…. 😉
Thanks Alex, I see a number of energy stocks forming large bases (SD, SFY,GDP). Looks like low risk areas. Also I like the way EOG and ETP look. Bouncing off lower trend lines. Just an observation. Also, GDP-C, and GDP-D have EX dates tomorrow. Hefty dividends to holders of record Today.
Hey Bill,
I see those long bases too, its just tough sometimes to know when they will move higher & hold on to their higher prices like REXX or BAS have. Good for trading for now , I guess. If OIL makes it to upper $60’s / lower $70’s I would imagine they’d have to respond bullishly.
I got stopped out of BAS, but I got into EOG and ETP this morning at the open. All my stocks are green Today! UGAZ and EJ going higher. What do you think is a good exit strategy on EJ?
Oh you took that trade, huh? Refresh for yesterdays chart recommendation.
I like it , especially since it broke out & already back tested. Exit on a set up like this is a tough call. Its like MNKD, it could just keep running, especially with that kind of volume the last couple of days. Use a trailing stop or mental stop?
Ya, I took the trade! What do I pay you for?;-) LOL
Just lock in some gains and I am rewarded
I’m up 26% on UGAZ. Never would have looked at it without being here. You’ve opened new sectors for me. Thanks
Awesome Bill…that made my day 🙂
good answer…. ;o) dont 4get CLNE.. o…m…g.. on launch pad.. https://www.tradingview.com/x/WjiYITOr/
Scroll up to my comment under the PLUG chart. I did mention CLNE, specifically to you 🙂
lol… sorry –just skimmed report this am…no time
Beautiful call on NATGAS, Alex. I added on Thursday with the added confidence of your outlook and that was a near perfect entry. Bueno
Yeah, so far so good : )
well said troy… i also took that trade based on your hard work & presentation….u should charge more … ;o)
Feel free to send donations to…… JUST KIDDING : )
Wo, easy there Maria!
…just sayn…. 😉
Same here. I added quite a bit. Bueno Bueno so far.
Wish I had. Been getting burned by nat gas for about 8 months now so don’t trust it. Now that a low is certainly in for now, will look to add. I was happy to wait for confirmation.
Ditto…burned twice last week and now left at the station as it leaped over the 50dma. Hopefully it’ll come back if not then maybe next time around?
Alex,
With BAS falling through the 50 last week, is it a sell if it re-tests from the bottom side….or are you still bullish considering an expected move in oil up?
Thx
BAS does have resistance overhead in various forms, one being that 50sma. It is quite oversold & oil higher should give it some juice, maybe enough to get back above, but it may not make it through on the first try. I dont think I’d sell the first test, but if it doesnt improve each day, it may be best to let it go and look elsewhere.
wow szym..
Glad I still have about 25% of my original position in SZYM. Was getting very tired of it. Some good news today.
TLT is rather sickly. Tell me this chart is not looking rather bullish: http://schrts.co/cn52l2 $TNX weekly Kind of an IHS look to it. And charging up the BB.
That said, I don’t want to be long or short this on a trading basis. Could go either way short term. But I really don’t think trying to catch this knife is a good idea, for sure.
Still looks as if it will retest the 200SMA at c122. But agreed. Looking sickly shortish term.
NB. Was sicker than this in 2013, everyone and their dog said rates now to rise for ‘ever’. What happened in 2014? Top 5 Biggest fall in rates since 1920s.
Not sure why it would necessarily retest 122/200 DMA again, but it could, of course. More likely a retest of 118ish at some point, which would coincide with a restest by $TNX of the green downtrend line on ths daily chart, http://schrts.co/Tkd1rK which would also be close to the 20 DMA
What’ll happen intermediate term? I don’t know. And won’t pretend to.
Hourly pos divergence.
However, could well see 114/115 before a bounce.
Indeed, with FIBs 111/112 is on the cards. That would take 30yrs up an enormous 50% on end Jan lows. That could tip US into recession.
REN has re-gained the 50sma and last time oil ran it went from $0.50 to $1.80. I am hoping this goes from here at least back to $1.80
and yes, Mari, SZYM finally breaking higher . CLNE Set up is still good, but not taking off yet.
Hey Alex, how does plug look to you? Fro? Still looks good to me just want to know if you agree
Hi Steven,
I still own PLUG and it looks ok, but its boring me to death. Refresh for a new chart. It COULD drop to the 50sma , but I dont want to see that since it breaks the channel. (Charts are click-able)
Fro needs to get back above the 10sma, but its still “ok” too.
Hey Alex, Thanks for all your help. I have only been here a few weeks and already hit a few nice ones. I took those shipping trades when you mentioned them TNK and FRO for nice gains. I am also in PLUG and just found out that they are one of the 14 companies involved in this insider short selling scam. http://www.sec.gov/litigation/complaints/2015/comp-pr2015-107.pdf
Thanks for sharing that Chris, and thanks for being here the past few weeks too!
Oh yes, Page 11.
No problem, hopefully they sort it out soon. I’m in two of the BIO stocks that are included as well.
Picked up a few solars this morning. SOL is at its March lows and TSL hit it’s 50DMA. Pretty tight stops. If TSL holds the 50DMA it might run a little.
These solar stocks amaze me at how often they can look VERY bullish and then die again. I really liked JKS breaking out a couple days ago, but waited for follow through that hasnt arrived . I also liked that Surge by SOL thinking it’d break right above the 10sma. Hasnt yet.
I look at the 3 yr weekly charts and do see some huge potential if they get going though.
I’m not saying this as a recommendation, just pointing out that BAA just closed that gap and tested that trend-line that I drew in the chart in this mornings report.
Better now than later 🙂
taking profits in ugaz/ng now or sailing higher through a possible pullback? plan was to swing but 3x move fast both the sides..decision decision !
REFRESH for chart
You can just ride this but 3x gets tricky. So AS A TRADER – Looking at how UGAZ last time…
1. Popped higher to the 50sma
2. spent days sideways
3. then dropped to the 10sma , then higher.
I personally go in strong at the lows and take 1/2 off here , just to feel better.
Great,Thanks alex.
i was just pondering the same ash….if I was holding it it my swing act… i would most likely hold… but – since I purchased it in my trading act… i believe – (if I hav tim)e- i will sell the pullback – which should be a good 10+% anyway right? if u care — here’s what Im following …. https://www.tradingview.com/x/oL1nbn1I/
im comparing setups now so I can time the switch&Flip .. ;o)
wow beautiful chart Maria,Thanks for sharing 🙂 i am holding it in my IRA So even more reason to feel confused :))
Maria, how do you derive point “a”?
anyone watching how ‘freakishly’ similar the patterns are… wow.. maybe we go sideways and down a bit tomorrow? see box
https://www.tradingview.com/x/VjluDDFr/
Bill: by many many MANY hours of counting & recounting waves – i used UNG then applied them to ugaz…I can show u weekly later if u want to see.
I was watching that MAria. I kind of pointed out a daily thought in the chart above UGAZ posted earlier, so …..What are you??? A chart Freak too?
GuiltyAsCharged…ima freak alright… ;o) my apologies 4 missing all the posts & repeating :-/ Im at work-so i can only scan & see some posts. Late tonite I will [hopefully] get to read thru everything & prob die of embarrassment for all my repeats..:-/
Awesome chart Maria! Thank you as well Alex.
Thanks for explaining this Alex.
I am in REN up 15%, plug down slightly, REXX above my breakeven and GDP down slightly from my purchase at 2.71. I look at miners and I am disappointed and it may get to an ICL soon if this is the start of the 3rd DCL, which could not be and still go down to a final 2nd dcl around 30 days. Anyway if march was an ICL in PM’s, july-august could be another ICL that could hold at higher prices in the pm stock especially the juniors.
That is how I see things too for GDX, that’s why I said I wasn’t taking that trade. We have had stop runs in this area, or could it roll over. Either way GOLD,SILVER, and Miners were too weak with t e USD down $1.28 at one pooint yesterday. Doesn’t “feel” like a comfortable trade
The energy sectors feels right for now.
REN – almost up 20% now. I know thats a lot, but I have watched this do that day after day ( Up & DOWN)
NADL taking on an interesting look too.
Gold very long terms – 2 possible outlooks and targets if directions take hold. May be of interest. Refresh.
1125 seems to be pretty important
Thanks JD
I don’t necessarily buy it, but 100% Fib retrace of 2008-2011 bull should be in the 830 area for gold. Technical targets like that are fun, but I don’t see how the fundamentals support that move. If it happens it would be QUICK! 1060 and the round 1000 are a few others I’ve seen multiple places.
Not sure what IT is that you’re not buying. The FIBs suggest if 1125 taken out (up or down) then the end targets are shown, as suggested by FIBs.
Just saying that personally don’t see low 800’s. Below 1125 feels almost guaranteed though.
Love how EXXI is setting up. (boring volume, under accumulation)
If anyone trades stocks under $1… I think the look of VTG as it re-gains the 50sma looks pretty interesting, maybe just a quick trade? Please beware of the penny stocks that may be financially struggling. I do not know where VTG stands .
How looks the charts of FNV. (Cad)
Well that depends. This week it got caught up in a little selling, but on a 3yr weekly chart it looks good. In a channel and also looks like it put the final lows in at the summer 2013.
Short term it will probably follow the gold market ( refresh for a chart)
Yep, a wonderful charts, still in the channel.
Many thanks Alex.
for the Traders here.
ZIOP is setting up for EOD ramp. (use $9.97 stop)
REN is having a homerun!
I was just going to post that. Up 25% YET…look at the stochastics . Lots of upside.
REN looks like CBAK 3 days agoi
The REN stochastics is just now rising above 20 on the daily chart.
more upside indeed.
PS: we almost fell asleep on it in $1.10s….
ahaha
Lets look at charts of MNKD and CMCM & use it to recognize that there will always be pullbacks to buy the one that got away.
Then lets look at NQ and say, ” Are you sure there Will be??” : )
Then BAA – Gap fills and trend line tests do happen almost all of the time
NQ dip this morning was perfect.
MCP looking good here
TGS looking interesting all of a sudden- strong volume, but I’d like to see it above the 50sma
Alex, very, very disappointed in my energy plays with oil up big and general market recovering from early swoon. Absolutely on cue, miners (index at least) rolled over with gold up, again. Hoping that energy stocks being down doesn’t portend badly for crude. API out with bullish numbers AH, EIA weekly inventory tomorrow morning. Be about it! But stay frosty.
I was pretty convinced bond yields had gone up too quickly considering Sep was earliest consensus rate increase. Thought TLT had a bit of a floor at 117. Especially with recent market weakness. Yep. Wrong. Barring overnight hijacks while likely exit at tomorrow’s open.