If you have been trading certain Biotech stocks, the markets have been exciting, but if you’re watching for a directional move in many other areas? Its been a little boring, maybe a little frustrating. Lets look at the charts…
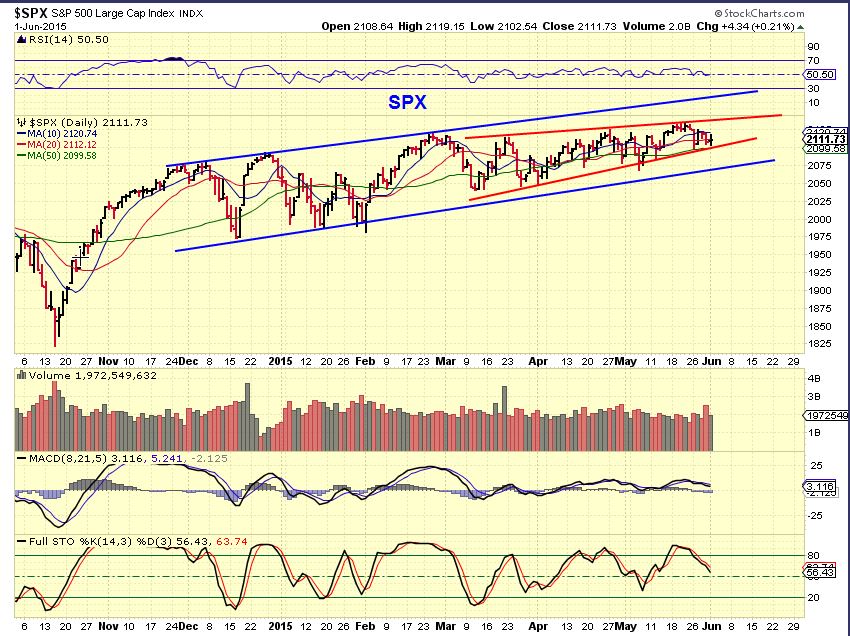
SPX – Sideways for most of 2015 really. Frustrating for many. Give me a break (out or down please) 🙂
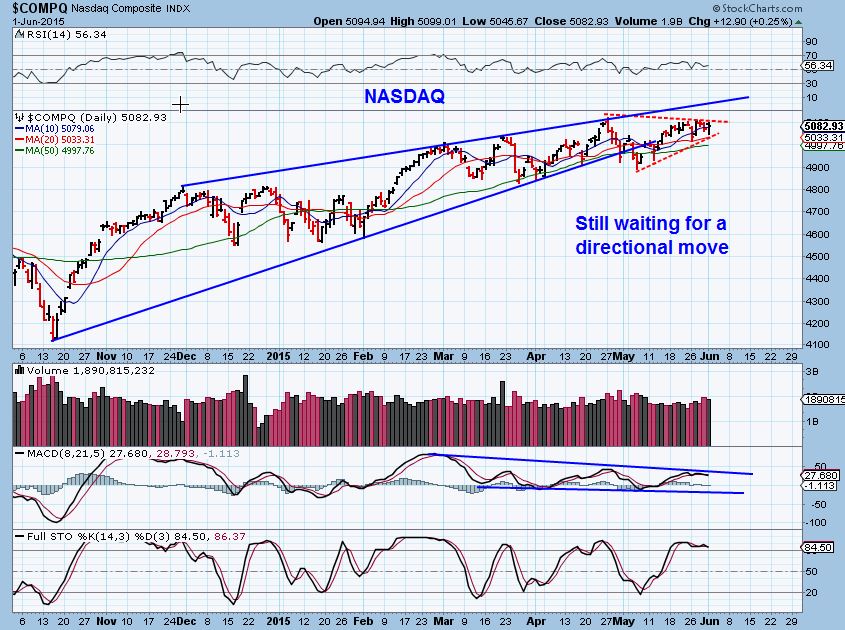
The NASDAQ is overbought , but it can stay that way if it breaks out. It too has been sideways and Frustrating. This set up is more bearish as a rising wedge that we have watched form since Feb . A clue that it is more bearish than bullish is…
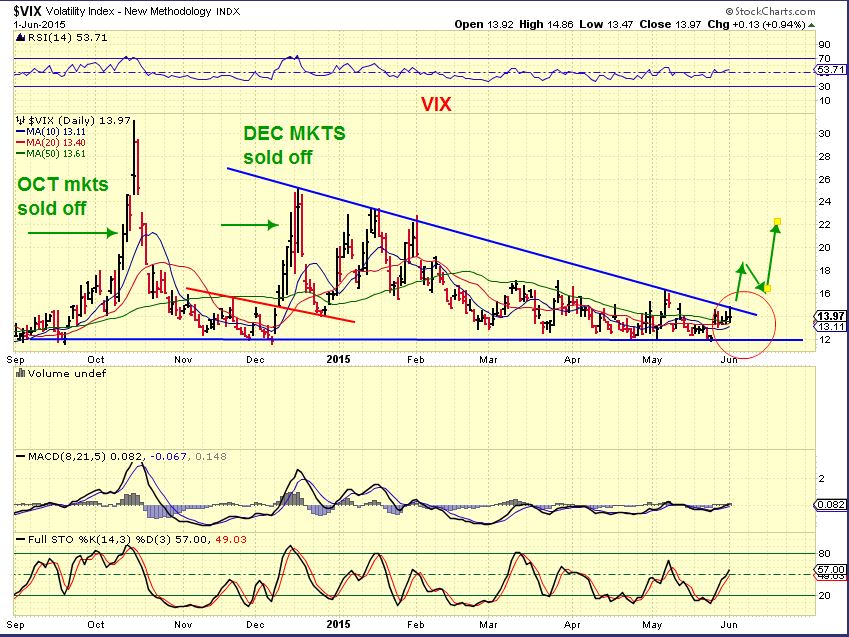
The VIX – It shows complacency and is near lows. When it bounces , the markets correct. Notice the October & early December bounces in the VIX and then look at our SPX or NAZ Chart above for Oct & Early Dec
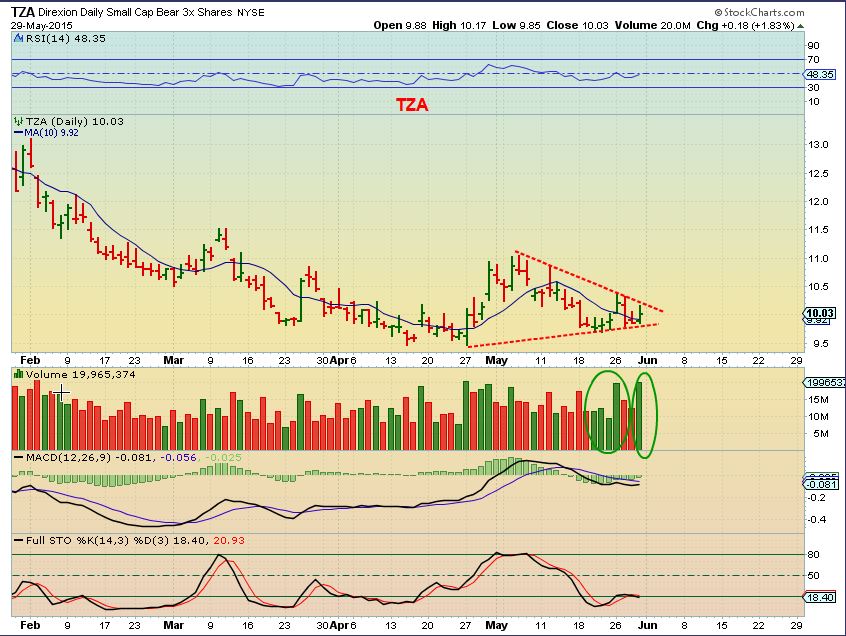
A chart From the weekend report- It is not time yet, but If the markets do give it up and start dropping you can go short. If you are uncomfortable shorting, there are inverse ETF’s like TZA, SDS, SQQQ that you can go long and make the trade. These are leveraged so please know the risks if this trade goes against you , losses can add up fast.
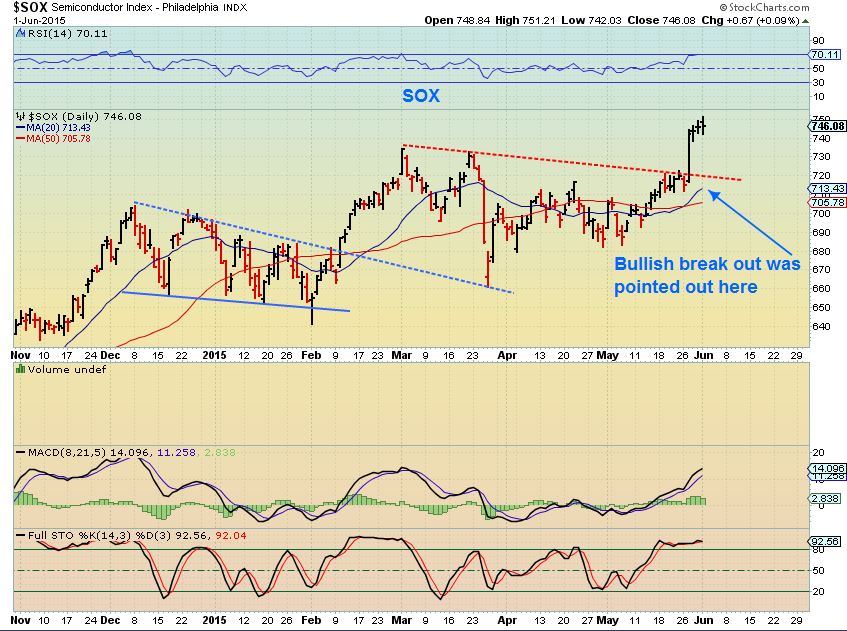
It needs to be noted- SOX broke out as pointed out here last week and has had follow through. This just adds confusion to the mix if you are bearish SPX and DJIA , but it safely keeps us from shorting other areas early in case this becomes a leader and others eventually follow.
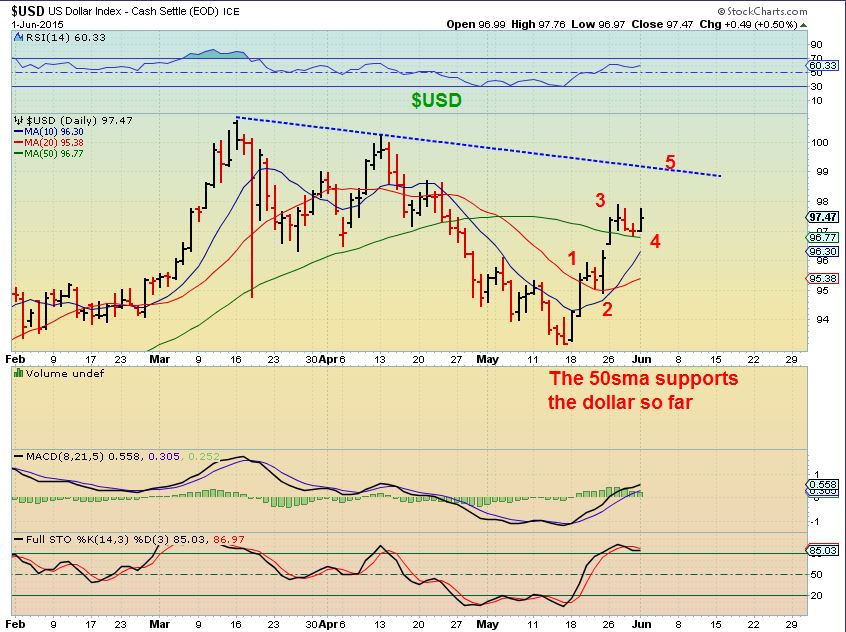
The USD– The dollar recovered the 50sma and has had a bullish move higher. Watch $96.77 / the 50sma for support. I am not an Elliot Wave guy, but I do see 1-2-3-4-5 patterns and A-B-C corrections etc all the time. If the Dollar hit the blue line now, then maybe you’ll see Gold drop further into a Daily cycle low. The dollar could then pull back allowing Gold to move higher. Lets look at Gold…
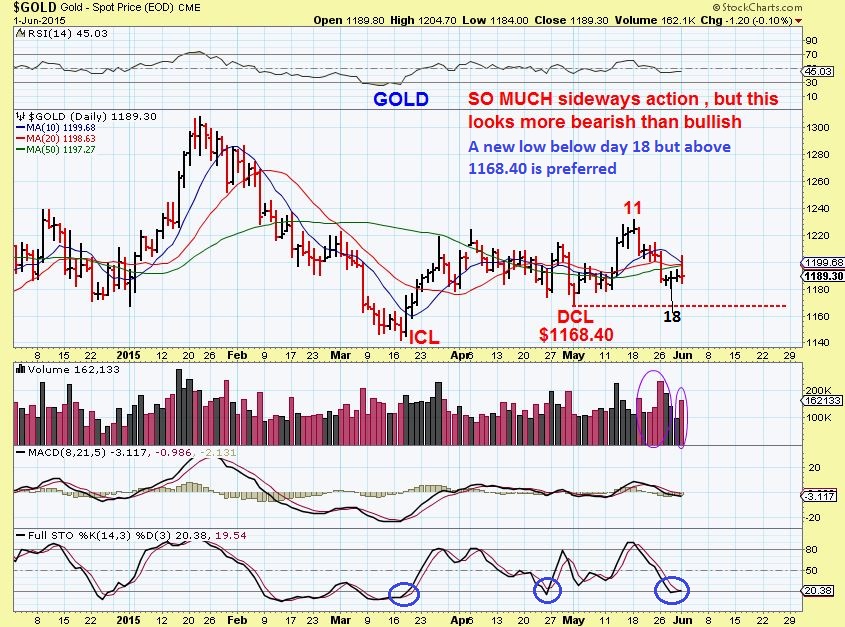
GOLD- Sideways and Frustrating LONGS & SHORTS for weeks . Day 18 could have been an early DCL, but this looks weak. If the USD moves higher, I would love to see Gold go sideways & drop below day 18, but hold above $1168.40. This could give us a daily cycle low in the 20’s count. GOLD is in an oversold area.
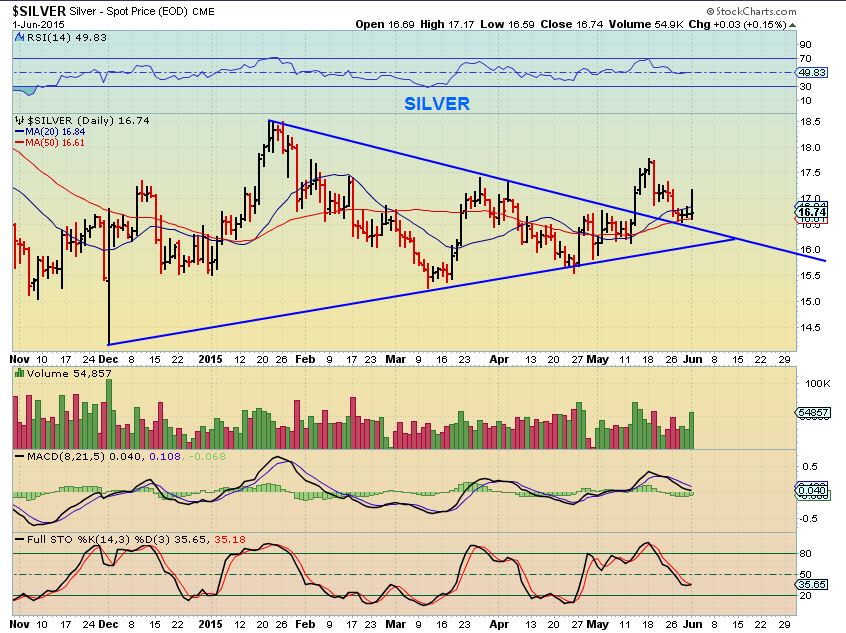
SILVER– for 2 weeks the Silver COT shows commercial Smart Money very short silver. Silver remains above support & the 50sma. I dont like to bet against Smart Money, but if Silver holds up and goes higher it could cause a great short cover rally. We are only in a second daily cycle so The Cycle Timing doesnt really agree with that unless we are in for a huge bullish surprise (Unlikely, but possible). There could be many weeks of downside if this breaks down. Right now Silver has Higher Lows since December, it is strong and could go sideways for a while too, so I wouldn’t short it until it breaks down. If SILVER & MINERS lead, they have shown strength.
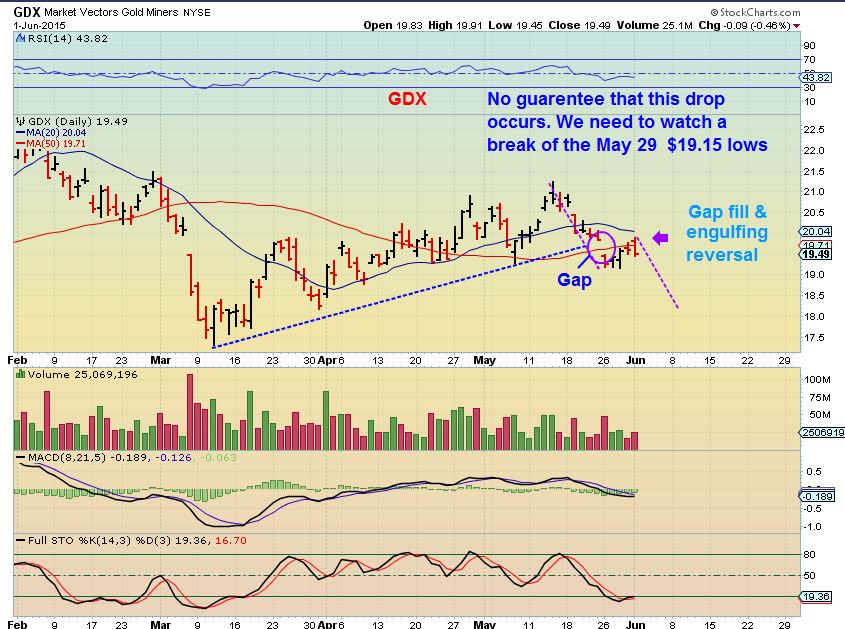
GDX- Monday price gapped up, filled a gap from last week, and reversed lower. Frustrating . This looks bearish as an engulfing candle. These markets are sideways and frustrating so far, so I’m happier on the sideline for now as things play out. GDX gained & lost the 50sma yesterday.
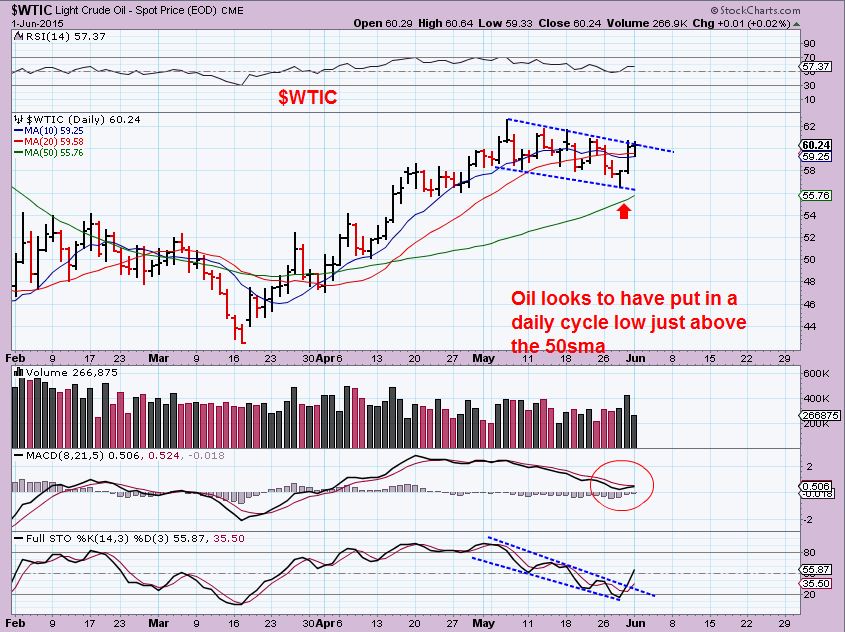
WTIC – A bullish chart. I mentioned that I bought UWTI last week. If you are trading OIL with UCO, USO, UWTI or another method, things look good . If you are using Energy stocks or XLE/OIH? Frustrating. It has been disappointing since they aren’t following OILS lead yet. I got 3 emails asking me why, and I cant say why. I definitely thought that the energy stocks would follow OIL in a second leg up. The move in Oil looks real. Does that mean that OIL is not going to follow through? Is oil heading down One more time to the 50sma? Are energy stocks just waiting for OIL to break to new highs? When these questions arise all we can do is stay alert and trade accordingly.
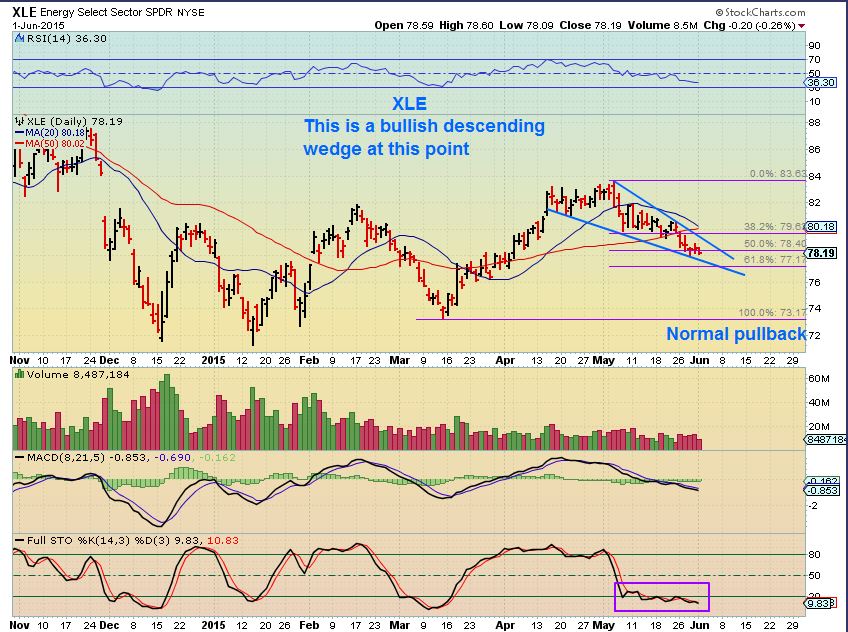
XLE- This still looks bullish and is oversold. IT should move higher today ! It is a normal healthy pullback. Note: Sometimes MINERS dont move when the move in Gold isnt “real”. Are Energy stocks saying that OILs move isn’t quite “Real” yet, and will pull back 1 more time to the 50sma? Or are they waiting for OIL to make new highs before joining in? I dont know , but if you own USO, UCO, UWTI- keep alert to that idea.
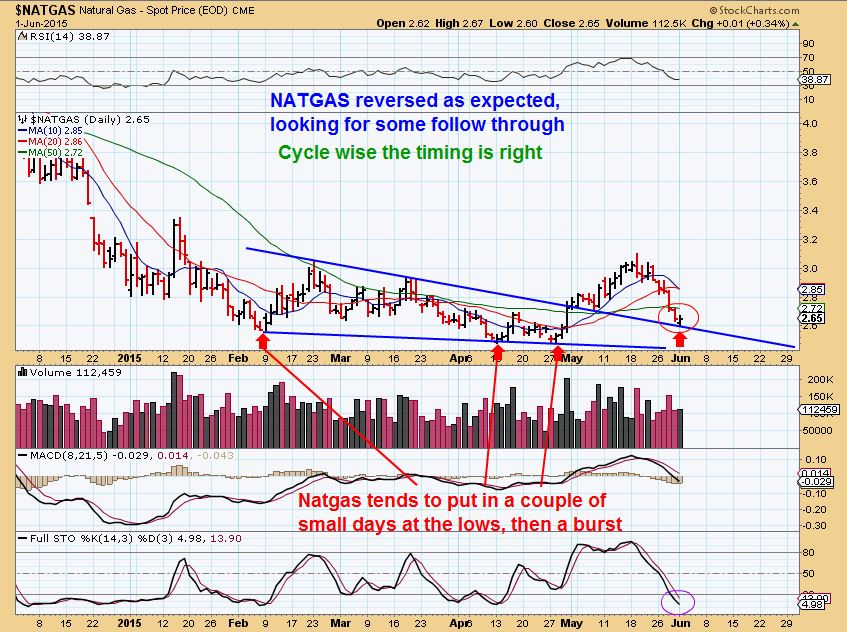
NATGAS– I have mentioned that NATGAS needed to pull back further and we are in the area that I was looking at last week. We also saw a reversal yesterday, so some could buy here with a tight stop or wait for a break back above the 50sma with a tight stop there. I dont like to recommend 3X ETFs, because there is added risk & you each have your own risk levels. NATGAS/ oil stocks like XCO & UPL ( some trade UNG) may react well after their recent pullbacks. ( Leveraged ETFS are UGAZ, BOIL, etc)
.
So really, its a mixed bag of information. Whip-Saw action is relentless and Suddent Rallies, then sudden drops add risk to most trades. Certain areas need more time to clarify the picture. There are so many sideways markets that the future direction is hazy. The SOX breaks out higher while other sectors have bearish wedges and the VIX is at lows that usually cause a pull back. Will the Sox break out eventually fail or is it leading? CY, TSEM, and a few others dont look bullish or bearish. Frustrating . Oil turns higher almost exactly where we expected ( above the 50sma) and looks very good, but Energy stocks are not responding . Will OIL make 1 more drop to tag the 50sma? Are energy stocks just waiting for new highs in Oil? Gold has been sideways for weeks if not months, and some MINERS look bullish, others are at lows. Another mixed bag, but I dont like the set up here for longs. The COT is bearish and there is still time for more downside. THAT downside could also cause a failed daily cycle if it drops too much. BIOTECH STOCKS are breaking out everywhere. I have a long list ( I dont own any since selling the pop in MNKD). Is basically only own stocks that I bought much lower (BAA, GSS,) and PLUG, REN, UWTI, and I added UGAZ last wk at these lows). I am basically in trader mode & may enter the sidelines when I finish a few of these trades. There are ALWAYS good opportunities lining up for the patient traders.
For now I want to release this so it can be read at least an hour before the open. I will add some BIOTECH BULLISH looking charts while you all are reading this . Check back *(refresh) in a while or you can look in the comments section. I will write in the comments section to let all know when I am done adding charts. Thank you all for being here!
~ALEX
I just want to add a couple of charts that look set up pretty good. The charts show you what I am looking at , BIOTECH & PHARMA are exploding, but please do research. I have made Good money and been cut in half on Biotech earnings reports in the past . I will also add a small list of others that you can look up on your own if you wish, to see how they act before & after breaking out, etc.
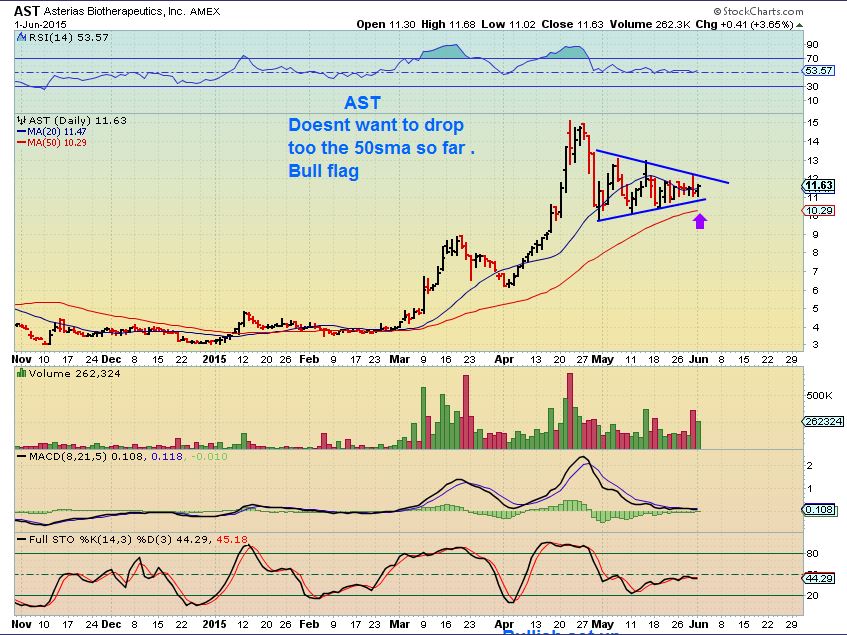
AST – Nice run, nice Bull Flag. Buy a break out
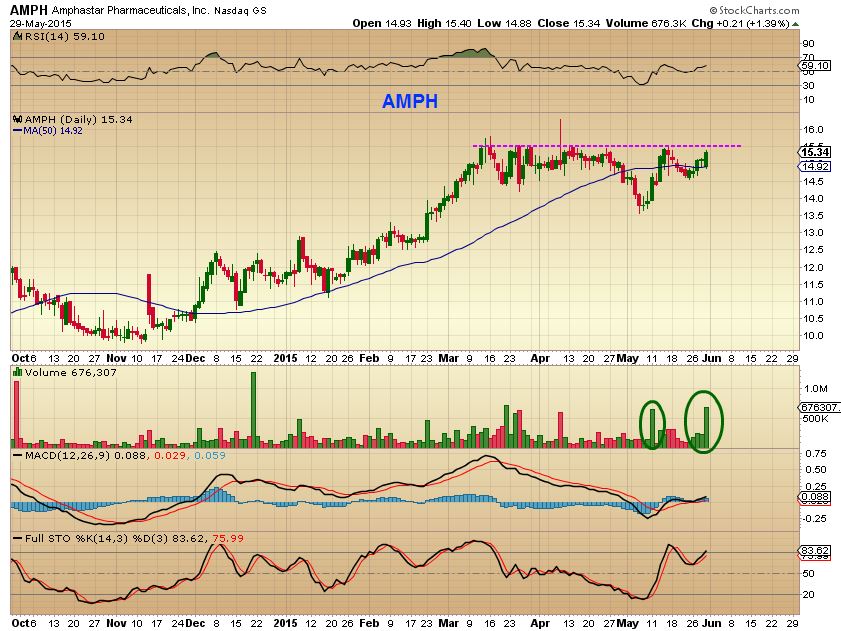
AMPH I posted this on May 29 ( Still valid)
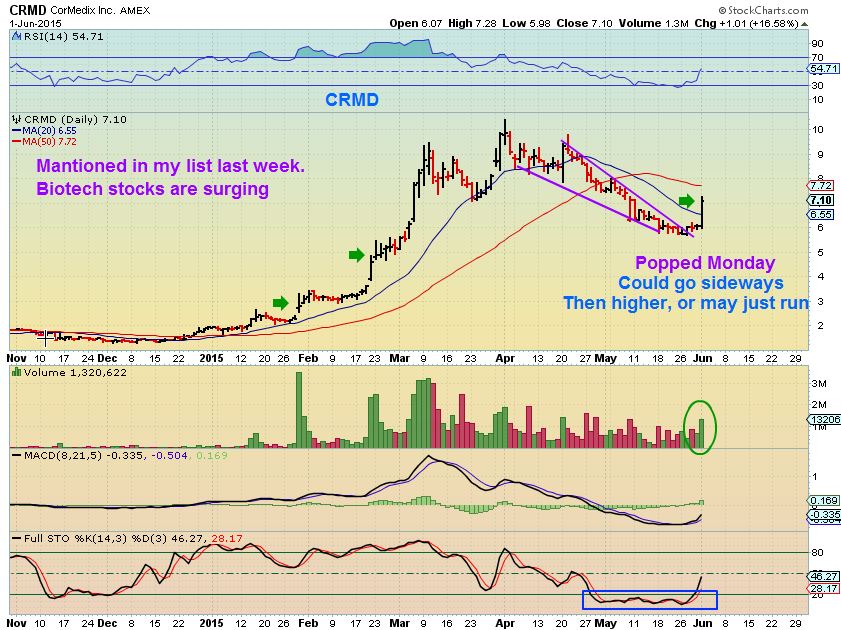
CRMD– I mentioned this last week as a descending wedge. It broke Monday and may pullback for an entry . In the past ( green arrows) it Popped , went sideways and then higher. You could look for that too.
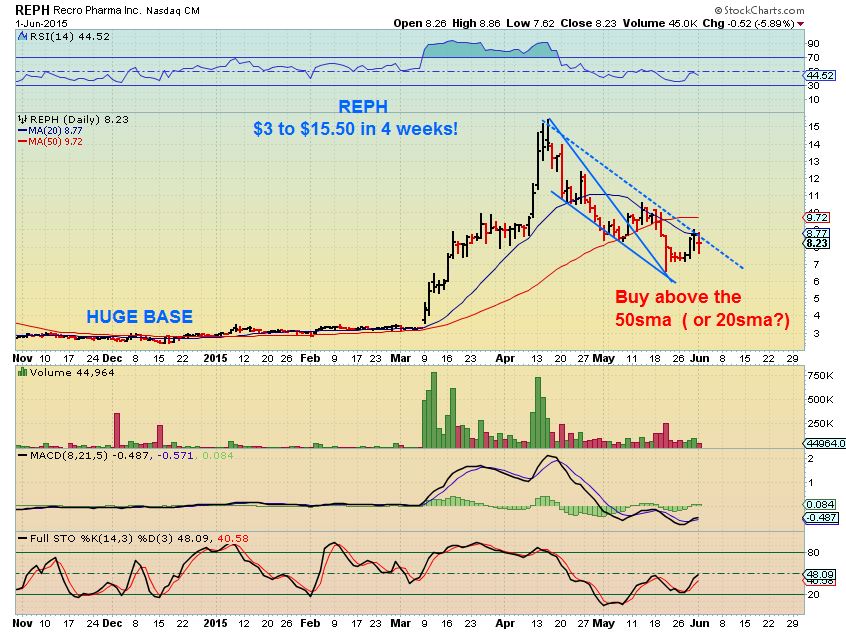
REPH– Broke a wedge I was watching and back tested it (forming a blue channel). A break above this channel or 50sma may run fast. This went from $3 to $15.50 Quickly
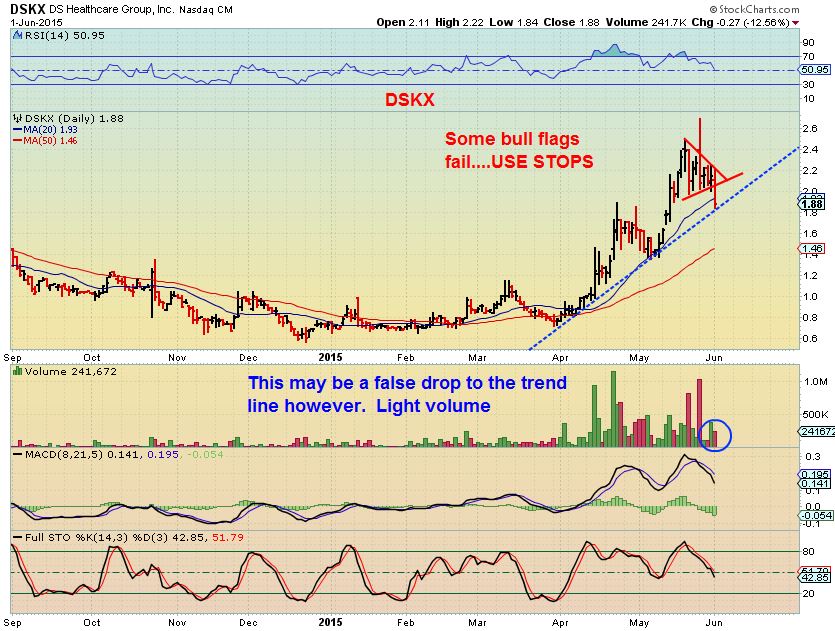
DSKX– I just wanted to show this bullish set up ( bull flag) because it looks to have failed. No News. MOST bull flags follow through, but any can fail, so we use stops. I actually think this drop may be temporary, just down to the trend-line. It was fairly light volume and price is still well above the 50sma.
You can look at charts of CBMG (good one) OXGN, PRAN, GALT,AMPH, MNKD, ONTY, CBLI, ADXS, and NVGN ( NVGN is good but now failing). I like to look at these to learn how some break out & some fail.
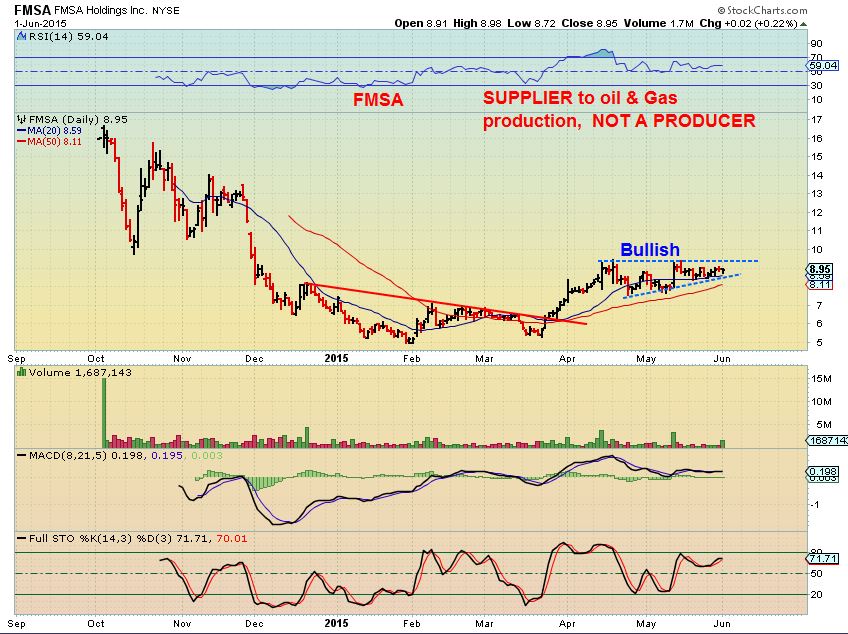
FMSA– ( provider of supplies for the oil sector)I posted a chart on this last week. It has gone sideways , getting tighter. It could pop & run higher fast
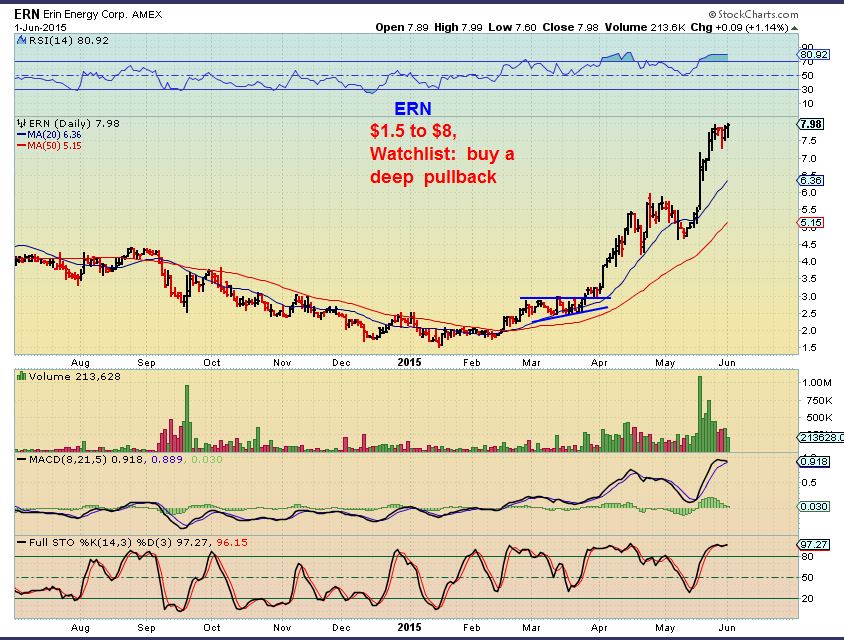
ERN: I just wanted to show this. I missed it and it is an energy stock that just excelled. It goes on my watchlist for a pullback
The Health of The Markets 
 BOOM
BOOM
Scroll to top

Good run down, Alex. I think the only ones making money in this market are the option premium sellers! (as usual)
yes, and afst traders. If we see a good set up and trade it, locking in gains in a day or two instead of waiting on follow through, that seems to be working too. I hate fast markets like that , though. I am more inclined to buy a low risk entry and ride a move for a week or two.
Those set ups come at ICL’s in GOLD – I look forward to that 🙂
I have added additional charts and comments to the end of this report. Thx for your patience.
Thanks Alex! Question, I know from experience in GOLD that gold can go up and the miners can fail when a market correction occurs. Is the same true for energy stocks?
Hey Bill, thats a good question, but I am unsure..
I havent seen GOLD go up and Miners fail in a sustained manner really. I have seen gold go up for a couple of days while Miners drop and markets correct. Usually Gold drops soon after ( just a bounce in Gold). I think If Gold went from $1200 to $1450, Even a market crash wouldnt likely hurt Miners unless they were heavily hedged, because they’d be making money on the price of Gold.
As for OIL & Energy stocks- I would think it would be the same. If OIL recovers, their earnings improve and uncertainty goes away, they should recover despite the markets too, but I am not speaking from experience . IN 2008-9 , OIL bottomed and rose in the spring of 2009, and XLE followed slowly, but so did the markets. Its somewhat the same now, XLE is not at lows, it is just in a different rhythm or something.
Dollar’s getting pounded here, though gold’s reaction so far isn’t impressive; follow thru is the key.
The 10s:2s will be helpful with likely direction
Lets see if THIS pop in PLUG will get some folllow thru ( since it keeps trying and dropping back down). WKLY set up is still good
Hope so! I could use some more good news in my portfolio. Fading a bit now though.
AMCC is popping again. Easily my best stock of late.
I dont mind if PLUG wants to do a gap fill in the first hr, I just want ti higher at the end of the day 🙂
AKS (and other steel stocks) is popping nicely, back above the 20 DMA. I was getting a bit worried as it was looking like a consolidation under that MA for a move downward.
TLT is looking an awful lot like a failure at the 200 DMA and that prior support pivot of 122(ish). Very interesting
Not sure about that. RSI and MACDs off their lows and trending towards 50 and 0, respectively
Well we’ll see. The 50 DMA is trending downward pretty steeply and $TNX (the ten yr but still important in the larger picture) is on the verge of breaking the downtrend from the high of Jan 14.
We’ve got two levels to watch: the prior low at about 118 and then 123.75 or so.
Interesting moves by CLF, VALE, FCX – Still resistance overhead with 50sma, but these moves look nice so far ( Even coals? lol – Aluminum ( AA & CENX) and Steel stocks .
NOR?
No volume , but it is aluminum and may play catch up. Good for a watch list I would say
ur NQ is poppin CF…
Sure is huh? Right out of that base, very nice. Many of the Mobile stocks are healthy CMCM, NOK, NQ, etc still watching “S” : )
Hi Alex
I’m fully leveraged in BAS, just wondering where you see some resistance , finally follow through today from the bounce off the 50. In regards to cycles and timing, are we expecting this move in oil for just a few days ( can we get to the mid 60’s.. I believe we have inventories tomorrow and OPEC on friday? Thx
I’m in BAS as well. Possible H&S pattern forming, probably not. Next resistance point will be around $9.37 the left shoulder. If we get through that then look for $9.60 to $10.00 range.
Cycle wise you would expect this to be the start of another run, just like the first run up, there will be pull backs and down days, but I personally am thinking thatt OIL goes through the 60’s .
What’s going on with natural gas? No point entering now?
Look for a double bottom at $1.73 very low risk entry. UGAZ
Hi Rick, I wrote a new report, I bought UGAZ again.
So I did….. @ 1.82
Congratulations. !!!
Alex, you laid out that rounding pattern in MCP last week. We might have the low risk buy Today. Very close to the lower trend line currently (see below).
Good call, it actually reversed higher today ( still red) I’ll be watching this if commodities run higher.
The only thing that scares me is the possibilty of going under? Thoughts
my2cents ;o) if your worried — pick sumthing else then Bill.. sooooo many R exploding right now — starting C up..
Maria, its not an energy stock, its rare earth mining. Its at $0.34 very close to extinction. BUT could be a real lottery ticket if it were to take off. Used to sell for almost $80
giggle.. yes, ive traded it many a time – had some W I L D rides.. but it is a lottery ticket.. 4sure.
Gold and Miners still confusing. I’m not buying any of these gains. Temporary
Agree
Good Morning,
Energy stocks doing pretty good today……moving Stops up.
Bght. Nat. Gas just now. I prefer UNG Oct. Calls. FWIW
Missed SODA at the 50sma this morning…..grrrrr
FCG ready to launch? long GASL
I like what I see, nice chart
Just bought UGAZ $1.85
nicely done. Loving GASL move. May it last
Nice descending wedge there LeChiffre
TLT anyone ? Dipping my toes in.
Nope, I think it’s ugly. See below.
To expound a bit more: It’s making lower lows, lower highs. It just failed to get above the 200 DMA and the 122 pivot and on high vol. It’s not oversold and the bounce it just had looks like a counter trend bounce that couldn’t even reach the 50 DMA.
TLT on the Weekly Oversold and just finished an ABC wave 4 Correction.
I am wrong if TLT falls below 117.88.
Very small risk with very good reward imho.
I wouldn’t enter right now instead take each day at a time and wait for internals to solidify
ANR – I know I know. Up 8% today. Internals look mildly positive as if base formed or forming.
I personally am avoiding Coals, but these may be the lows.
BTU is actually a company that I think will survive and even recover nicely. WLT was going bankrupt and suddently it double bottomed and is recovering a bit over time
With the dollar taking a dive, why isn’t gold reacting more?
I would say more to the point why haven’t silver and miners fallen recently?