The charts have lots to say, lets just look at the charts….
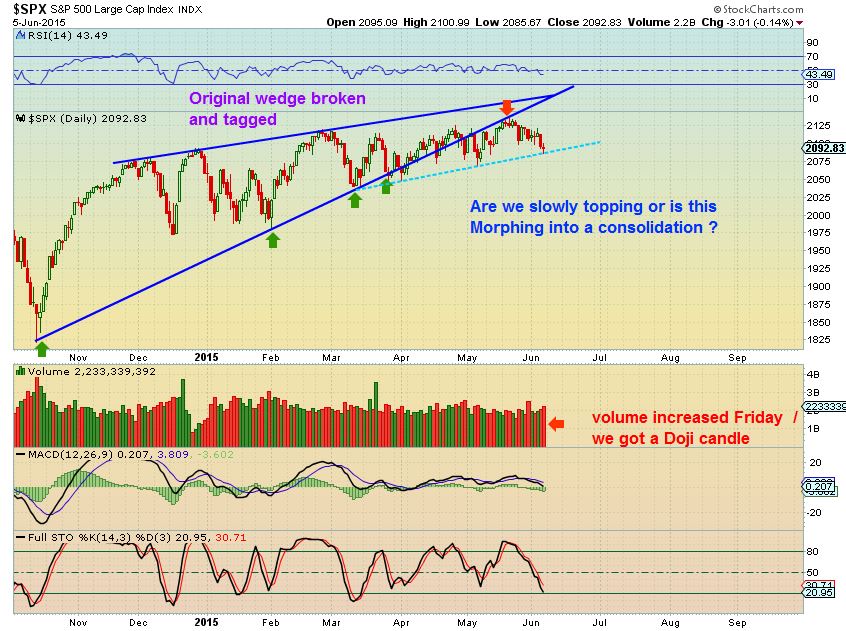
SPX– I have been watching a wedge pattern for months. It looks a lot like it broke down & back-tested (Orange Arrow) It needs to break higher real soon or it will continue to just roll over.
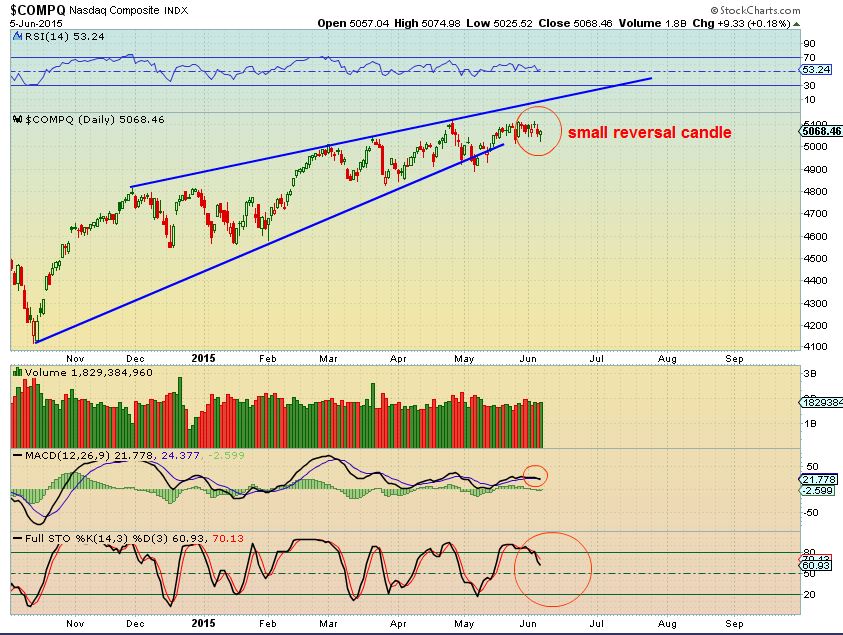
NASDAQ – has been strong , but looks like it wants to roll over too . I see a reversal candle Friday , is it ready to bounce? The sideways chop and whip saw action may continue.
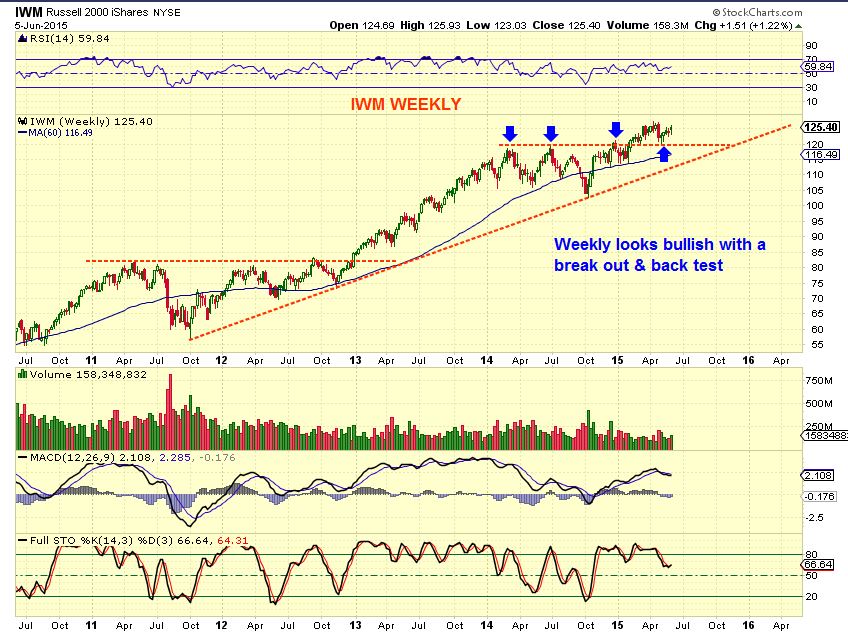
The IWM looks bullish on the weekly chart
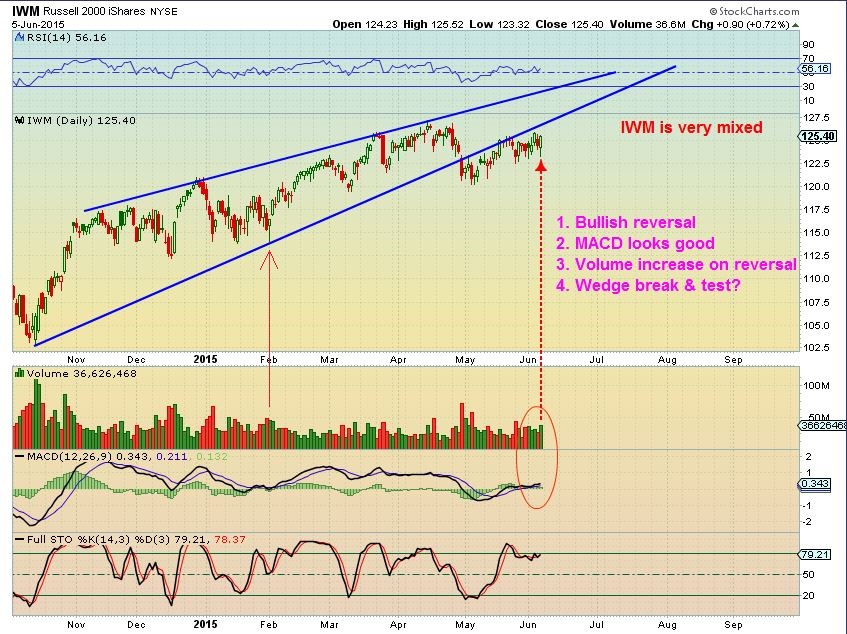
IWM DAILY – Not so bullish, we see mixed signals between the wkly & daily. Did it break down from a wedge & back test?
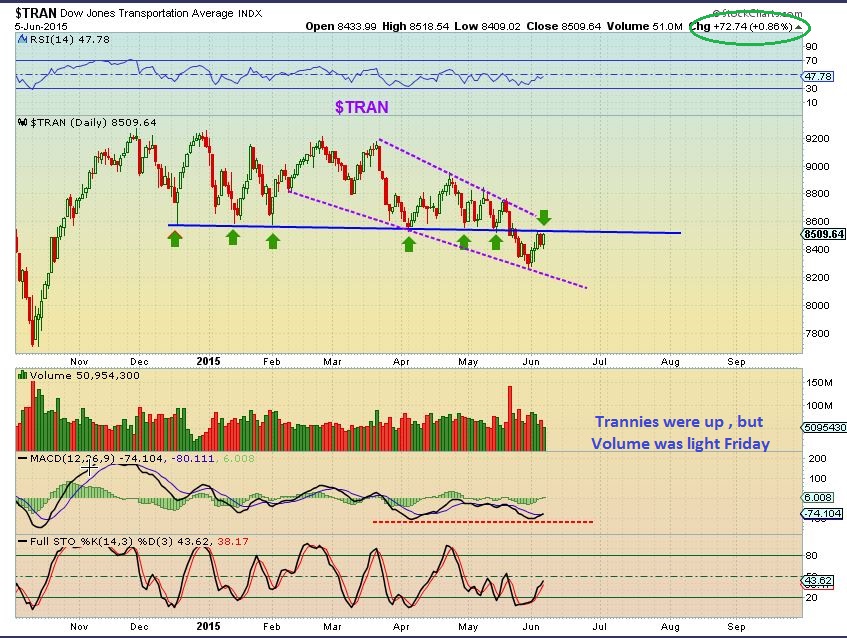
$TRAN – this is part of the Dow Theory , and it is still a break down & back test. Next week should tell us a lot. There is some divergence in recent lows.
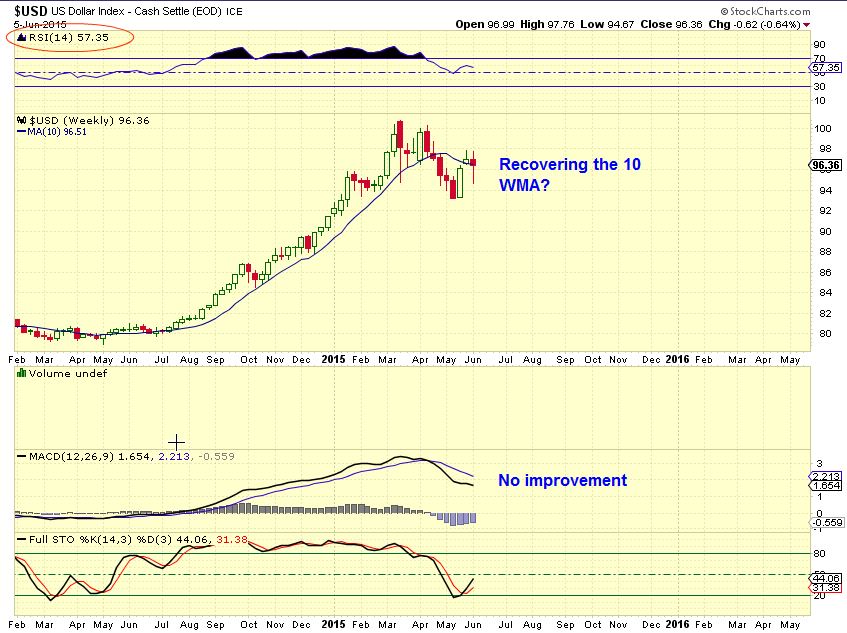
The USD WKLY– almost recovered the 10 WMA. It was a decent sign of weakness and strength all in the past couple of weeks.
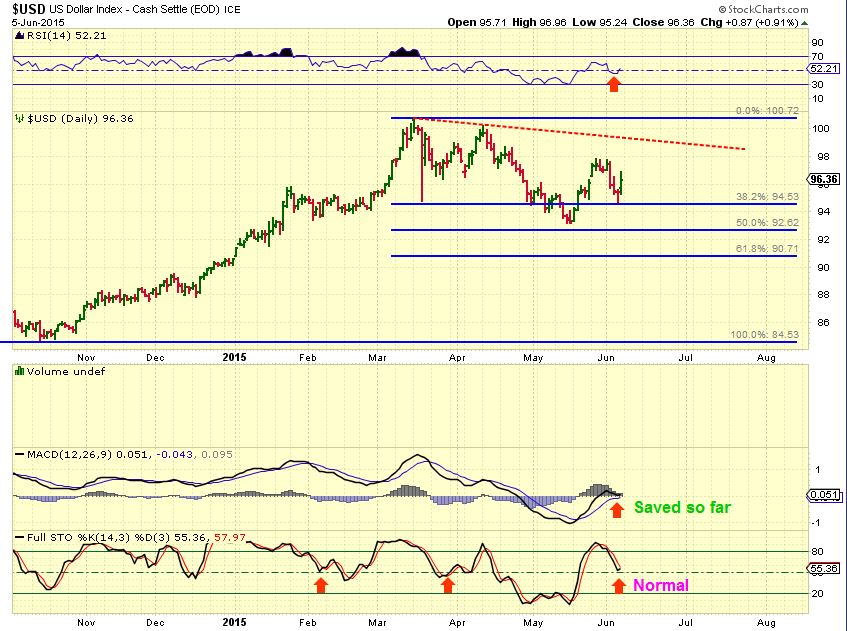
$USD– Amazing bounce off of fib #’s lately.
WTIC WKLY– All you hear about mid week is how dreadful oil sold off. Really? 6 weeks closed at almost the same price on a weekly chart.
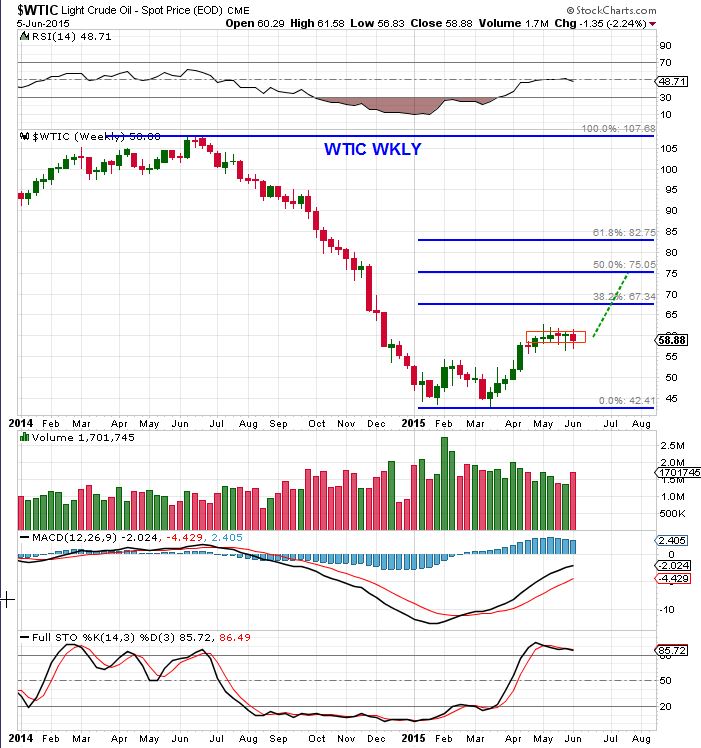
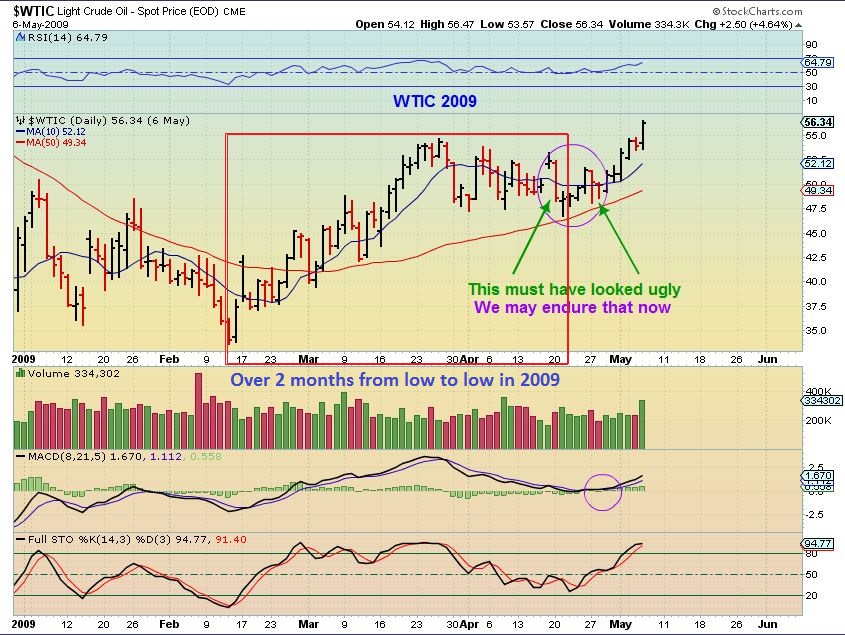
With OIL selling below $60 – People in various blogs & CNBC were calling for that drop to below $40 again. I pointed out the 2009 lows with these charts showing that 1 day slam downs happened then too. In 2009 , OIL remained above the 50sma.
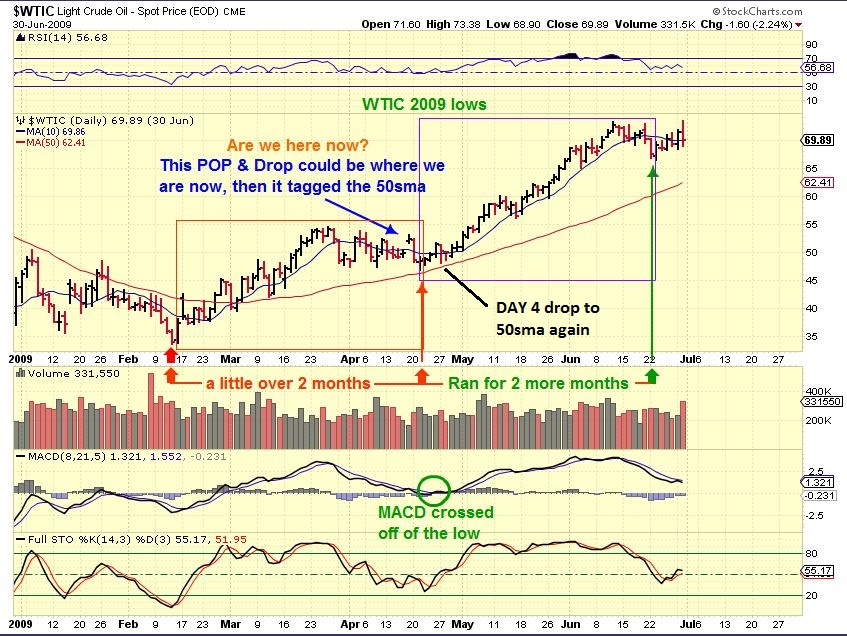
Also note in 2009 – OIL bottomed in Feb & 2 months later was going sideways for weeks . It slammed down & recovered repeatedly. Therefore we should expect volatility until the next leg up ( or down ) takes hold. I say we go higher. .
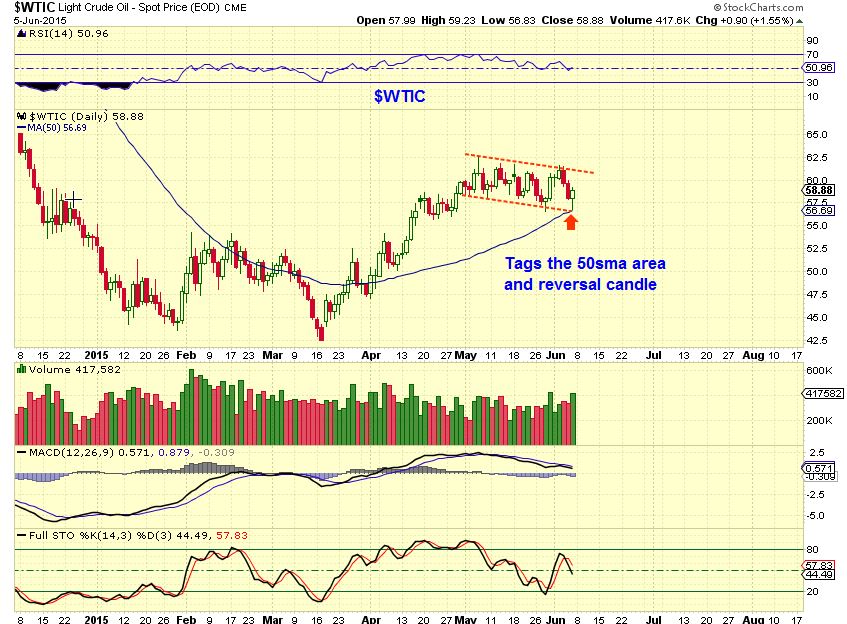
2015 WTIC– reversal at the lower channel & the 50sma area. Was that the lows 7 days ago? It looked like it, and that reversal Friday was a low risk buy. A stop below the 50sma works. For confirmation, look for a break above the upper channel line to end the consolidation.A break below the 50sma and I think OIL sells off.
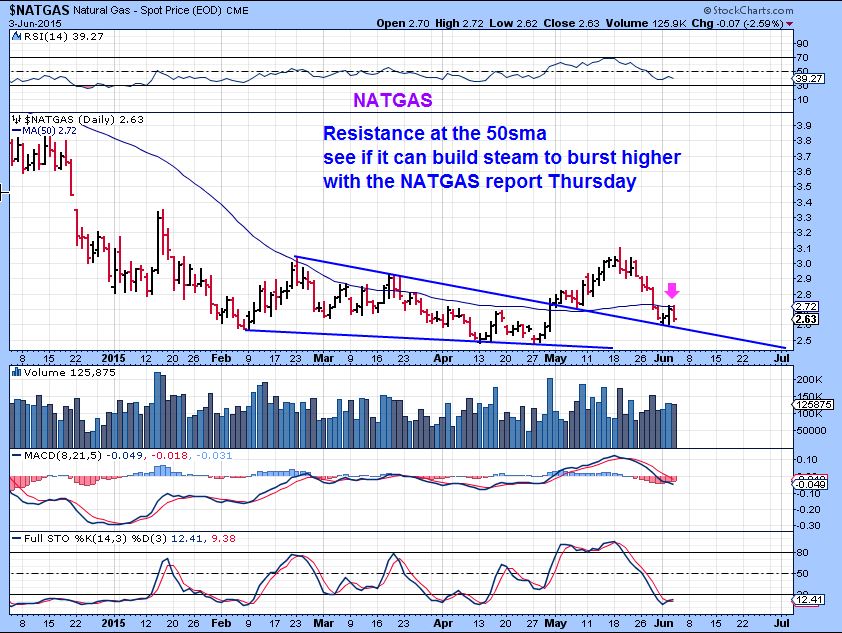
NATGAS– this is the chart from Thursday . Price is still in this area at $2.59 on that trend-line. Cycle-wise I would think that this has to be the daily cycle low forming. We need a bounce above that 50SMA for confidence in a second upward move..
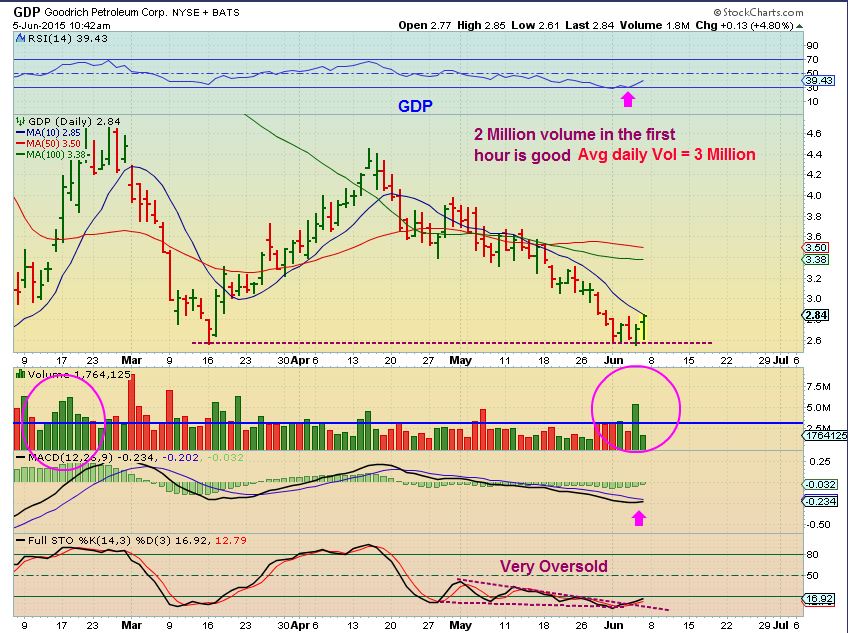
I bought some Energy Friday because it is in a low risk area. For example, GDP. A stop can be placed right below recent lows, and I saw nice volume coming in. I mentioned it in the comments, but not in an “ALERT” , because OIL needs to prove itself. I am a trader and take trades as they come, others may need to have a “proper set up”to avoid continually stopping out. So If OIL starts moving higher, I will post some trade set ups this week.
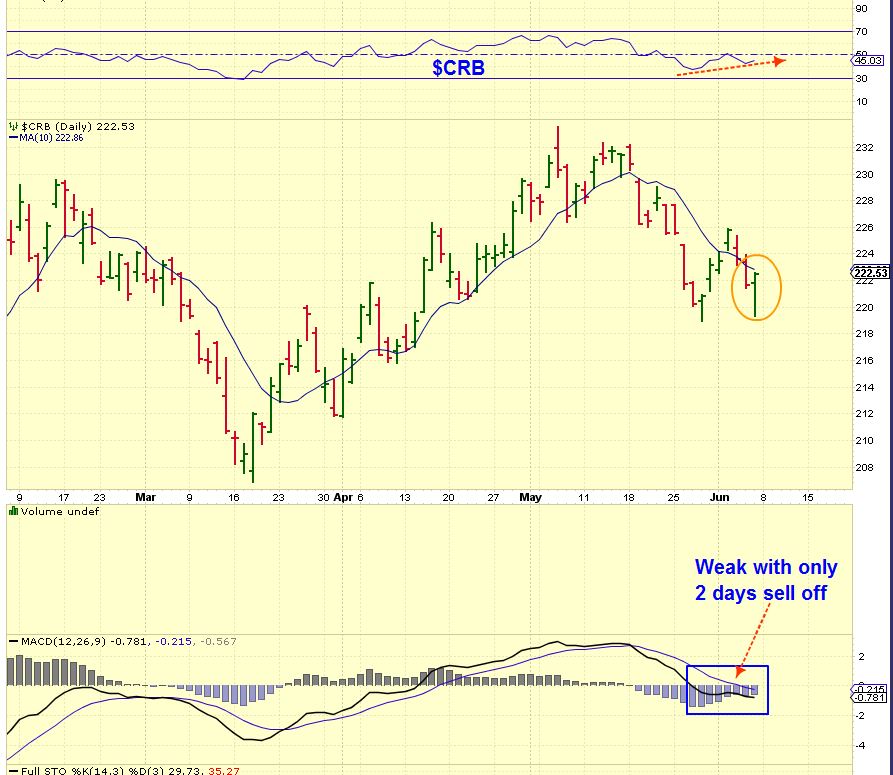
The CRB put in a strong reversal Friday above recent lows.
GOLD / SILVER / MINERS
I have a lot to say, but I dont want it to get confusing. GOLD has been frustrating for traders, moving sideways for weeks. I dont expect that to change too much this week. We could be in the area timing wise where we get a DCL ( Daily Cycle Low). That would end the 2nd daily cycle, and now the 3rd daily cycle would unfold, but I dont expect a lot of upside . 1. We are in a left translated cycle. 2. We broke the recent lows, a sign of stop runs at times, but also weakness in a 2nd daily cycle. 3. SO For this 3rd daily cycle, We could bounce for 8 days or so and then roll over. I’m not playing this, but may short a weak bounce if that’s all we get ( Dust). The hard part is Miners are holding up rather well so far.
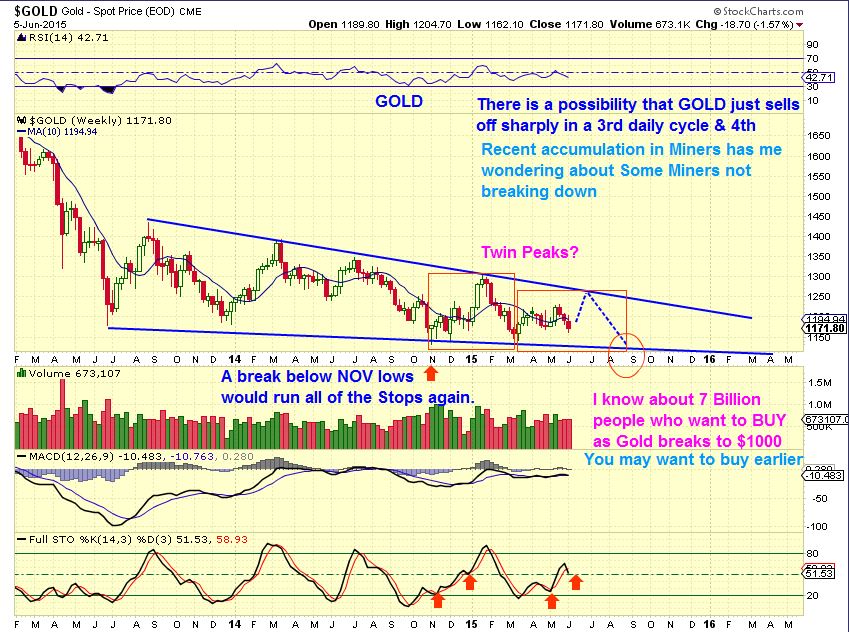
GOLD – Doesnt this set of daily cycles look very similar to the last intermediate cycle? 1. Run upward from lows 2. Spike a peak Green arrow 3. Then roll over to a DCL. I see a reversal candle Friday ( Red circle). I just dont think we break to new highs above the green arrow this time. TIME WILL TELL.
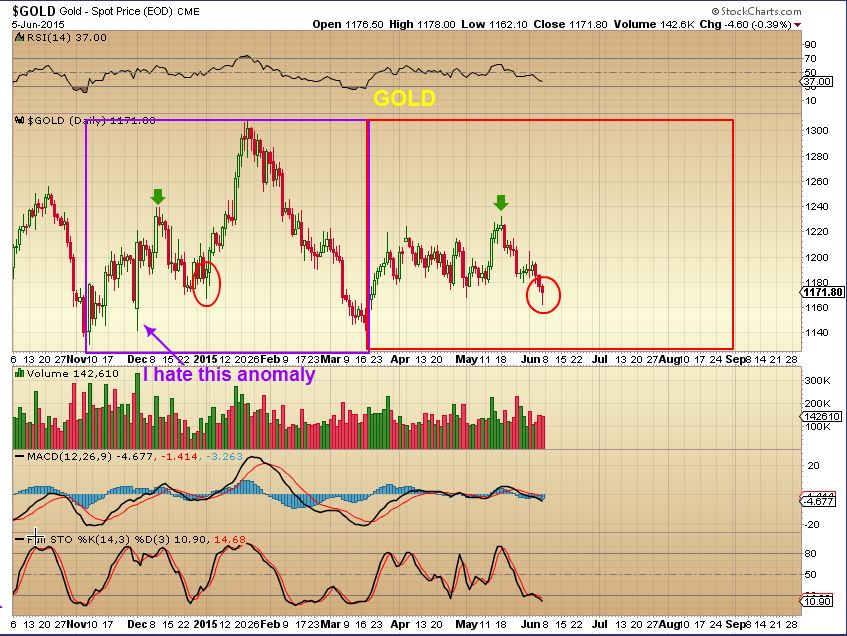
GOLD has become much harder to trade after an ICL is in place with all of this whip-saw / sideways action.
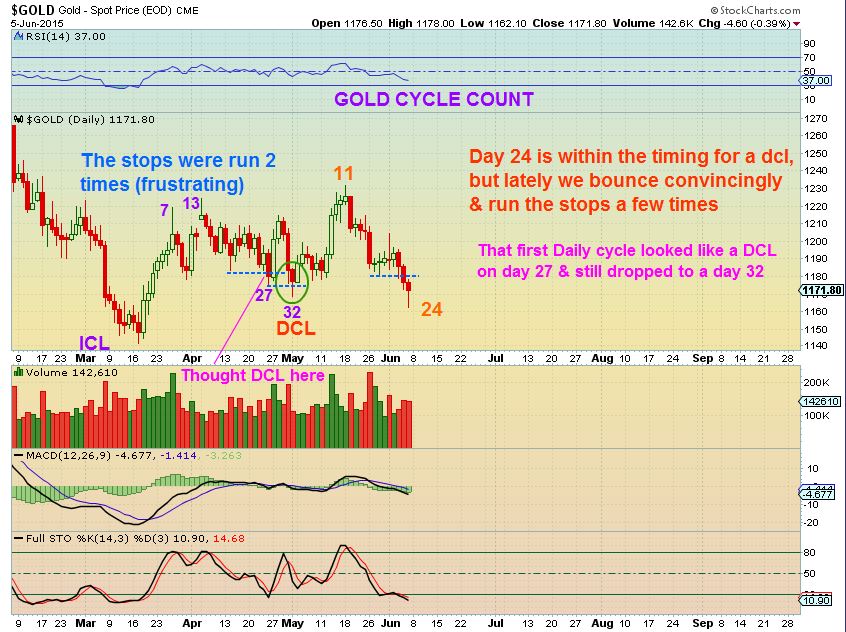
Notice below – Golds last daily cycle. ( Call this GOLD CHART #16 for reference )It looked like a DCL on day 27 in April. It Popped higher with strong price action for 2 day , then rolled over to day 32 low to shake out all the longs. We are at day 24 and that strong reversal looks like a DCL…is it? One thing is obvious, the day 32 lows were broken Friday and this indicates that this daily cycle will likely roll over early. It may be tough to trade unless you are in front of your screen.
With that in mind, I expect this could play out, BUT dont be surprised if GOLD doesnt get above the last peak around $1232 . I drew a sell off toward last Nov’s lows that would come as the 3rd or even a 4th daily cycle falls towards its daily cycle low into an ICL. Will Gold crash to that $1000 level? Everyone and their families expect it…I just dont know.
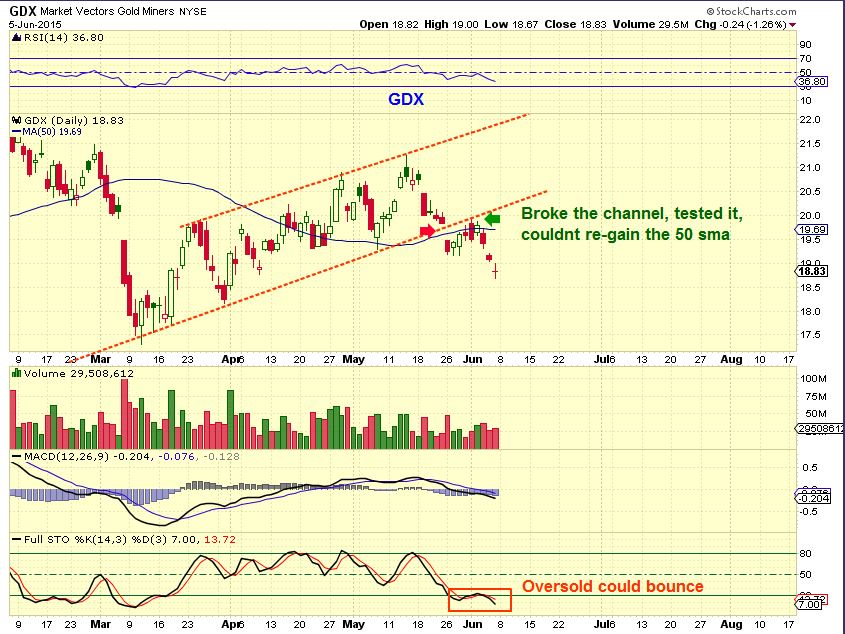
Since I have a few other things that I want to discuss with Silver & Gold, let me just quickly show the GDX for now. It dropped and doesnt look all that positive the way I’m seeing it. It is oversold , so it could bounce here, but watch it. Tag the 50sma? THAT is where I may try a Dust Trade. Keep in Mind Miners (Especially GDXJ and Juniors) have been holding up better and seem relatively stronger. the trade may not be so great, but also if Gold were to sell off deeply, Miners may bottom at prior lows.
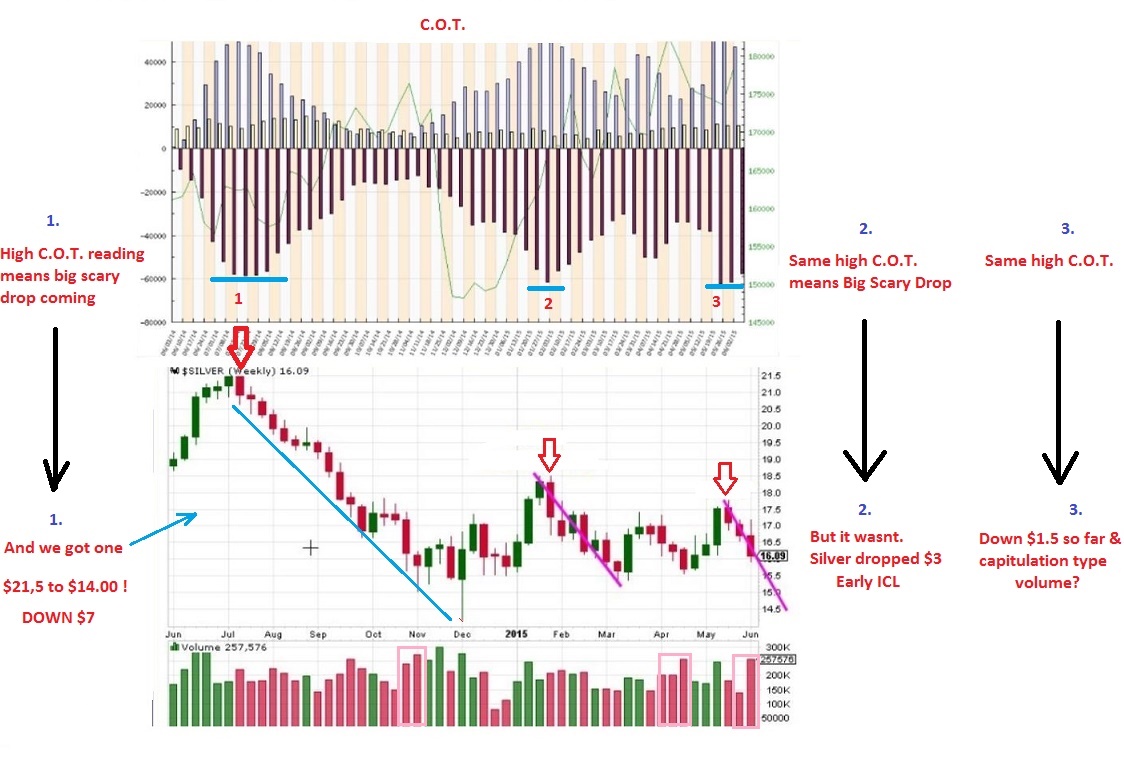
SILVER- I was looking at that SILVER COT. I mentioned how it is as high as it was at prior tops, but this weekend I was studying it a bit more. When it was this high in July of last year, it ended up with Silver plunging down. Many expect that this time, but in my mind, I wanted to know if it a guarantee? Does that Silver C.O.T. mean it has to plunge? I have been watching Silver hold up fairly well and Miners holding up well on days when Gold sells off. I at least wanted to look into possibilities and likelihoods. Here is what I found that I think is at least interesting or note worthy.
YES it could plunge, no it doesn’t have to. I merged the Silver chart with the Silver COT to how you what I found. Please look at 1,2,3 .
1. July 2014 we saw the same Silver C.O.T. Reading and Silver dropped BIG – Down $7
2. Jan 2015 we saw the same Silver C.O.T Reading and Silver only dropped $3 and put in an early ICL
3. May 19 we had the same Silver C.O.T. and silver has dropped $1.5 so far. Most keep pointing to the COT ofr silver as the reason they expect a huge plunge. This view helps me to be satisfied knowing that – Silver Could drop fast, doesn’t have to.
Finally, I am doing additional research in the GOLD / SILVER market and thought that I would have it finished by this weekend. I’m not quite there yet. I want to get this out Sunday night and I will continue searching other areas that I have begun to look at, and report findings later.
So I expect a possible bounce here in Precious Metals, but am a tad leery since the last bounce ( scroll back up & see reference chart #16 ) had that run higher and then dropped into the real DCL , which was a stop run. That was a very devious market shake out . I am wanting to play Energy long and just see how the Precious Metals markets react going forward. There may be a better short position or Much better long position coming up at the next ICL. Last weekend I said that I thought that the week would reveal more , yet again we only went sideways in the SPX, DJIA, and NAZ. Maybe this week we can see a break out or break down that clarifies things better.
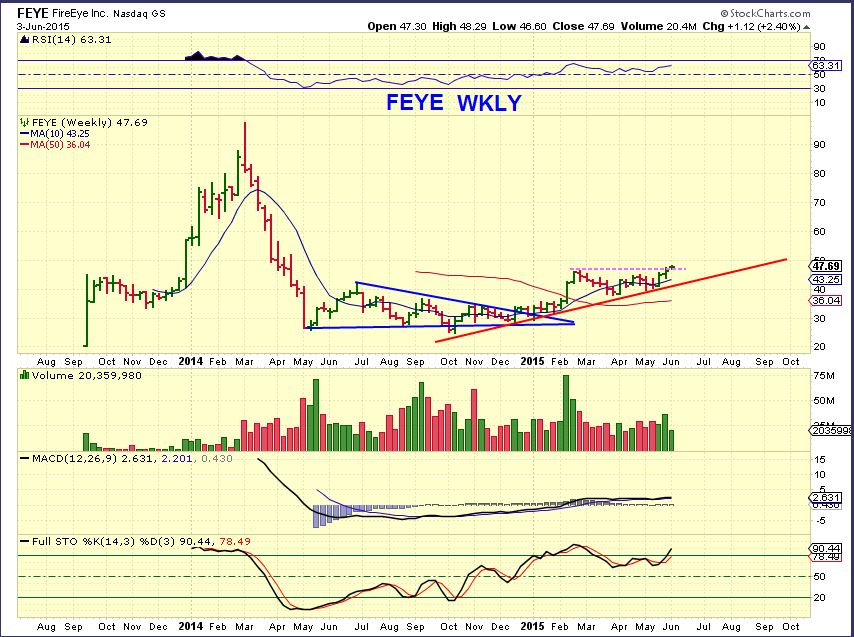
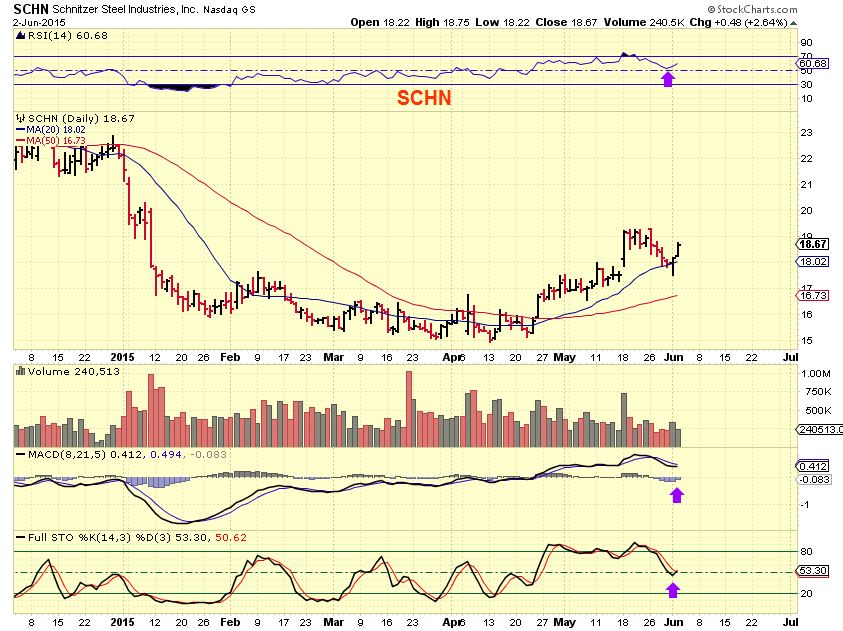
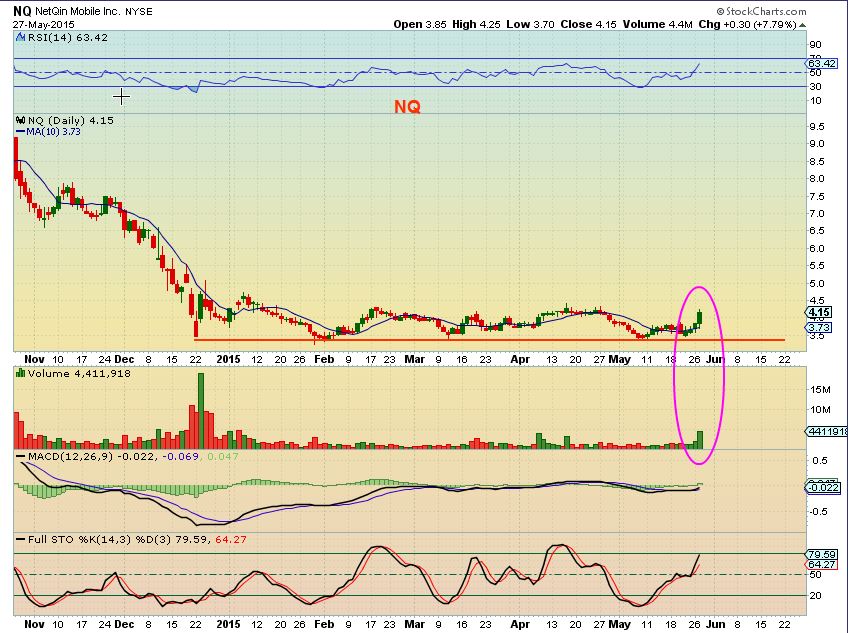
There have been some exceptional moves for Active Traders in charts ( See Some that I have been pointing out like CMCM setting up again, NQ broke out, FEYE Broke & ran, etc etc ). There are more. I will add a list at the bottom of this report for active traders, some that I mentioned with charts last weekend & mid week still look good. I hope to see the market choose a direction to gain confidence in longer term plays too. Thanks for being here, I hope this report helps you to see what is happening in various sectors better.
~ALEX
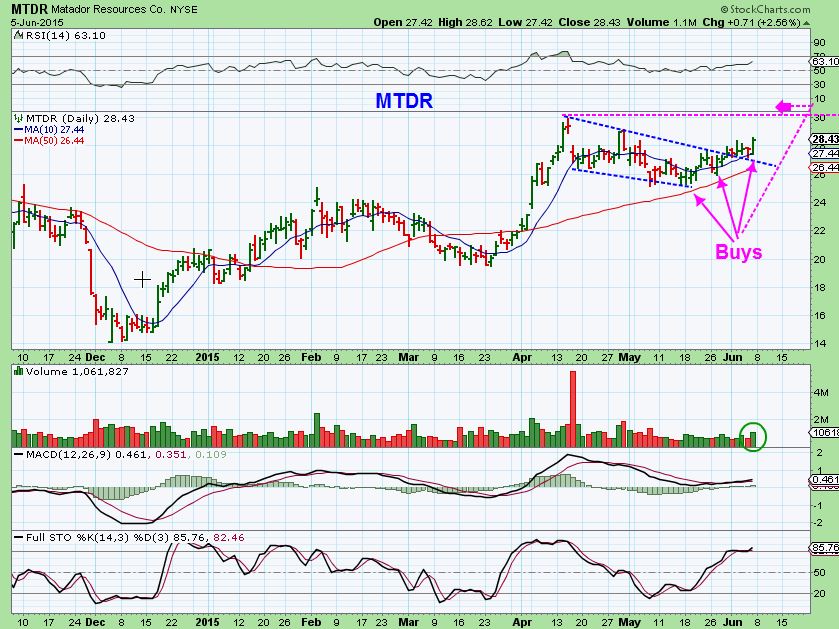
MTDR- Quite a bullish chart . Buy now, buy tags of 50sma , and break to new highs.
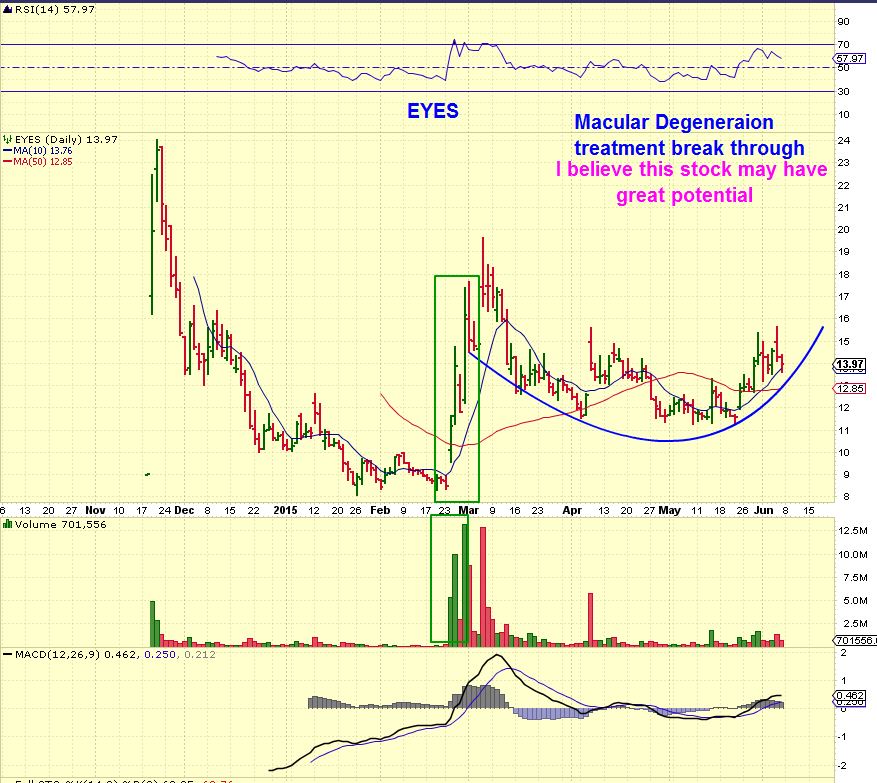
EYES-
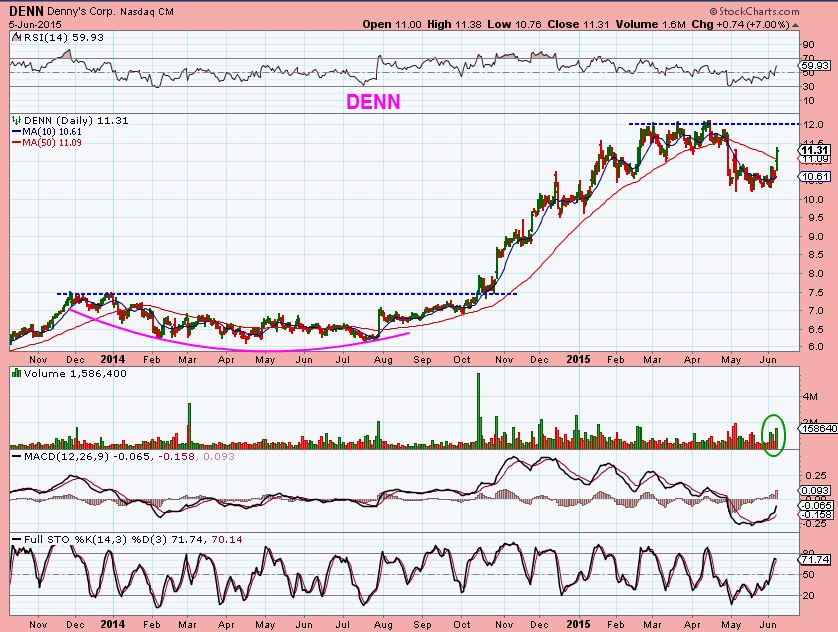
Check put FOOD charts GTIM, CALM, ZOES, and here is DENN
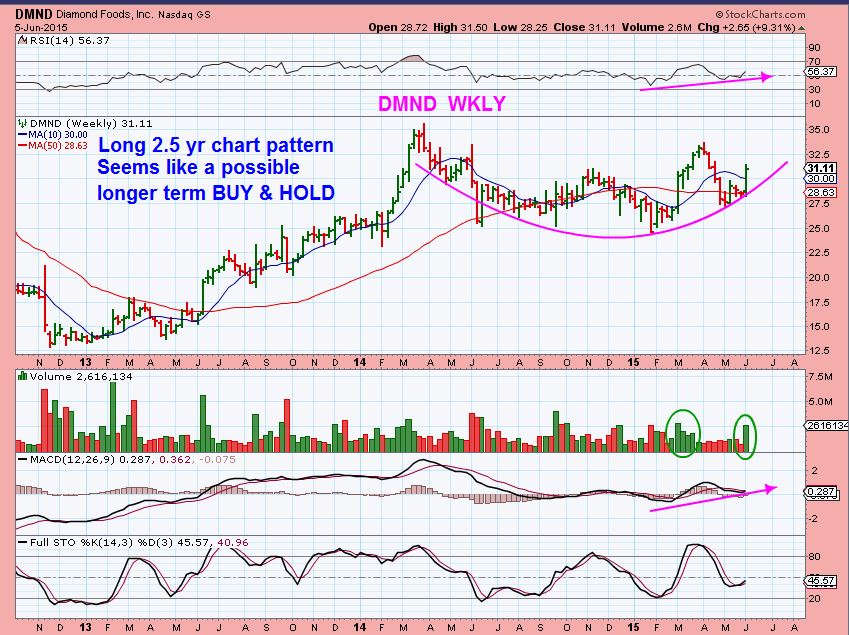
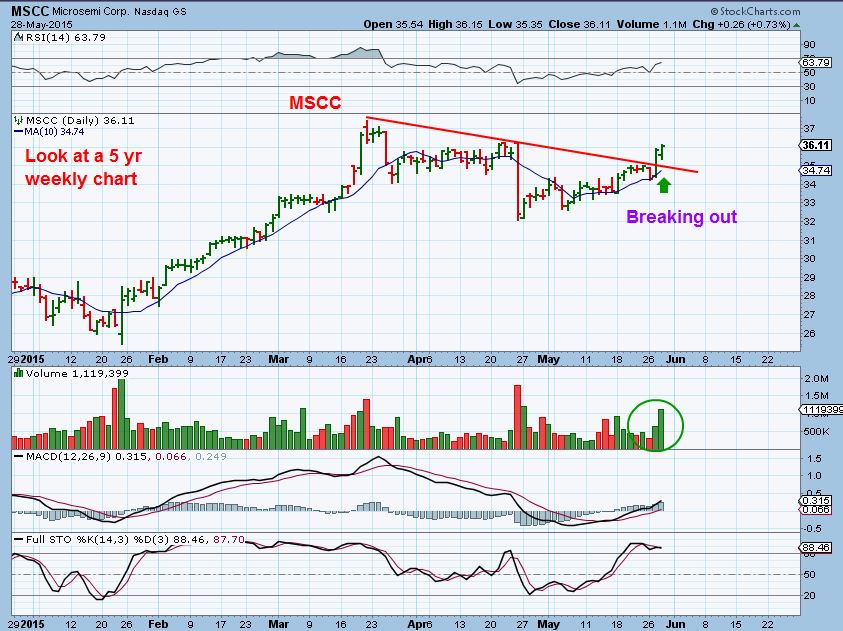
DMND – Possible long term BUY & HOLD. See a 5 yr wkly to understand why.
I was just going to post a list of set ups, but I will re-post my older chart too. Please look them up now and you can see how they are playing out. Some are still buys, but as for extended ones? Look for a pullback.
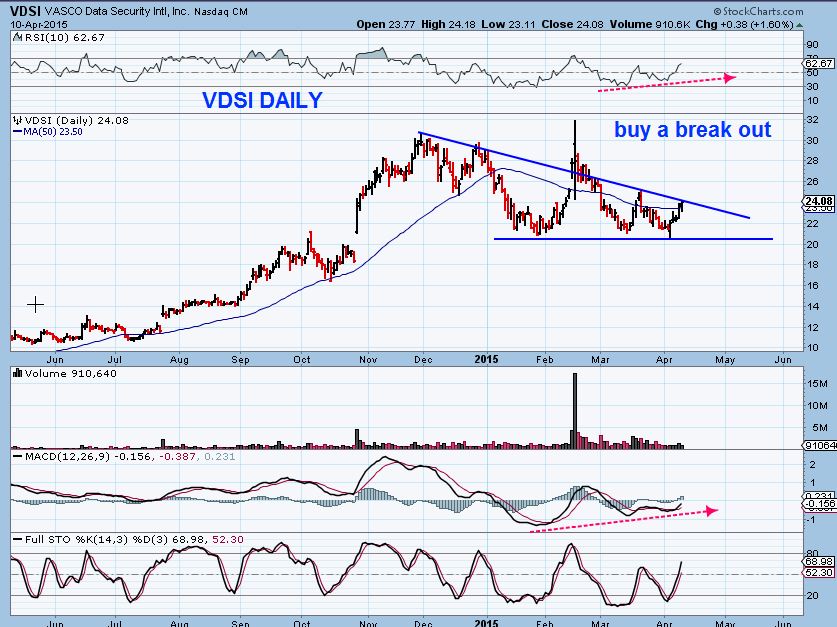
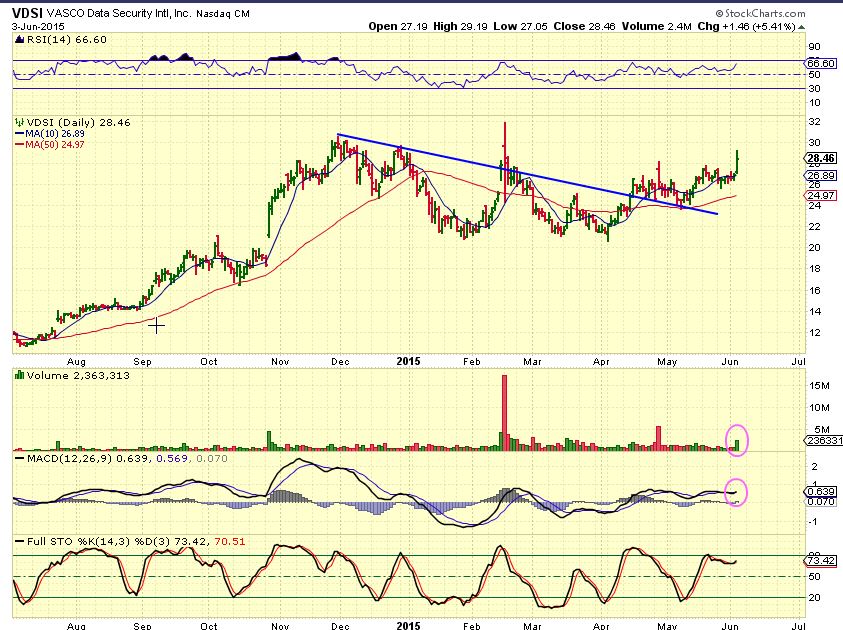
Security doing well , Look at CYBR, HACK, FEYE , VDSI , etc
Watching FIVE ( for a pullback entry) ,JD- Buy now, YRCW, UTIW, CMGE? ADHD broke out & reversed back down. If it moves higher, its a buy
Some of my past chart set ups rocketed higher, others broke down . PLEASE USE STOPS ( In low risk entries , like right above a trend line or 50sma, I prefer somewhat loose or mental stops) . Best wishes / Happy trading.
Tricky Times 
 Interesting Developments
Scroll to top
Soros on reflexivity. Or oil currently? Euro?
… sounds an awful lot like the Elliott Wave Cycle & Wave Sequence…..;)
🙂
How did I forget to put THIS chart in the report? You want to see XLE resist selling if OIL remains down today (refresh for chart)
Add to my list of “FOOD” or “Restaurant stocks”….ANFI & CAKE , but they can be low daily volume at times.
I ALSO FORGOT TO MENTION SOLARS in the weekend report. If you look at JKS, that looks like a good break out from a consolidation. Then see TSL, CSUN, CSIQ, SOL , YGE , HQCL- they all reacted too. In the past, we have traded them and they have failed to have follow through , but one day they will after this long consolidation.
Look at 3 or 4 yr wkly charts of CSUN, JKS, TSL, etc
I like ANFI, I’ll wait to see if it gets past $11.49 at this point.
I like it too , but I get leery with volume under 300,000 / day. Sometmes it increases as it gains price, so I am watching for that (was watching CGA that way too)
GOLD completed its 2nd AB=CD down pattern, what next, bounce maybe. AUY in a huge basing pattern.,
URRE getting ready to break out?
Miners GDX to $18? Chart below seems to indicate it. NUGT at $7.74 wow=opportunity
ALEX, great call on NQ! You buying here? or too extended? Over the 50ma.
No, I dont chase them, I buy the pullbacks for low risk entry. I look for other trades at this point
EX: Mentioned I Bought the pullback/ gap fill in BAA last week and CBAK . Pullback In ZBB could be bought . Bought GDP last week (that is down today) .
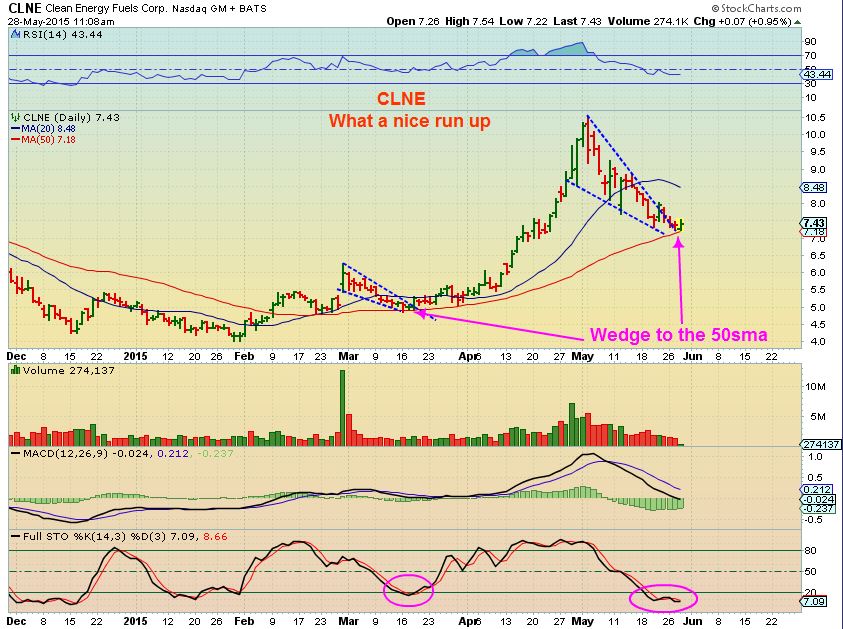
CLNE is starting to look really good on that 50sma. etc
GDP down big Today. I bought it last week and got stopped out. Might be headed for a retest of $2.35 or it may bounce here off the last low $2.55. I’m watching it. I own CLNE, WRES, RIG, and UGAZ currently
I still own it, 2 huge volume up days, todays drop is 1/2 the volume . I’ll have to see if lows hold as support or we break thru (tomorrow?)
EJ- That break out looks very real in many ways. I think it is a buy , but look at APRIL and see how it can trade at times. Sharp POP and then consolidate, but one of these times it’ll probably just take off
$TRAN Rejection of that backtest and the 20 DMA. Just ugly.
Yes, I was watching airline stocks, since they did what TRAN did pretty much. I wanted to see if they recover…
Look at UAL, DAL, SAVE, etc
Just got stopped out on GDP on run barely below 2.60, now turning up. Looks like operators waiting to make stop runs on this relatively thinly traded stock. Beware!
Yeah, my stop is below recent lows, but its a mental stop, so I am watching it.
GDP is a buy here :)))
refresh for My May 29 chart ( longer term). It hadnt quite bottomed yet, but has now.
.
oh I love the long term chart!
Watch the $2.35 area
May retest $2.55 today.
At $2.35, it will be a great buy. Will it get there?
Is KITE a buy again?
Today may be a break out / trend line along prior highs. Looks good. The Pharma / biotech stocks are definitely running well after break outs.
I bought & sold MNKD ( posted here) and it just wont stop!! Sold way too early.
What do you think of MCP here? I got stopped out last week, still rounding
I do see the long term wkly rounding bottom, but if I look at the daily it’s hard to know what it wants to do short term.
I look on a 6 month chart and the trading range is $.30 to $1.10. Wow, but its a fickle ship. Tough call between…you may get stopped out again or triple your money : )
It’s probably not a chart thing with that stock. The big issue is whether they declare bankruptcy. If they do it’s gone. If they don’t you’ll make money.
Like WLT
Barron’s had an article indicating bankruptcy for coal stocks at this point might be a smart move. WLT down 33% today.
Yep, I agree. Thus my “lottery ticket” position.
Did I mention that that break in EJ looked real this morning as it broke above the 50sma with very strong volume. 🙂 wow, looks even more real now.
Looks good. Where would you set the stop? Not low risk.
Personally I’d try to scalp a run up & just get out if I get uncomfortable. This looks like it could be a break away type move, because at 1/2 day it has HUGE volume. It has popped and sold off a few times in the past , though, so it is a riskier trade to just try to jump in and scalp some gains.
Alex,
As you stated, XLE had an engulfing candle last friday but no follow thru today, does this negate that candle in any way ?
XLE struck & stopped at the 10sma. The engulfing candle wouldnt be considered negated by me until the lows of Friday are broken.
Today could pause and then a break higher tomorrow is still possible (And really, XLE is very oversold. I think its likely too).
Gotcha. Thank you !
Starting to accumulate FCG (via GASL).
They must have split GASL? I looked it up thinking that it must be around $2.80 or so.
EDIT: refresh, I found this in my Feb chart folder
split indeed.
PS: the 3x split curse happened too. Like any 3x etf spiting, they fall afterward….
… this is from my ‘May’ folder… I have it in Wave III up — guess it surpassed my “1” target… o well… will be a GREAT buy on “2” pullback ;o) https://www.tradingview.com/x/HLAolvsy/
Wise guy
LOL
Looks ready, good call
Some Good Moves in UGAZ finally..
PPP ( junior Gold) looks like it wants to break out on the next Gold bounce. ( IAG, BAA, also moving up today
GG GFI at double bottoms
Alex, Any thoughts on UA? I know you had mentioned it a while back but haven’t read about it in your posts recently. Thx in advance for the great charts and awesome work!
Hi Deshy, I like it if markets remain in an uptrend.
I don’t mention it anymore because some had asked me for a long term BUY & HOLD. Just a good company that in a bull mkt could be bought in a retirement acct and forgotten about.
UA was really my favorite and I even mentioned it a year ago when the website was running last summer.. I also mentioned NKE, MCD, you could think TSLA, etc
I dont love BUY & HOLD if the mkts are getting toppy, but that is when you cash in your retirement acct and go to cash.
Alex,
sure like the looks of NGas making a bounce here….will most likely go long on the next pull back….an algorithm that I pay for with predictive models is showing one small dip after this bounce…dip could be higher or lower but showing lower at this point…then up for a couple of weeks…..things can change like any other fluid market. Your charting techniques are key to reading the other charts. Thank you.
NATGAS fell to the trendline that I had been pointing out and seems to be at the reversal. I had also mentioned that my experience with NATGAS was a couple of days at the lows and then a surge. We saw that too…I’ll put it in the report.
hmmm.. might we see thissss long legged lovely tomoro oh wise one? https://www.tradingview.com/x/FxoiAn5d/
Not too many places to hide today. Natty has the lone bright spot. Oil picked up speed to the downside, NAZ down pretty significantly, bonds didn’t get much traction, $$ got clobbered and if you count -1% in dollar index gold’s +.5% looks pretty meager. Actual spot VIX rose a bit but VIX based products barely moves. I can’t imagine that they can all continue in tandem all week. If markets sell off, imagine some money has to go somewhere, likely gold, bonds, maybe dollar. Market is at least pulling back orderly which likely reason ‘risk-off’ asset trade not seeing much of a move.