
A Mixed Bag
Short term movements in the markets are Mixed, so lets take a look at the charts and see what we can observe.
.
SPX – In the short term I see small bearish wedges that could lead to a pullback or sideways move short term. If this were to just surge higher and break out to new highs, that would be bullish.
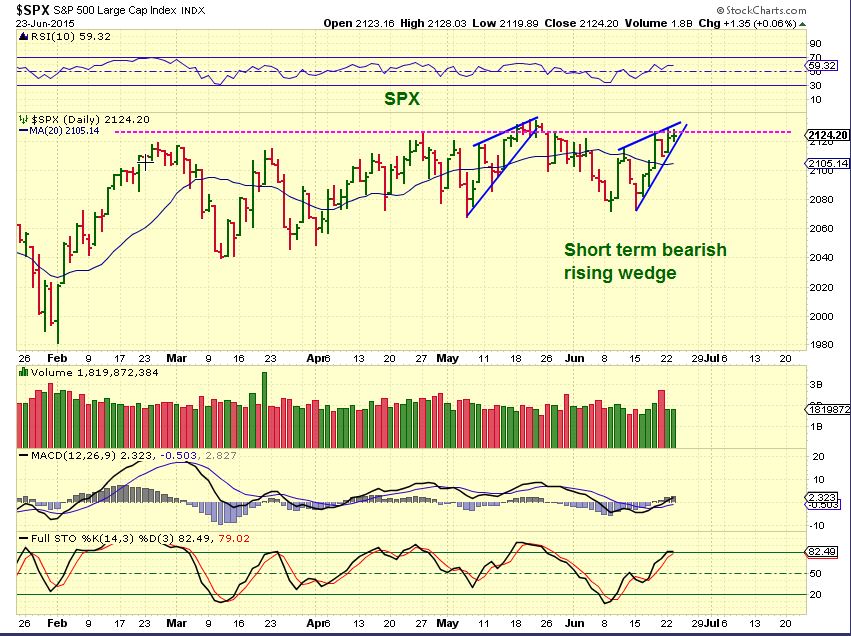
Interestingly, The RUT, IWM, and IWC did break to new highs recently and continued higher. Are they leading ?
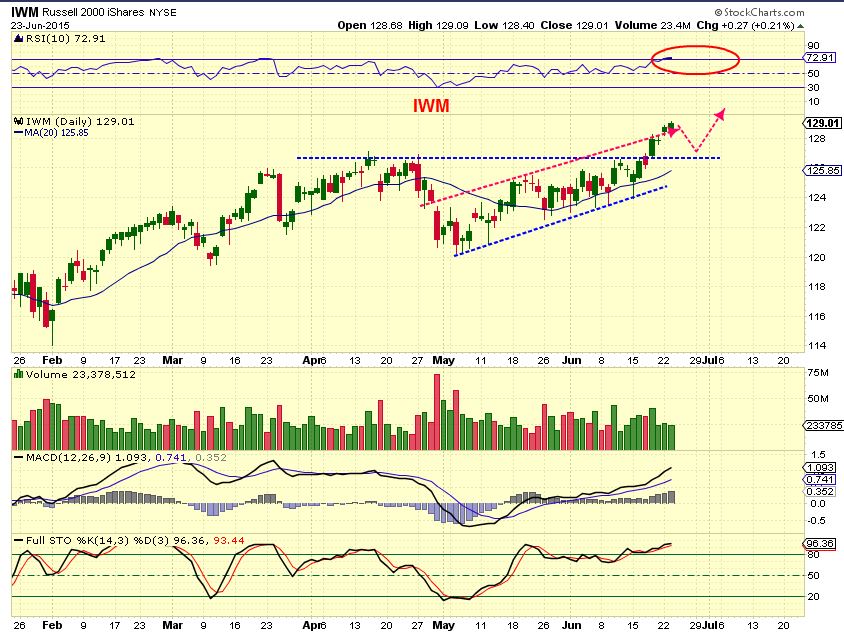
IWM – It also could pull back & back test the break out, but it remains bullish above the break out.
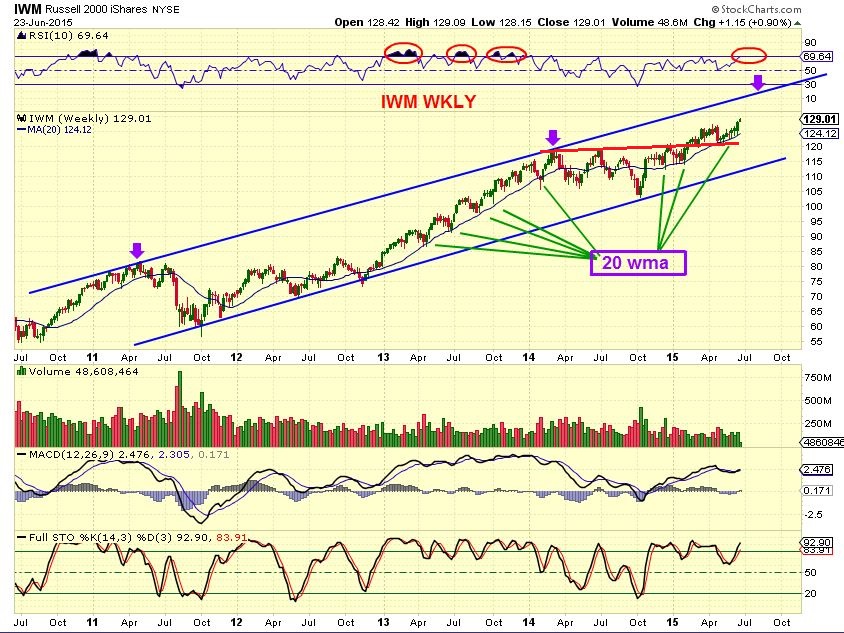
IWM WKLY– Big Picture: Break out & back test complete. That 1 yr+ consolidation actually gives this plenty of room to move higher over time. IWM, RUT, etc went sideways for a year while the DJIA & SPX went higher. Maybe they consolidate for a bit while the small caps do their own run upward?
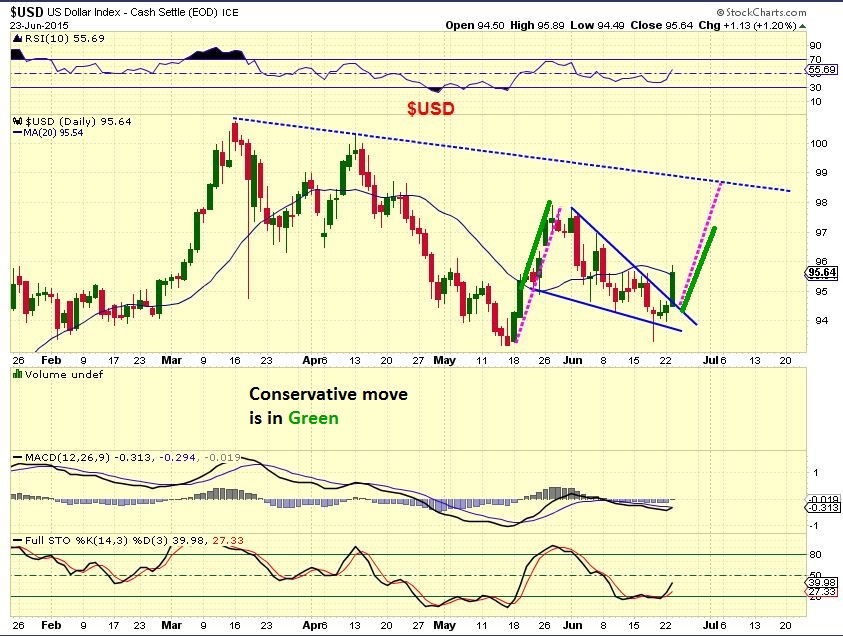
USD – this was looking bullish Monday
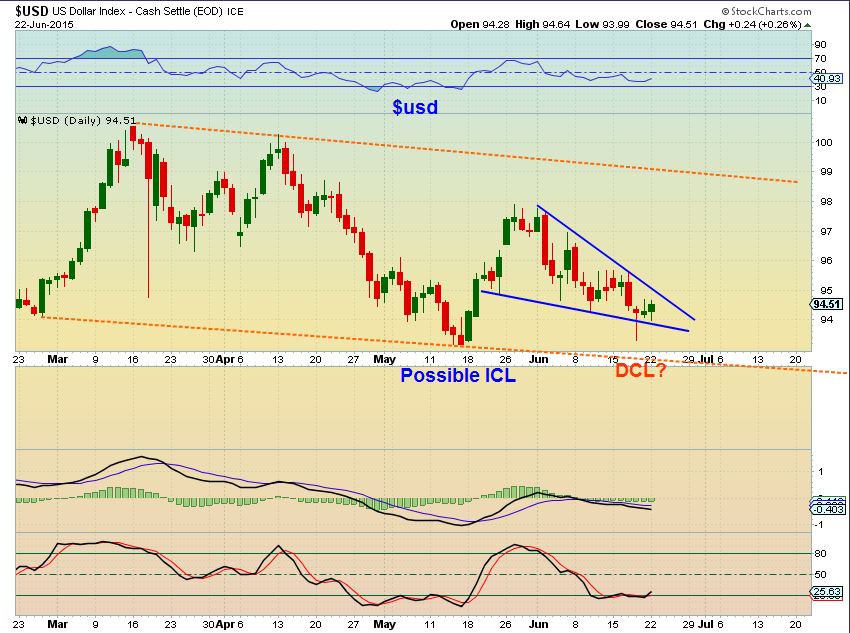
USD– That was a bullish break out Tuesday, up 1.13. I expect higher prices in time.
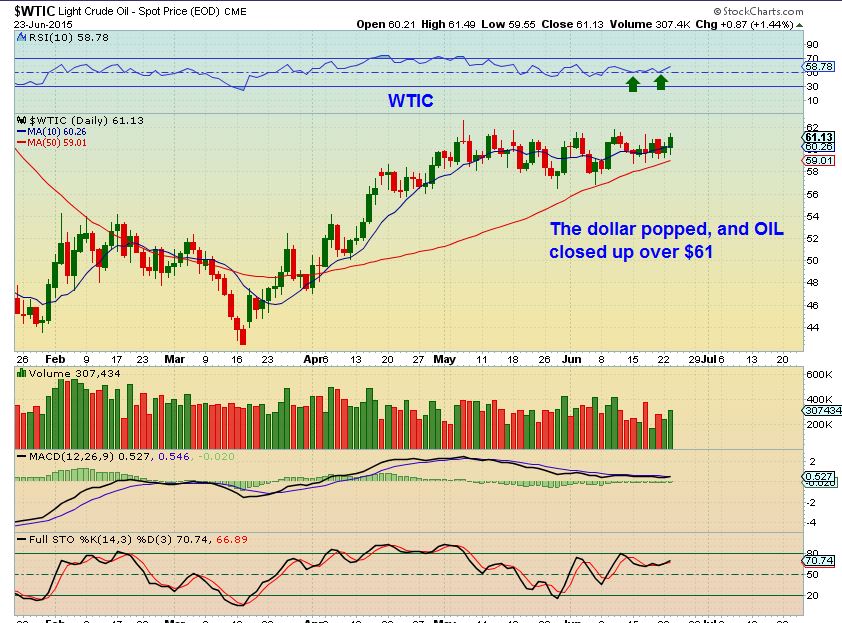
WTIC – Last week I got an email where someone was concerned that another newsletter writer claims that OIL cannot go higher with the dollar. Yesterday Oil moved higher with the dollar. It looks like it is trying to break out from this consolidation, but another day or two is needed to get confirmation.
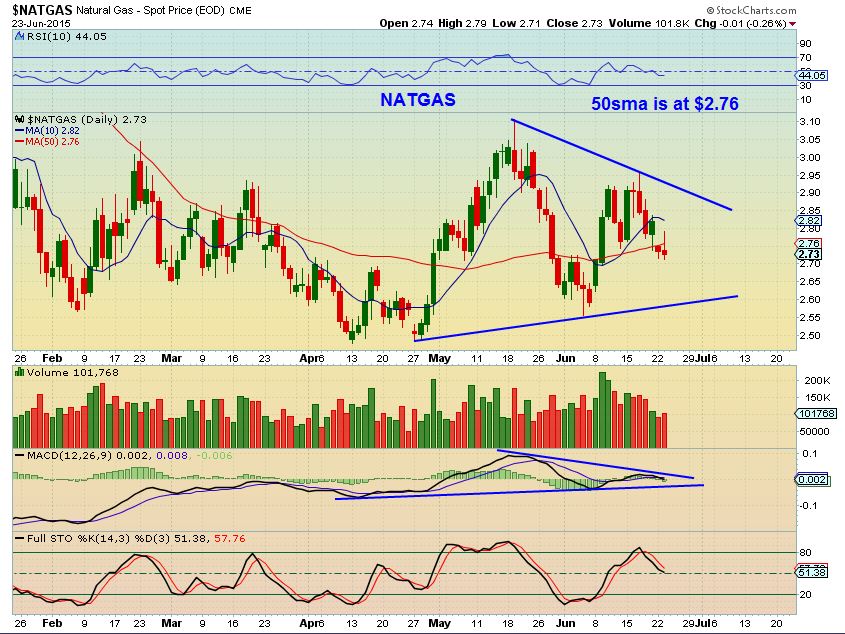
$NATGAS – I want to see NATGAS over $2.76
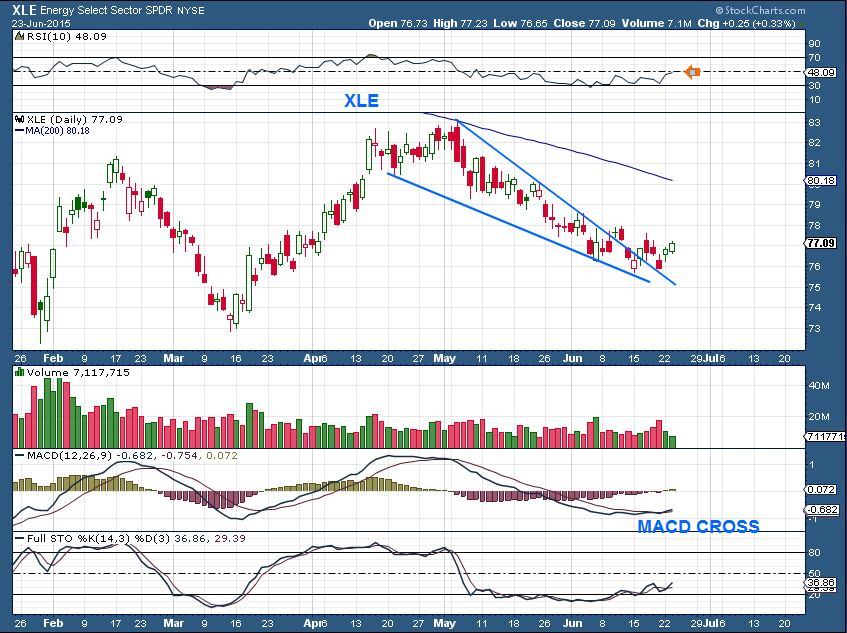
XLE– Looks to be slowly improving as the MACD crosses higher and the RSI is moving towards >50% . Volume was light and this still has a little work to do I.M.H.O.
GOLD, SILVER, and MINERS
This gets short term tricky. I said that I am not shorting this yet, because even though I expect a sell off and we have had a small one, the intensity of the selling is mixed when it comes to Silver & Miners. If the picture isnt somewhat clear, I cant recommend that trade. Lately Precious Metals have been selling off and then bouncing, causing more of a sideways grind than a good trending trade. lets take a look.
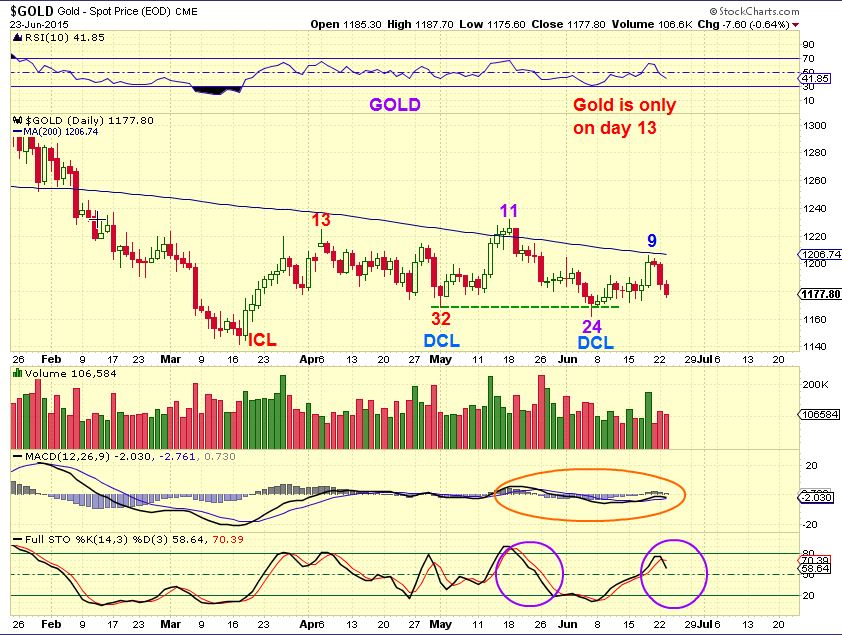
GOLD – On day 9, reversing at the 200sma, I did say that I thought that would be the top of this daily cycle. Looking at the month of APRIL however, sideways chop from day 13 made shorting it difficult. We MIGHT just grind sideways again , but I do expect us to drop down below that day 24 DCL in time. Gold is not a long position.
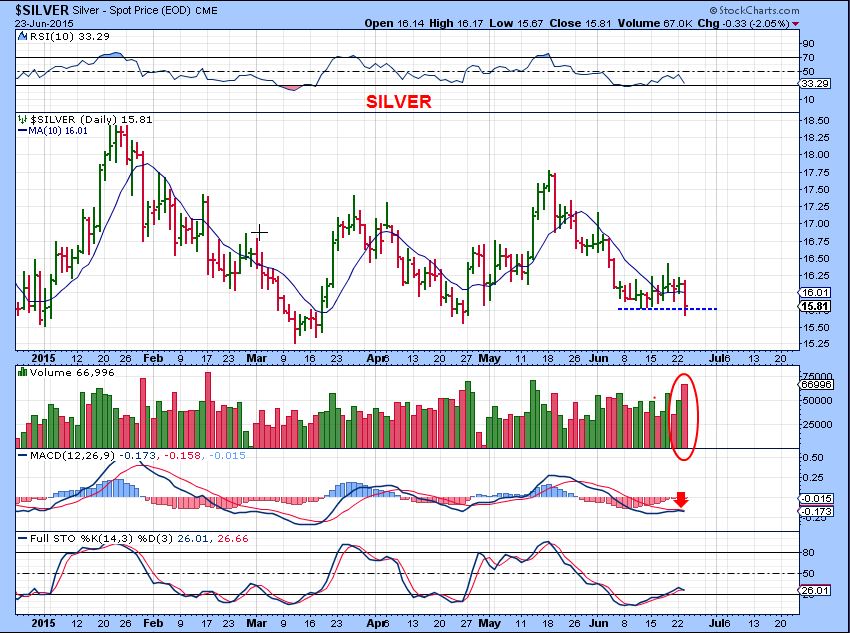
SILVER – Silver was not joining in on the selling with Gold for the past 2 weeks. It finally dropped yesterday . Volume was big, but then it recovered as though it delivered a shake out. Shorting that move may not work. I remain on the sidelines.
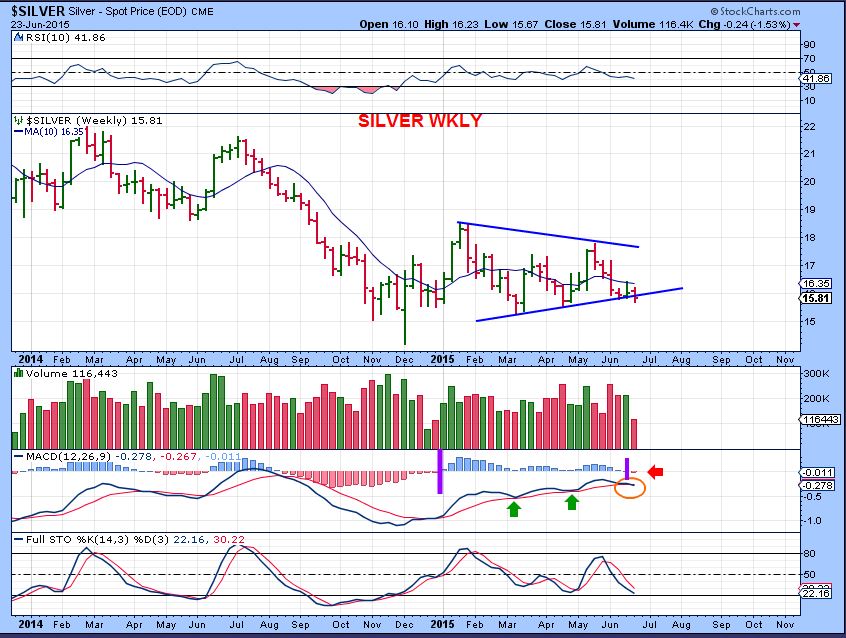
SILVERS WEEKLY CHART does look bearish. I am not going long if we get a bounce here.
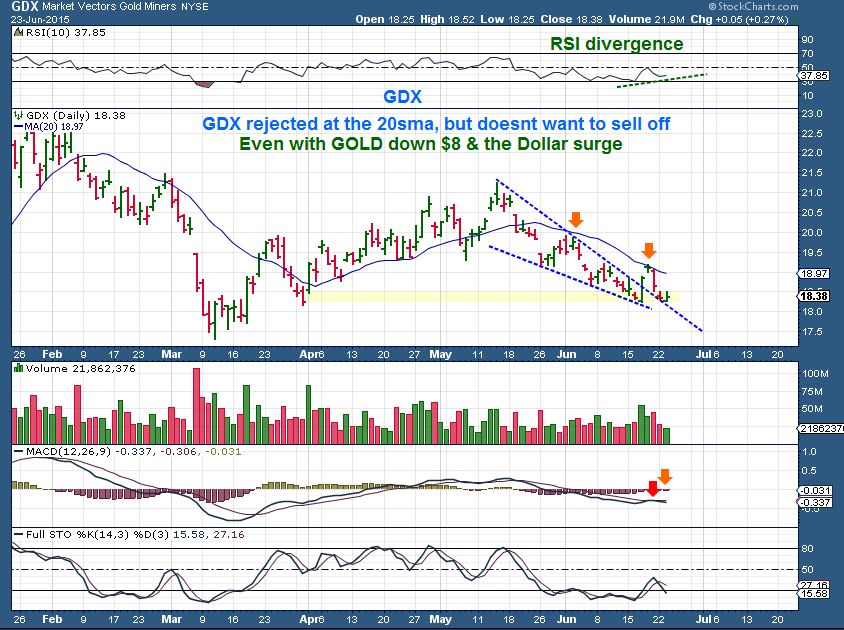
GDX – Miners have held up well. With Gold dropping $30 in the past 3 days, Gdx has dropped less than $1. GDX Broke out from a descending wedge, was rejected at the 20sma, and back tested the break out. That is usually bullish, but I am not expecting more than a bounce with Cycles showing that we are in a 3rd daily cycle. I am on the sidelines.
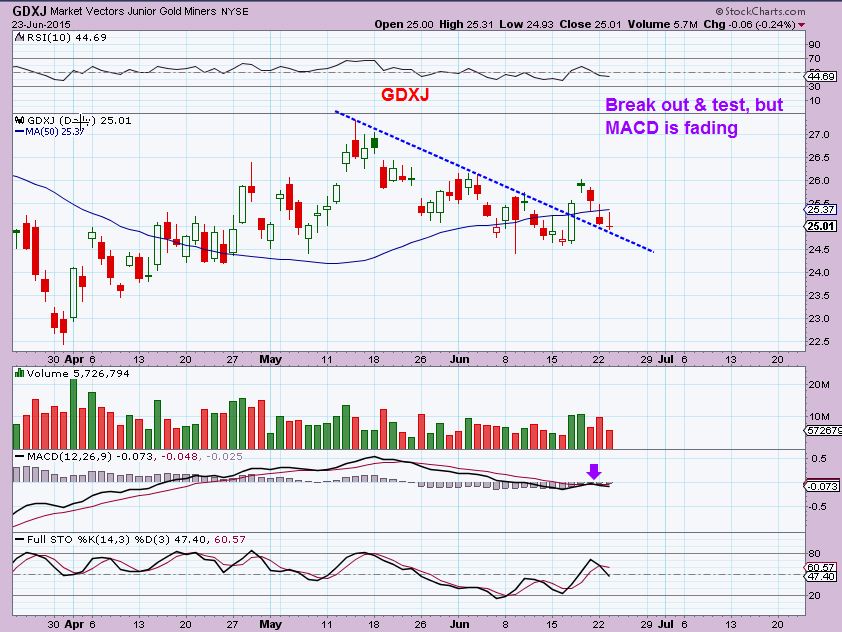
GDXJ – Juniors have really defied Golds selling. This set up is considered Bullish, but again I am watching how this plays out rather than trade it. This chart shows that GDXJ has been moving sideways for weeks. If you bought GDXJ in April & held, you’d be basically break even 2 months later. A better buying opportunity is likely coming.
So basically it is still a traders market . There have been plenty of nice chart set ups ( especially in Pharma, Biotech, and Tech) that have been breaking out and running higher for nice trades if you are in front of your computer. Oil is starting to look more bullish again, as it attempts to break free from this long consolidation. Energy stocks may benefit and we saw some signs of life in HK, KEG, REXX, WRES, etc yesterday. Traders are trading energy again, but those who need to ‘buy & hold’ for days or weeks because they are not in front of a screen to babysit positions really want to see a break out higher in OIL for safety. GOLD & SILVER are in an area that I dont think is trade-able at this point. I do think that a great opportunity is coming, but I will have to watch how the 3rd daily cycle sells off into the next dcl. In March there were only 3 daily cycles as it sold off into the early ICL. Could that happen again? Or will there be a 4th daily cycle, even a 5th this time? Theres no point in guessing at this time, it’s best to watch how things play out. SO FAR there is a lot of sideways action and a disconnect between Precious Metals activity and Miners.
So I am trying to focus on the Dollar, Metals, OIL & Energy for possible future medium term trades at this time. Energy stocks may be starting to recover now, but at this point they need a little follow through. I’m not adding any new trade set ups this morning. Some of the past set ups mentioned here are still valid, if you wrote up a watch-list or please check the end of the last several reports and see how they are playing out. A pullback today or for the next couple of days may offer a new entry on one that you missed. Thanks for being here and happy trading.


Sounds a bit silly but found your definitive comments e.g. “I’m on the sidelines” helpful. I do make my own decisions but for whatever reason gave me more comfort. Told you it sounded silly. Thx for the report!
Ur welcome. Just to be clear , I actually have a couple of positions ( For Ex: You know about BAA & GSS from teens & 20’s, also SZYM , etc) . On the sidelines in Metal/ miners.
Deshy…. I’m in the same boat. This helps me, and make me stronger.
I almost recommended ADHD yesterday. (Down 15% today)
Sometimes these drug companies can be so Fickle- news will often make or break them
SZYM back above the 50sma
Glad I held on to some!
CEMP backtesting
Is CUBA a buy here? I think its worth a shot. Oversold, on the 60MA. Refresh for chart expected boounce in green.
I saw you post CUBA and I looked at it yesterday . Yesterday it was ok, but didnt look quite right. Today it actually looks like it may break down, but it is a tad oversold. My concern would be breaking below the lower trendline today and just a bounce to “test’ the break down & continue lower.
SO FAR- it is still higher lows and isnt broken in any way.
Many energy stocks are very oversold. NADL quad bottom, PACD double bottom
FWIW………….
The VIX might be generating a SM Sell set up condition by closing Below the bottom boundary of its 2 standard deviation Bollinger Bands yesterday if it closes above that boundary today it will be a Sell Signal. Heads Up !
oh man… feel free to pounce on me but i think gold is gonna head up at least for a short short…. i have it in a 5wave -impulse just finishing a 4 down… heading into 5 up .. https://www.tradingview.com/x/JpIAYh9u/ anyone else see this? :-/
Hi Maria, The way that is drawn, wouldnt that mean that 4 down broke below wave 2 down , and dosnt that negate it?
As you know, I do not think Gold will bounce that high, so I am hoping you will use a trailing stop if you enter a position 🙂
tx…CF. just watchn & tryin 2 learn…mossstly cash right now..still.
Actually, I put that in a question form because I really am not sure if I am looking at it correctly or not. I am not an E.W. expert with all of the ‘rules’ and then the ‘exceptions’ – so I was mentioning that , but also kind of asking if you know whether that is correct or is there an exception.
In one E.W. chart a friend of mine did, I pointed out something tht didnt look right , because he expected an a-b-c , and he told me…” Well, the exception is that it could be an a-b-c-x-a-b-c ”
I learned something new that day 🙂
WEAT breaking out
CORN, SUGAR , and JO also moving higher
Ya know what looks bullish?? DWTI
No kidding. As soon as oil starts to form up it rolls back over. Right in the middle of right range now so no play for me. Would prefer long on confirmed breakout. Buying early is just frustrating so far.
REXX continues to look awesome!
Sure does. Too bad I got stopped out on the downdraft. I’d be back in the green if I still had.
Hey Alex,
Would you be willing to put together a tutorial on “Breakouts” out of wedges, bases and channels?
I for one would be interested in how “you” trade those. Always willing to learn. 🙂
Thanks in advance.
Sorry Ken, Kind of tough to find the extra time right now. Maybe another time.
Basically , let me just say that often I cheat – I often buy while its still in the apex of a wedge/ triangle IF IF IF conditions look very much more bullish. Like Strong volume up/ light selling down, sector is uptrend, MACD has crossed up even though its pulling back, etc etc
Others buy The break out , but have to possible ride a Back test. Others buy the back test, and if there isnt one, they buy a pullback ( at 2 for the possible 1-2-3-4-5). Etc
Now look at the chart of CEMP = Any of those above would not have worked- except the early entry with a stop below the apex.
I understand….no worries.
If you see that type of set up in the future throw that curve that at us. 🙂
I did have CEMP in the back of my mind, in which you read. 🙂
Dear Alex….. when you find time would you look at IDRA?
Are you still satisfied how the chart looks like?
Thanks a lot ALEX…..
any pharma can tank any day but looking at its chart.
I would say there’s good support between $3.25 and $3.55.
50MA at $3.32.
Thanks a lot LeChiffre !!!
What I now see is an inverse H&S, is that right?
Great work done LeChiffre, again THANKS >>>>
I guess you can see a H&S. I try non-subjective analysis with Support and Resistance area. (including breakouts and MA).
You’re so welcome.
Geurt, I agree with this, but it is showing a little more weakness. The MACD is trying to cross down, so I want to see it turn higher soon.
I used the 200sma and 50sma as key areas, I dont want a close below that 50sma. Thats my stop, but it may be too much heat for some, depending on where you got in and position size.
I agree