
Similarities
Not much changed from The weekend report to now, so lets quickly review the mkts and then review a couple of trade set ups…
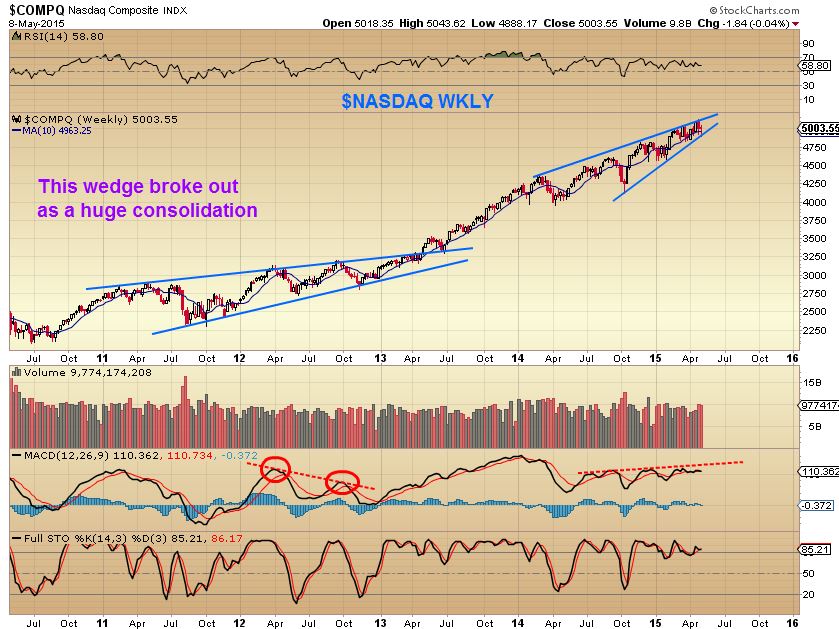
For the NASDAQ- I have been showing a bearish wedge, and I pointed out how they occasionally can consolidate & turn bullish like in this 2011-2013 wedge. I shared this chart
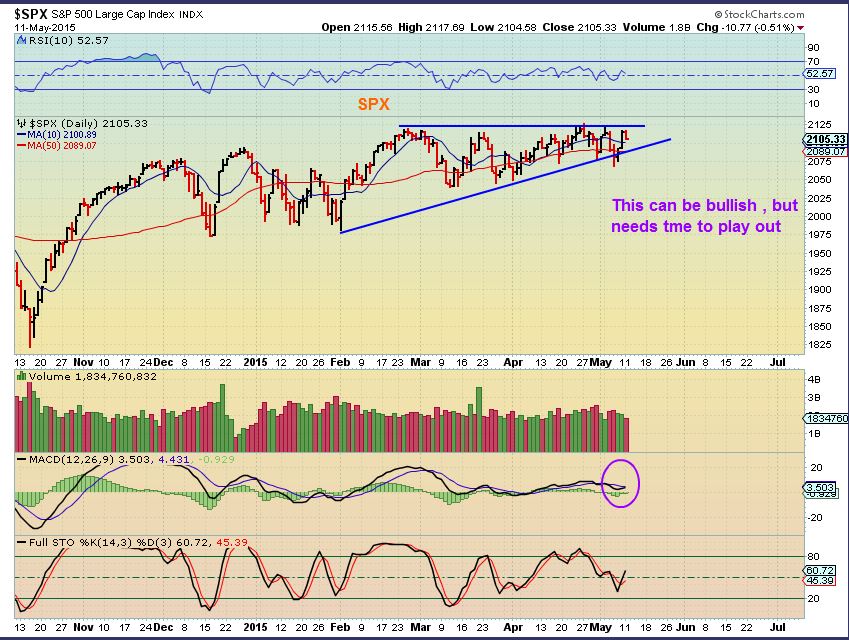
Lets look at the SPX currently
SPX – this formation can be Bullish if we break topside.
The NASDAQ chart didnt change much, the IBB re-gained the 50sma, but all are still in the middle of their trading ranges. They look similar to the weekend report.
.
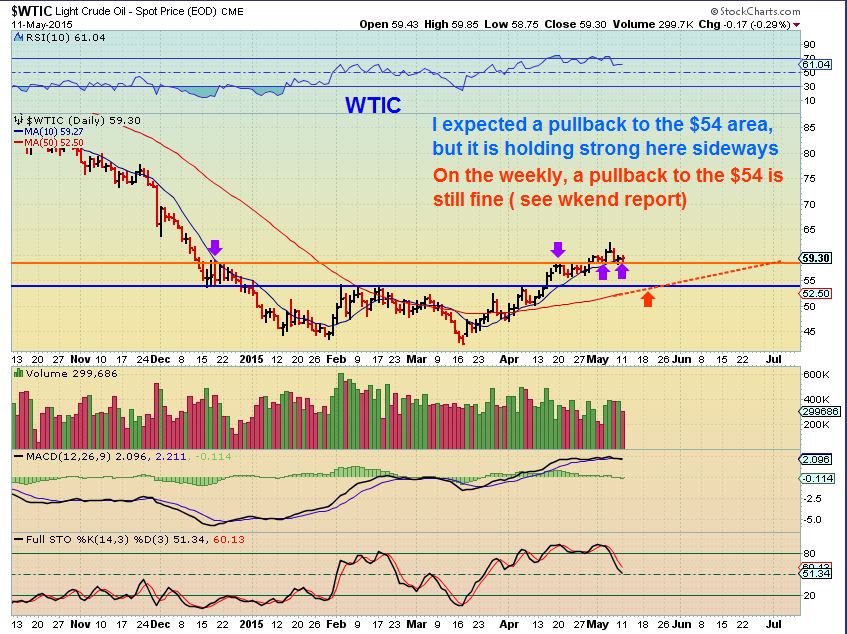
OIL – Holding strong , a pullback is not a bad thing. See wkend report WKLY chart.
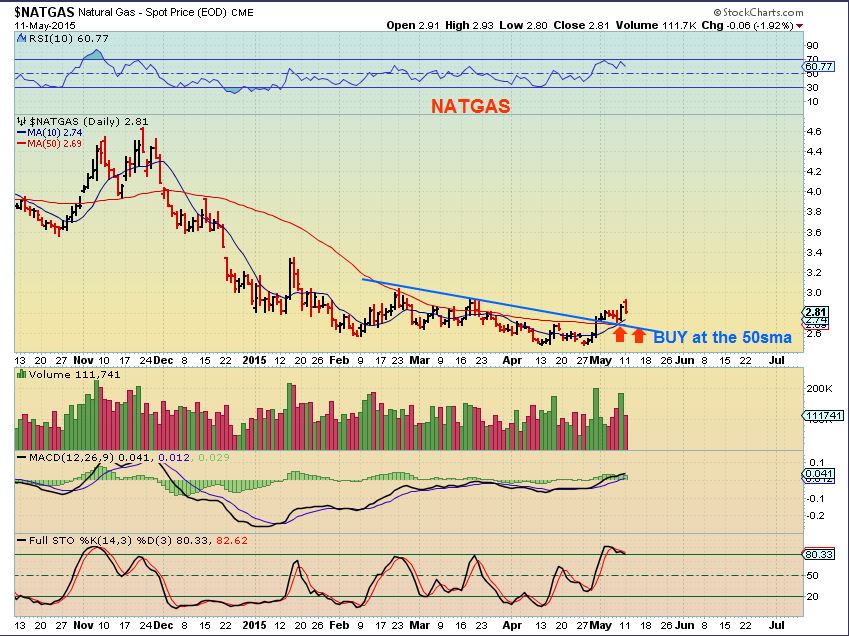
NATGAS pullbacks are buying opportunities in my opinion
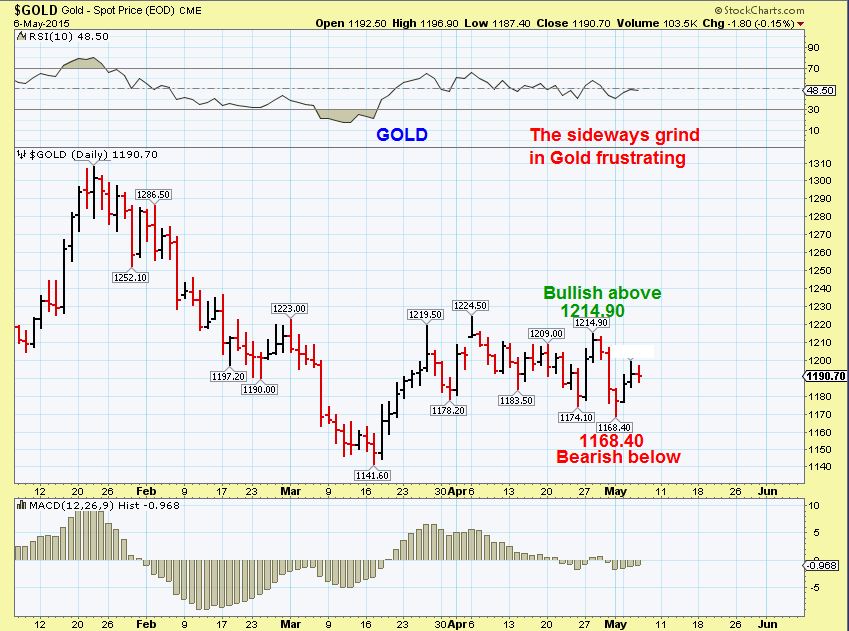
GOLD & SILVER charts continue to just grind sideways. No change. I will re-post this GOLD chart. When GOLD pops or drops I’m just looking at its price within this range. Above $1214.90 or below $1168.40 tells me something.
GDX – I want to see GDX move higher soon. It remains above the 50sma, but Volume was too light for an up day that makes me happy.
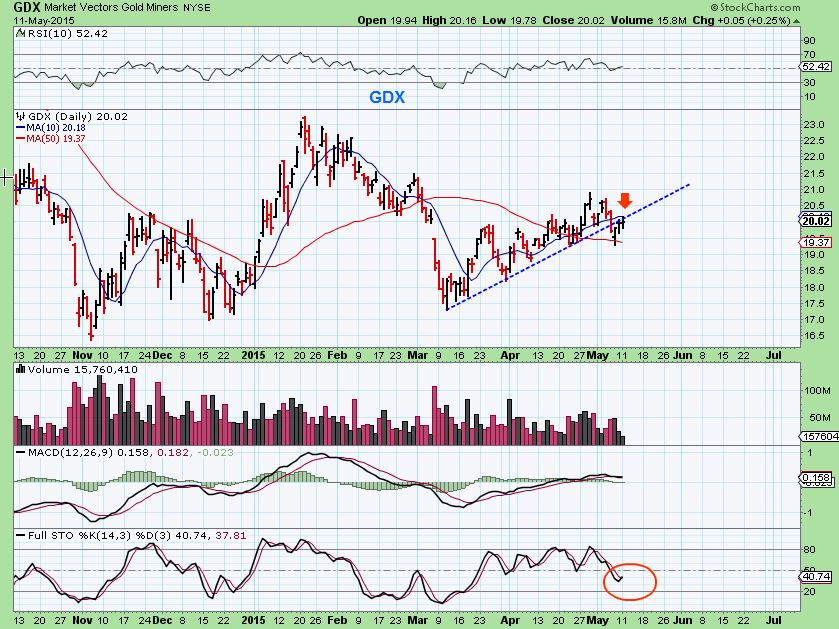
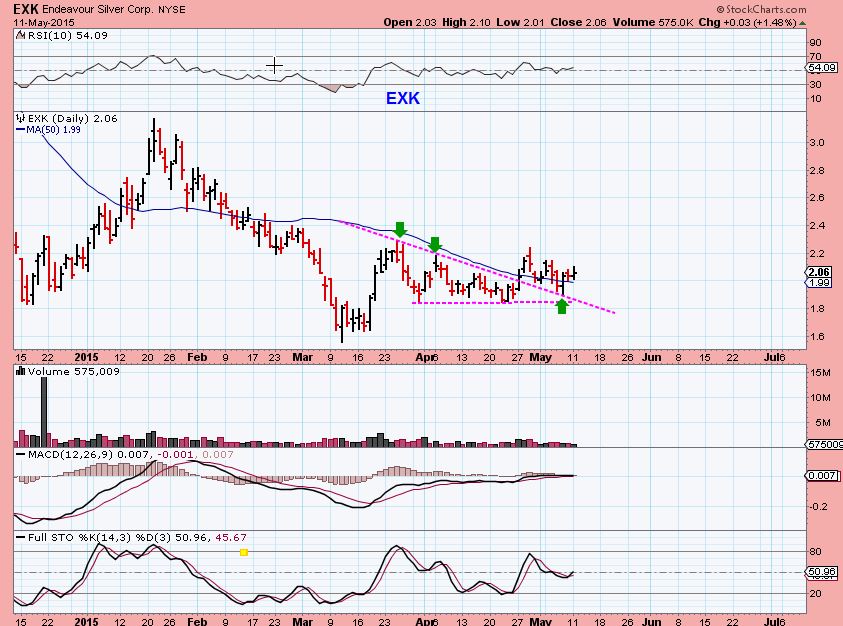
Though GDX is rather neutral , but in an uptrend, some individual Miners still look bullish (TRQ, LSG, GSS, EGI, RIC, ETC).
This is EXK for example
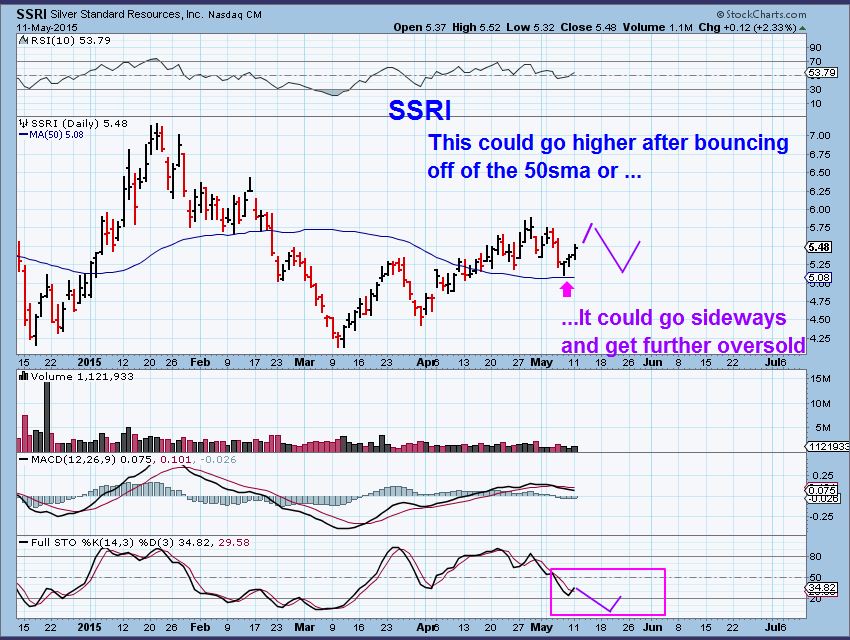
And SSRI –
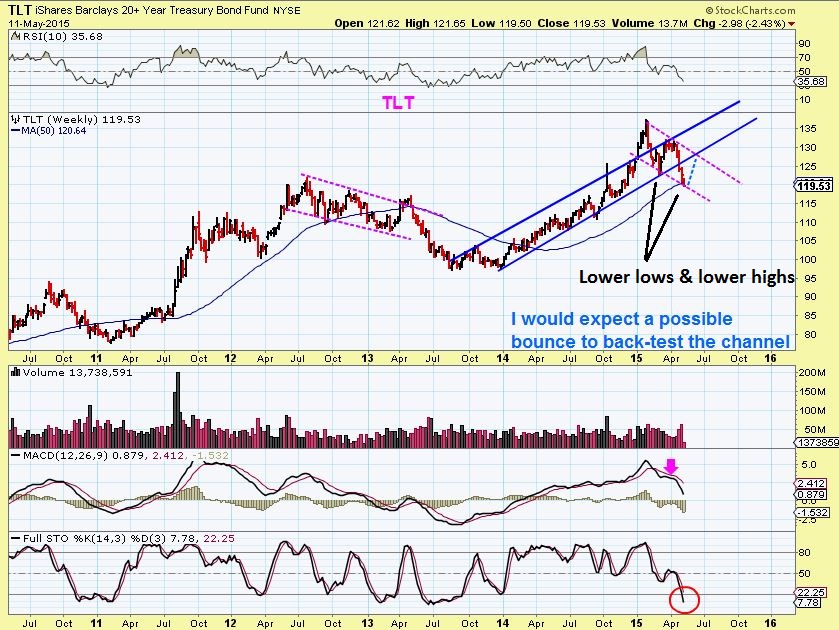
TLT– The USD and TLT could be putting in tops. The TLT already as made lower highs and lower lows. Could this signal the start of an inflationary beginnings and an end to the deflationary trades? I’m going to email my aunty Janet Yellen and I’ll get back to you 🙂
So the markets didnt change enough from the weekend report for me to write anything significant. I will just post a number of trade set ups. You also can review the weekend report or last weeks reports to see how some of the other trades are doing. I will start with
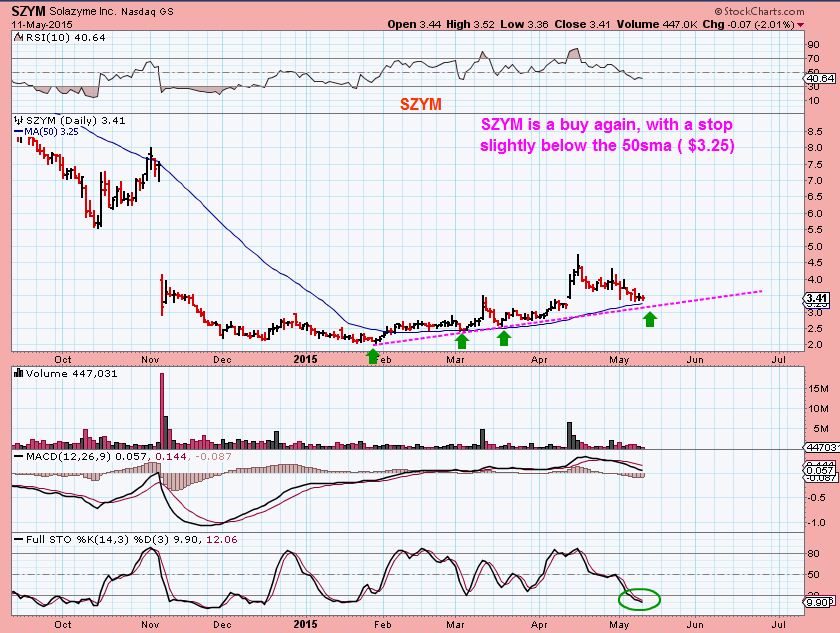
SZYM– this is setting up as a BUY in my opinion. VERY light volume down day Monday.
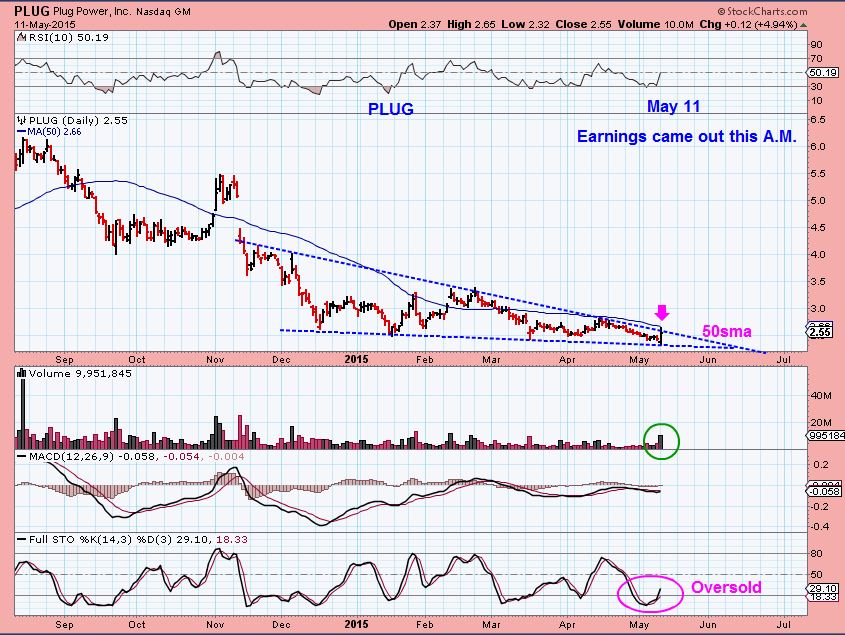
I bought PLUG Monday . It looks like a bullish engulfing on the daily, and this is a longer term chart. It could be a buy again above the 50sma
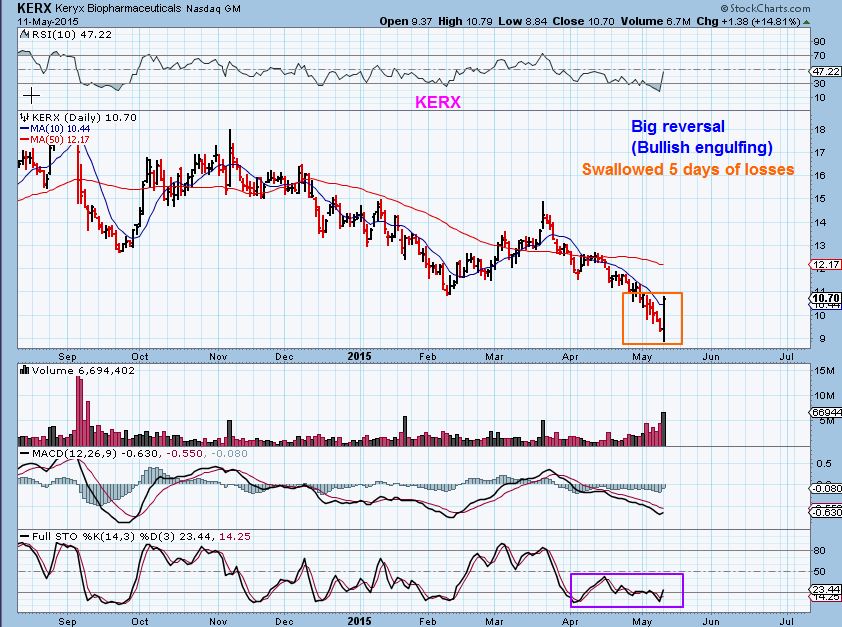
KERX – also a bullish engulfing like PLUG
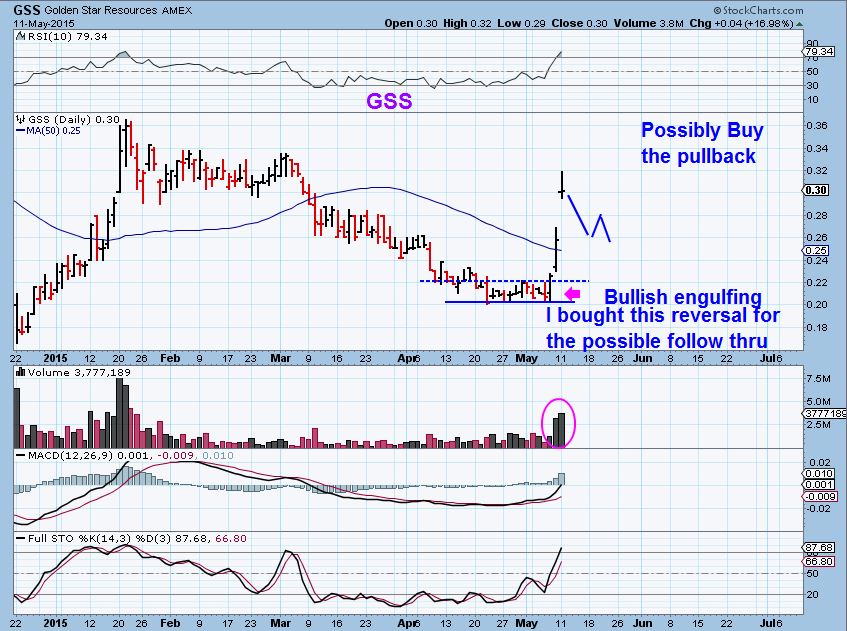
I mentioned that I bought GSS, it was for a similar reason. This is an example of the follow through.
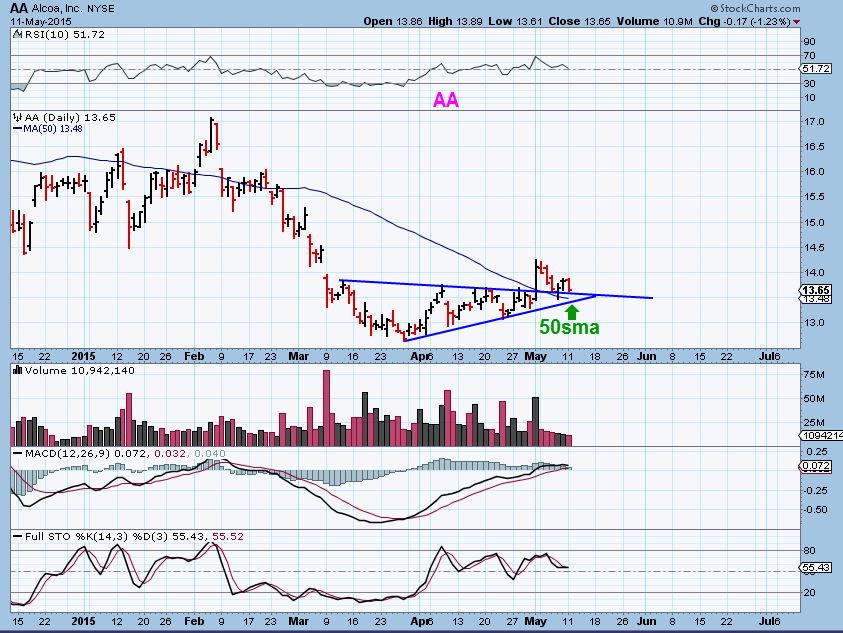
I discussed CENX & AA in the weekend report. I like both of those set ups as LONG, and here is
AA
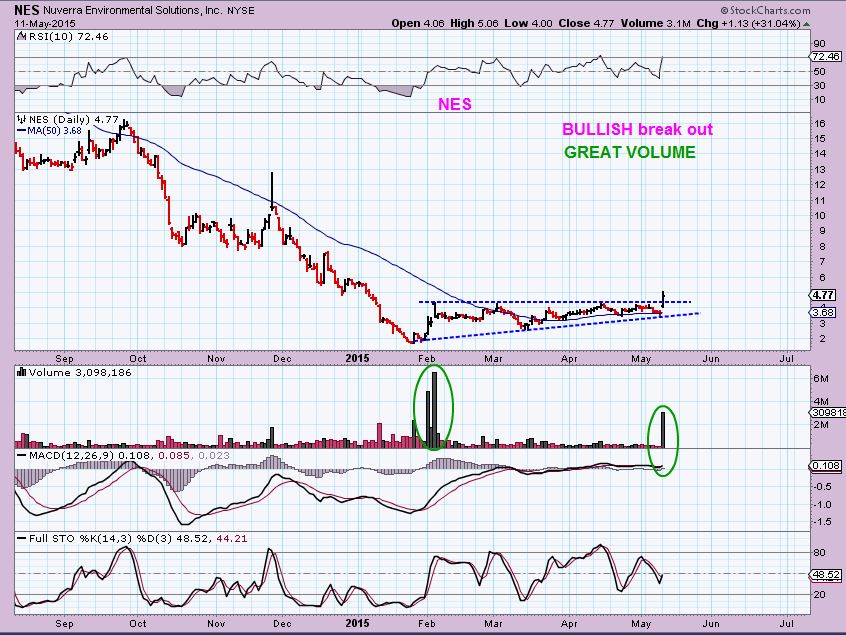
NES – broke out of a base consolidation. It can be bought here , since it may just run higher, but also you can watch to see if it “tests” the break out / blue dotted line and buy that back test.
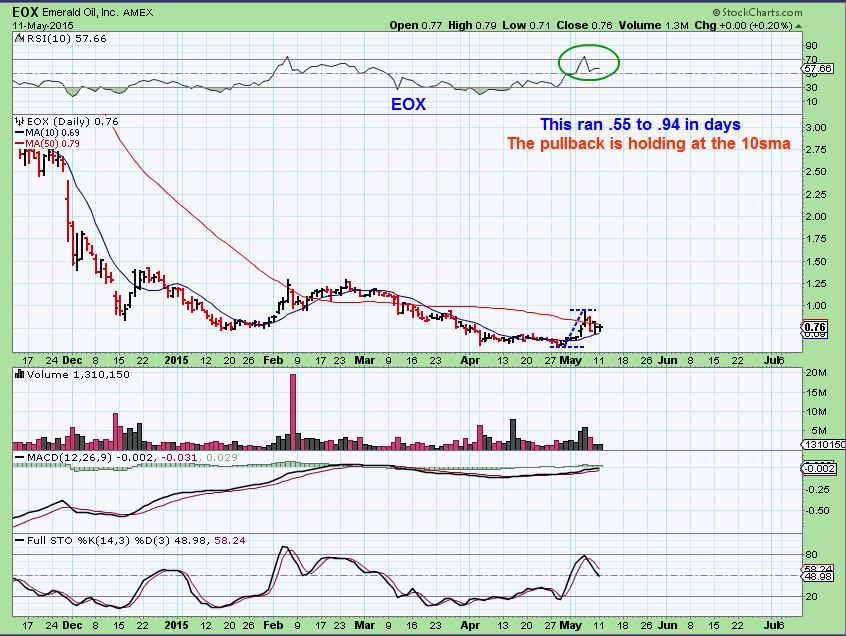
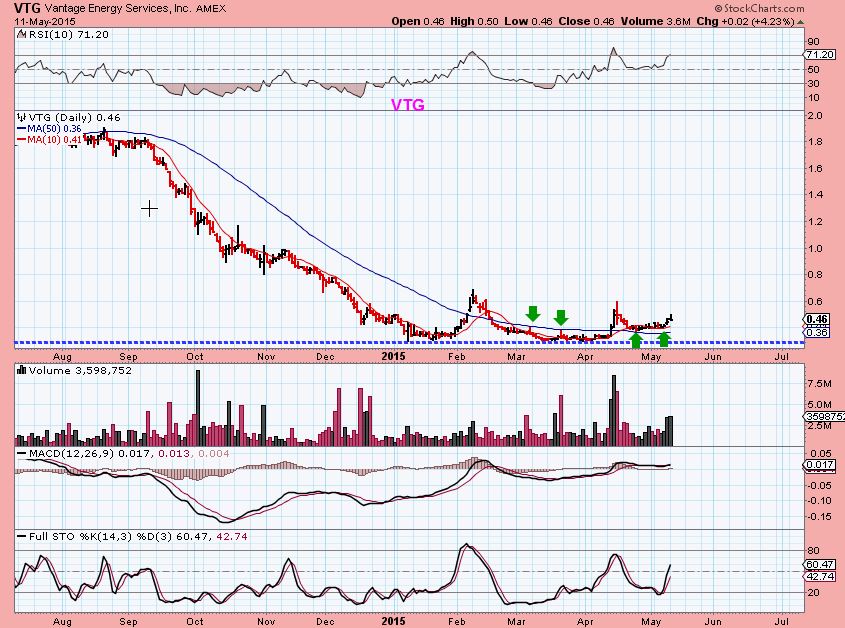
EOX – Energy. It doesnt look like much , but it almost ran 100% recently, and is lightly pulling back in an orderly manner now. I do not own it ( I own a few under $1 like GSS & VTG & BAA and dont like to own too many). I like this set up .
VTG – I OWN IT (Energy)
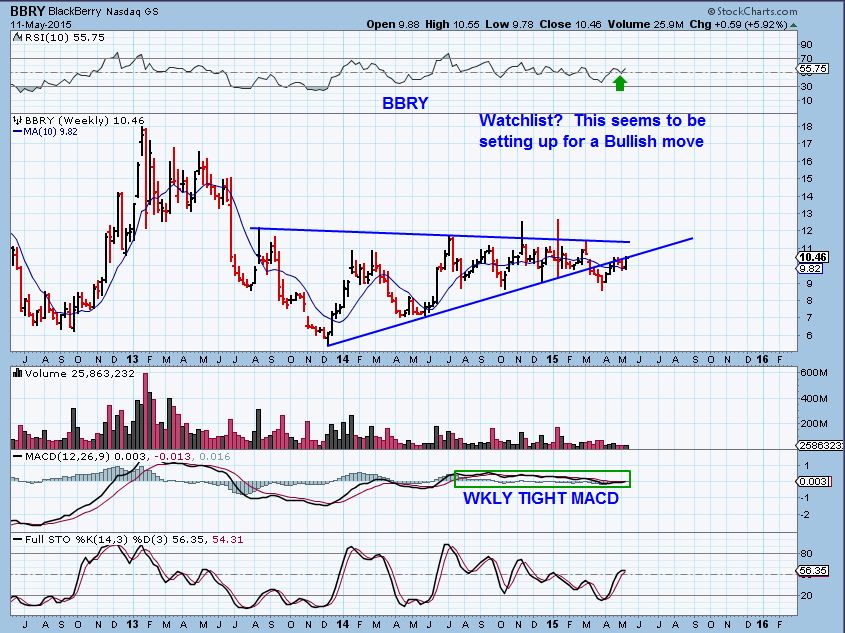
I have been watching BBRY. It looks to be setting up for a break higher. A push & Close above todays highs could get interesting. Watch list. This is a wkly chart.
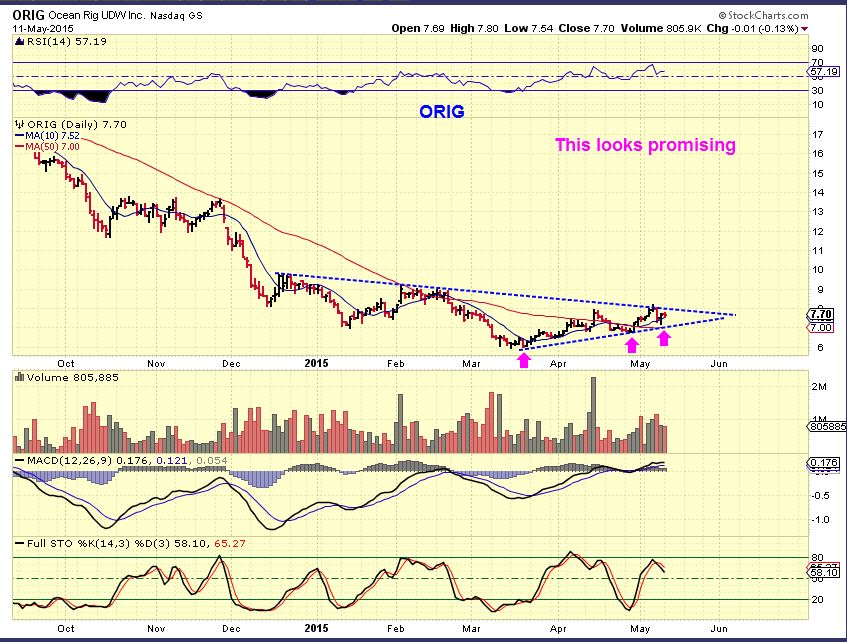
ORIG– nice set up
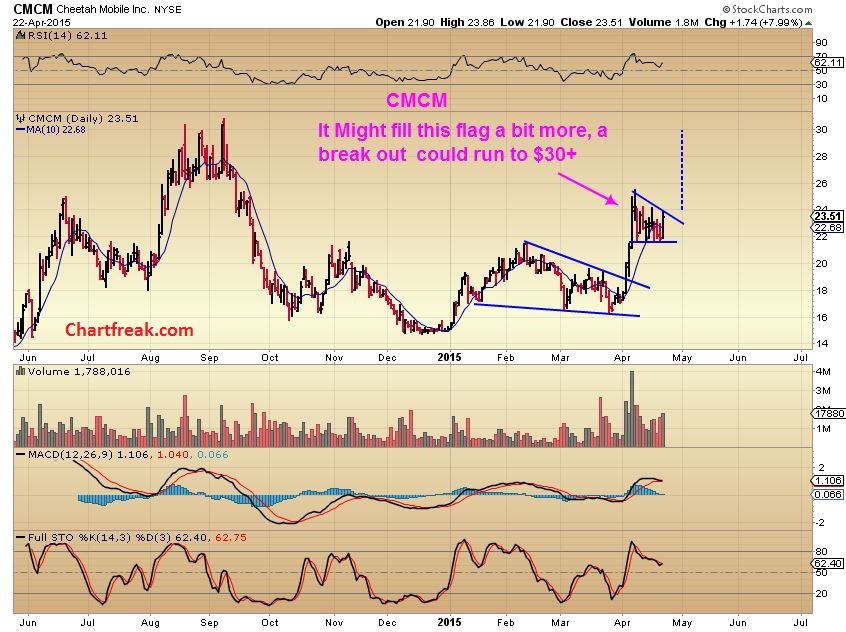
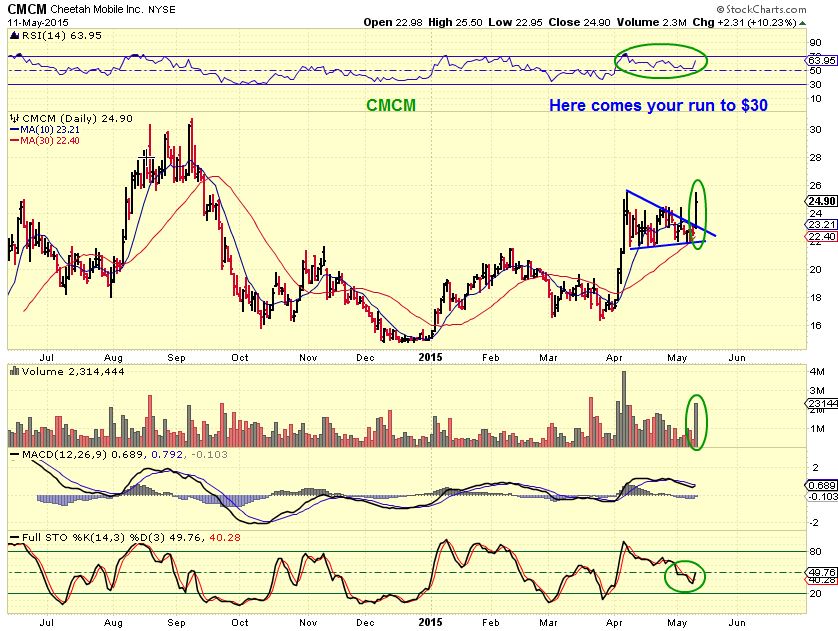
CMCM- I have mentioned this one from the BASE to now. I said that this little CHEETAH can run!! Notice the progress that our little CHEETAH has made & keeps making. I have 10 charts of this that I shared here, here are 2 plus Monday .
The BASE at $15
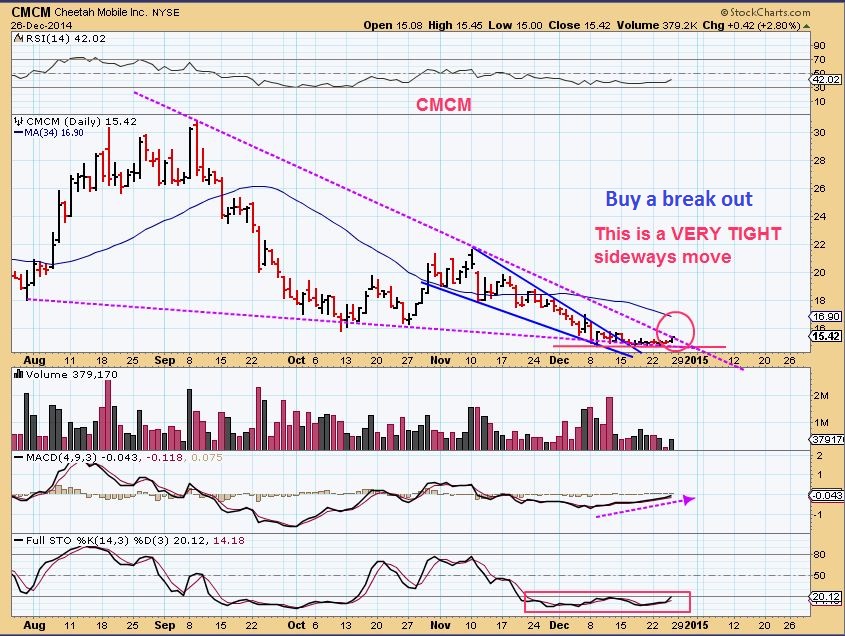
CMCM – April 22 I pointed out this bull flag and said it could run to $30. It was a buy at each dip to $22
CMCM– Monday …she hit $22 a few more times, but looks to be off and running again to $30
From the weekend report – still valid , but should buy a pullback now. It went further up Monday.


Thanks for the trading set up ideas, Alex. Excellent as usual.
Oil appears to be bouncing right off the up trendline (from the bottom on the daily). Could still form H&S and go back to test 54. We’ll see.
Yeah, thought we would get a stronger pullback so wondering if this AM was the entry or more pull back to come? Its healthy down to 54 doesn’t mean it has to get there. Inventory out tomorrow so not likely to take a new position this afternoon. But itching to add more energy!
Thanks for the ideas Alex. I’m still holding NUGT (my GDX chart is a mess, so I’m just using NUGT). Looking to at least go to $12.50. See below. Then either direction (blue arrows). I like CENX & JO but don’t have cash unless I sell something. Would you recommend selling SFY to buy CENX or JO? JO is probably the least downside.
PEIX had a nice turnaround after disappointing a bit on earnings today. Conference call must have been positive. All bought out here now.
Very interesting. Going back down now. Looks like it could be a bit volatile today. End of day price could be very instructive.
I think they are on their CC now.
Nice reversal on PEIX Carl….that may have run the stops under the 50sma and it looks nice now
Took a position in ANGI on the test of the 20 DMA. Maybe a safer course would be waiting for a close above the 50 DMA, but we’ll see. (Maybe the safer course is to stay away entirely! But we’ll see about that too. 🙂
Inteeresting potentially bullish candle on TLT. However, MACD and RSI suggest bottom not yet in. Having said that could be ABC down completed.
Refresh for a chart JD ( dead cat bounce ?? Too early to tell)
Thank you, as ever
Would appear to be support and resistence clearly laid out. $127 needs to be taken out.
Yes, and it does not fit the description of a large bull flag. Look on a multi year weekly.
Large bull flag?
X (Steel stock ) dropped on earnings and has recovered , nice volume today.
ENERGY interests :
TRCH – strong move out of a base lately. OAS- about to move higher ? AAV CIE
REN had earnings yesterday and made an interesting move down and then back above the 10 & 20 sma . I do like the 7 month chart, and I do own this one and added this a.m. .
REXX is acting correctly
AND…..drum roll please…..SZYM???
NUGT/GDX going higher on 15 minute chart with correct volume
SFY… 🙂
From Yesterday….PLUG. This a.m. was down, but is now continuing higher and pushing that 50sma
Bought some PLUG this morning when it was down. Also some CENX. All tapped out for now. Would be interested in GSS on a retrace.
I added PLUG when it was down too, bought on yesterdays Bullish engulfing. If this closes above the 50sma, it could get some fuel to the fire too.
is Uranium sector ready ?
They are all acting differently, some look ready, most are close .
If you mean URA (ETF) It does look good
Can’t get into REXX, she won’t pull back to me. Looking SZYM, BOIL (1/2 only) right now. Have had JNUG will likely take profits on strong finish, EXK looking ok today, strong effort by SAND. Options still no good on miners, look at shares only for now, guys.
Alex- still no breakout in miners even with gold up acts sluggish.. Any thoughts? Looks hugged up against the line and maybe than we get a squeeze? Lot of data next 2 days so maybe that will be catalyst.
When you say GOLDS up….Miners not breaking out, I like to compare what I am seeing equally.
Gold is having an “up” day, but not breaking out by any means . So Miners are also having an up day , just not breaking out yet. Gold was down yesterday, Miners are up 3 days in a row.
GDX reversed at the 50sma and GDXJ is almost near recent highs. Juniors are showing small signs of life.
Time will tell. I have been watching individual Miners and see good things as mentioned.
Take a look at 3 month charts of MUX, AAU, EXK, GSS, AUQ, PPP, BTG, etc…many of these are starting to perk up .
In my weekend report I said it looks like GOLD may be in a triangle and they are hard for cycle guys to count, they are hard for many to read. I see things playing out as expected so far, and yes….data this week could affect things later.
Is BTU done with the breakdown for an entry Alex? thanks for uraninum reply- i was asking based on URRE.
I cannot say for sure with BTU, but it looks like it is setting up for higher price (URRE too).
Actually BTU looks to be above the triangle wedge, it went sideways and broke through ( I hadnt noticed, thx). The only iffy part is that it “Might” test the top of that wedge with one more drop.
Tough call because it is tight range. Long term hold it may be a good buy here, but short term it could drop too. Its above the 10sma , a stop below that 10sma to prevent loss may be fine, but its very tight and may easily drop there.
How is that for indecisive? IN my own acct, I’d buy a partial and understand that it can drop or pop, I’d probably add if it did drop, unless it got ugly & high volume.
I REALLY like REN action today
Key juncture here for COFFEE. Look at a 5 min chart. It tried to break above the lower trendline of the bear flag last night and was looking good, but broke down this morning below the up trendline from the recent bottom last week and is now backtesting it. Still could go either way here but I wouldn’t take a long position until it proves itself back above about 136.5, or even better the 20 & 50 DMA at 137. If it does so those MAs start sloping up.
So again, very key juncture here where it could go either way it seems to me. And short with a stop at 137ish would be a good play, though I’m not doing it myself. (and you can translate all that to a JO chart of course).