
Healthy Pullbacks
As mentioned recently in a prior report, The Markets seem to breath in and out with human interaction. They can Ebb & Flow like the ocean, and some pullbacks can be very healthy , giving the upward move more energy to break above resistance. The picture above shows the idea of a pullback that has done its job. SO in this report I wanted to discuss certain pullbacks that can be buying opportunities, and of course there are some that aren’t. Lets do a market review…
NASDAQ– This was my chart for yesterday, I mentioned that a pullback usually occurred with the little move that we saw on Monday. It too could be a healthy little pullback.
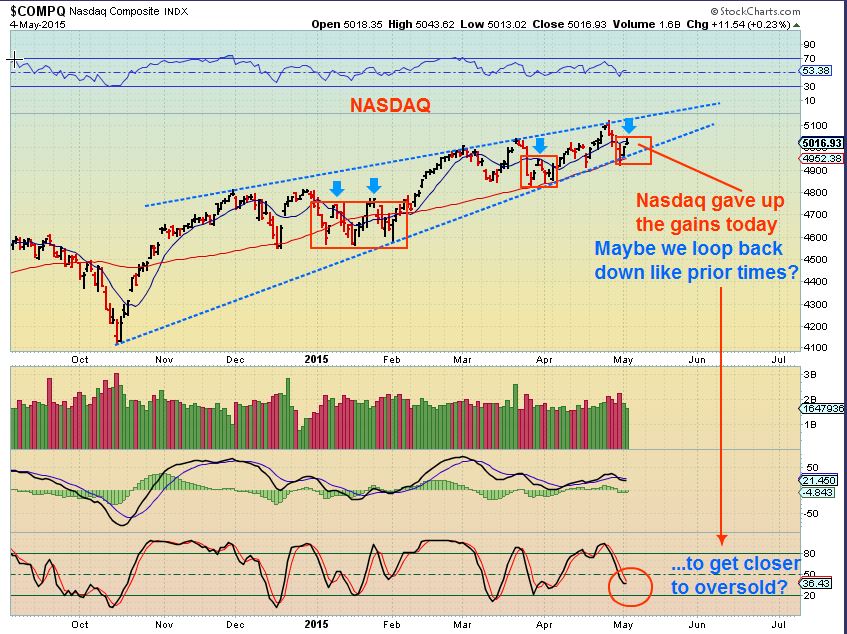
So we did dip yesterday, lets take a look…
Note: I will have to proof read & correct anything worded wrong or typo after releasing this due to time. please excuse typos
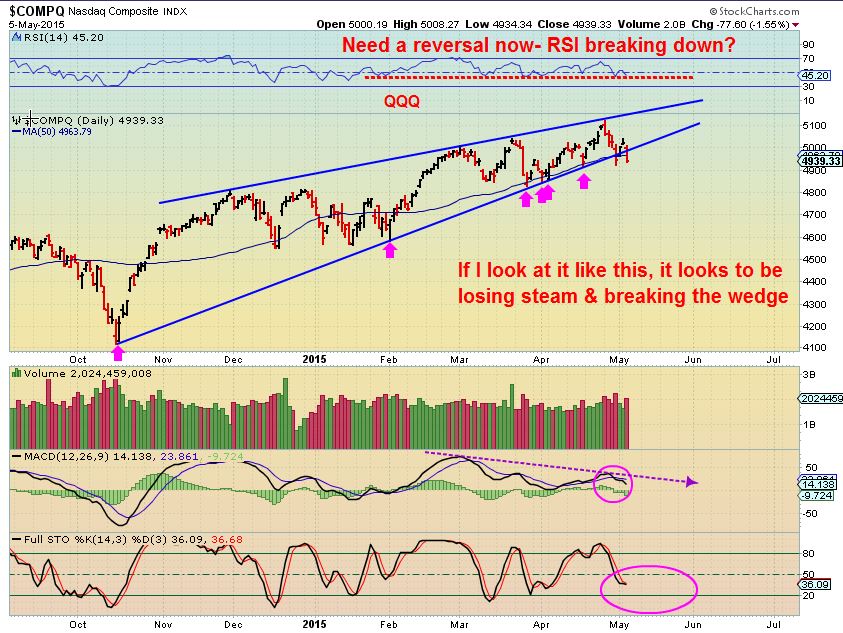
I still see bullish chart set ups inside the Tech Sector, but This dip actually looks a tad deeper than the lower trend line. If it recovers today it will likely run to the upper blue line. If not , the selling could pick up, the RSI is close to a break down. (Caution for the moment)
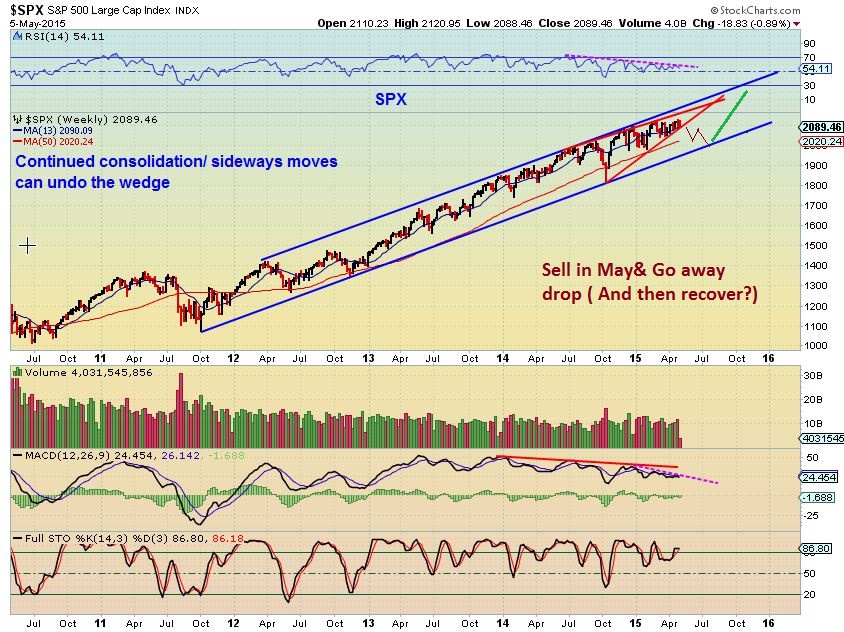
I’ve been talking about the Bearish rising wedges in SPX & NASDAQ that often lead to deeper sell offs. I want to point out that even if we get a “SELL IN MAY & GO AWAY ” sell off, it could just be a large healthy correction for higher prices in the fall. THIS is an idea of how that could play out.
The SPX – Bigger Picture. It is really struggling in this area, going sideways for 5 months. A healthy drop could give it energy to break higher later.
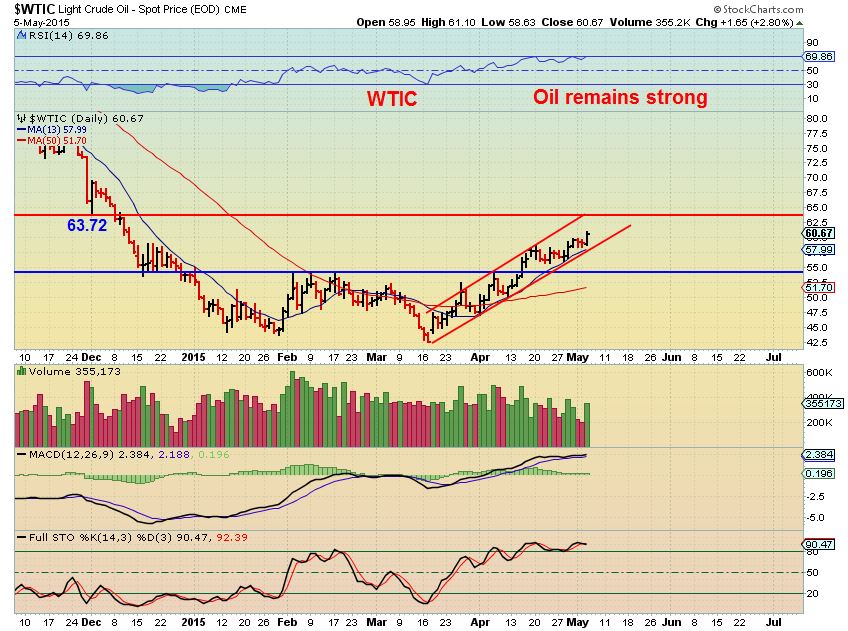
WTIC– Oil continues to look great! Even if it pauses and pulls back at resistance, it would likely be a healthy pullback.
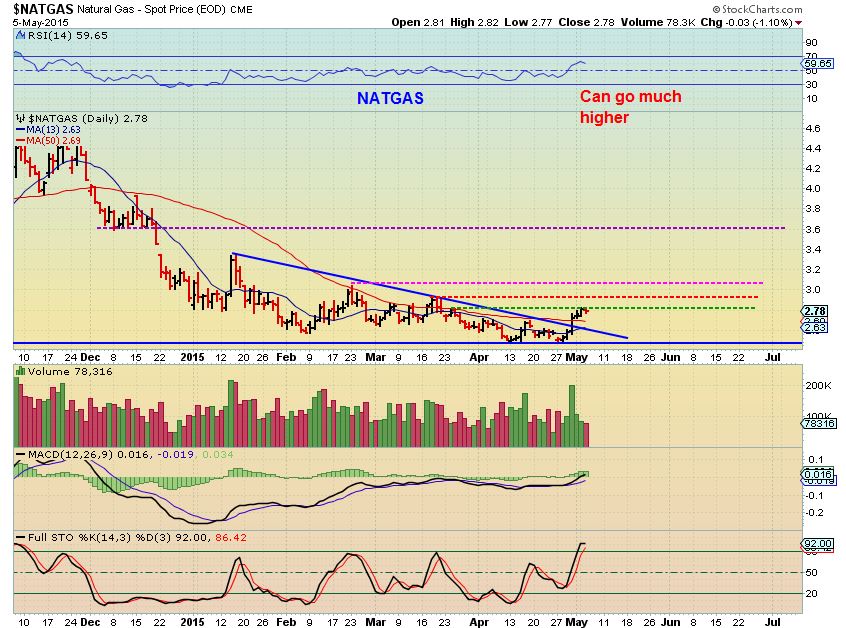
NATGAS– stare at the OIL chart above and if NATGAS does something similar when it gets going, it wouldn’t surprise me. It may go Step by Step as it hits resistance on the way.
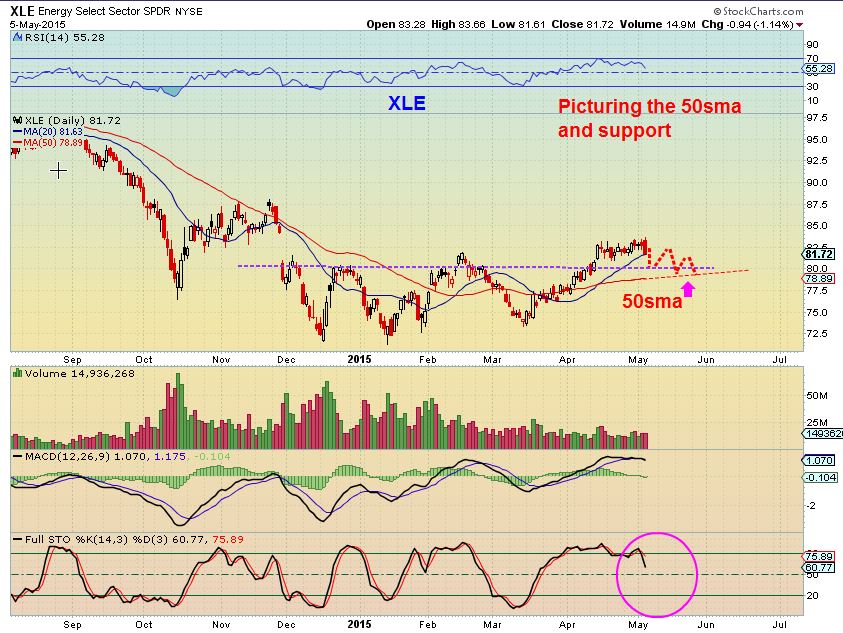
So the XLE did a bearish engulfing . They usually mean lower prices for the XLE, but that doesn’t mean that all energy stocks will drop, or that it will be deep. A healthy sideways pullback could look like this
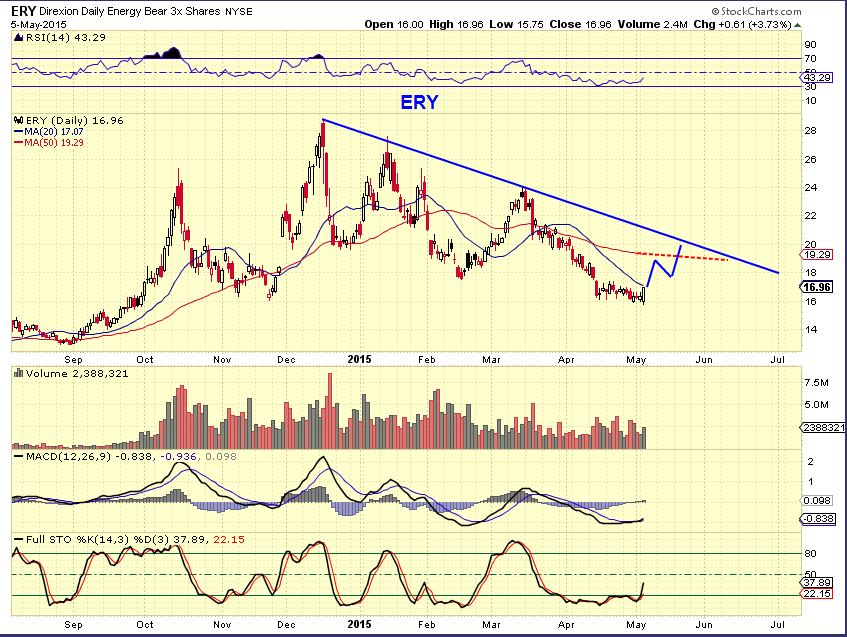
I also saw a BULLISH engulfing on the ERY– so I sent out an alert to point that out .
Also Not all Energy stocks will fall, just because the XLE is looking like a reversal. Many Energy stocks seem to be moving / performing as individual stocks.
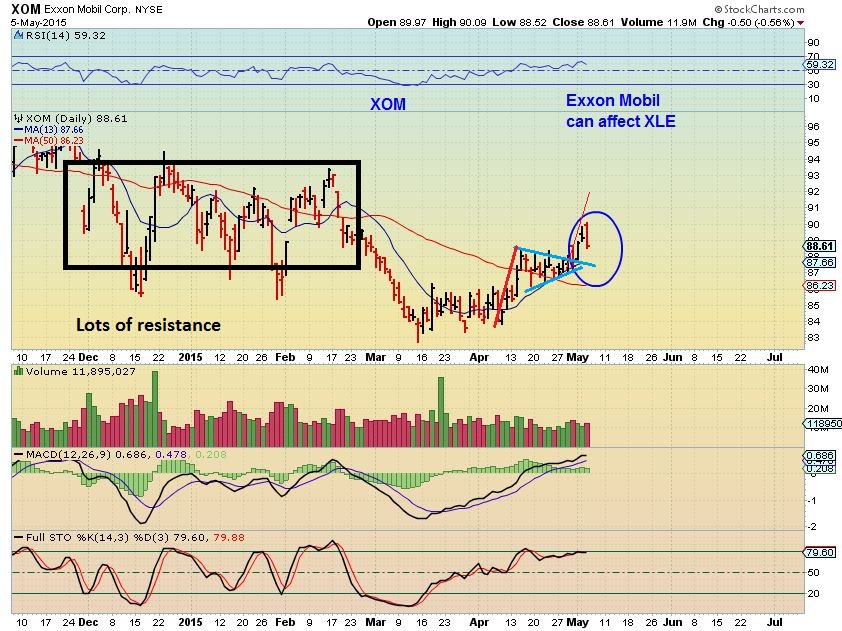
XOM is big and can influence the XLE. Notice a reversal in XOM, and also that as an Energy stock, it hasnt moved much off of the recent lows.
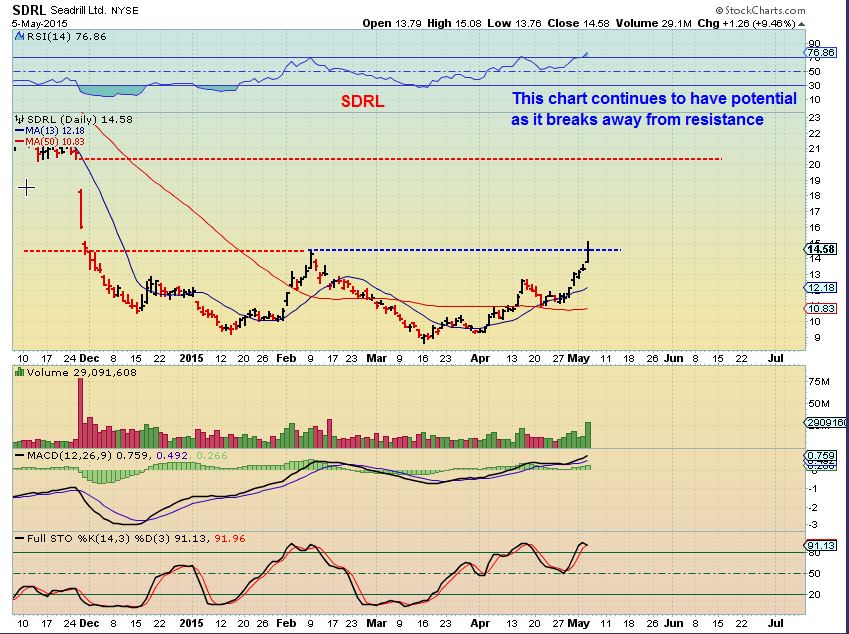
SDRL– this stock is Strong and has less resistance . This is why I stated in the comments that I would hold some REXX through earnings , I like the REXX inverse H&S pattern.
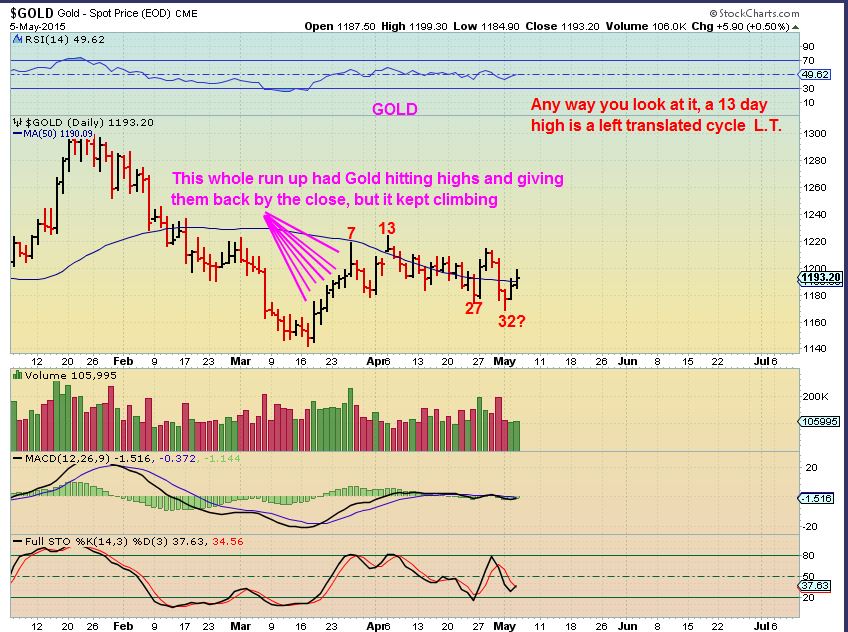
I want to point out something similar to that in the Precious Metals Sector. GOLD (Using cycles) was Left Translated. That simply means that it reached its peak early in the first half of the cycle, and is supposed to indicate that it was weak and will remain weak.
GOLD– Peak on day 13 out of 27 or 32 days, so it indicates possible weakness after the peak.
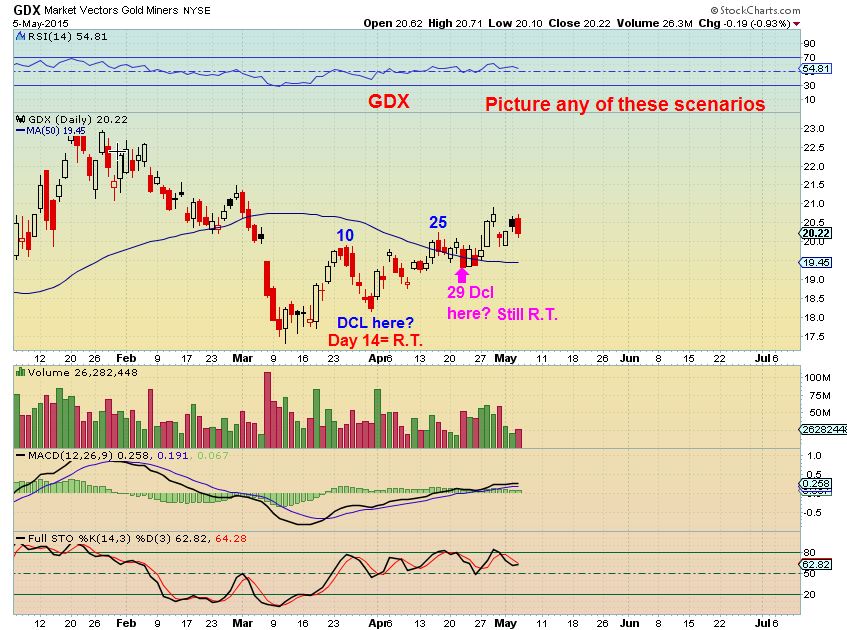
HOWEVER- Note to ChartFreak Readers: look at GDX. No matter how you count it out, it Peaked later in the daily cycle. And when you look at GDX you see strength in the form of an uptrend. So some say you must go by GOLDS CYCLE in the Precious metals area. I say that individual Miners are looking bullish and can be traded / accumulated until they break down. I use technical analysis with cycles, but I go by what I am seeing and as I have stated, I am seeing accumulation and great bases forming in the Miners.
GDX – Cycle counts .
1. Picture a day 14 DCL. Peak on DAY 10 Right Translated (indicates strength , peaking in the 2nd half of the cycle)
2. Picture using day 29 as the DCL. Peak would be day 25, Right Translated indicating strength.
3. GDX is in an uptrend
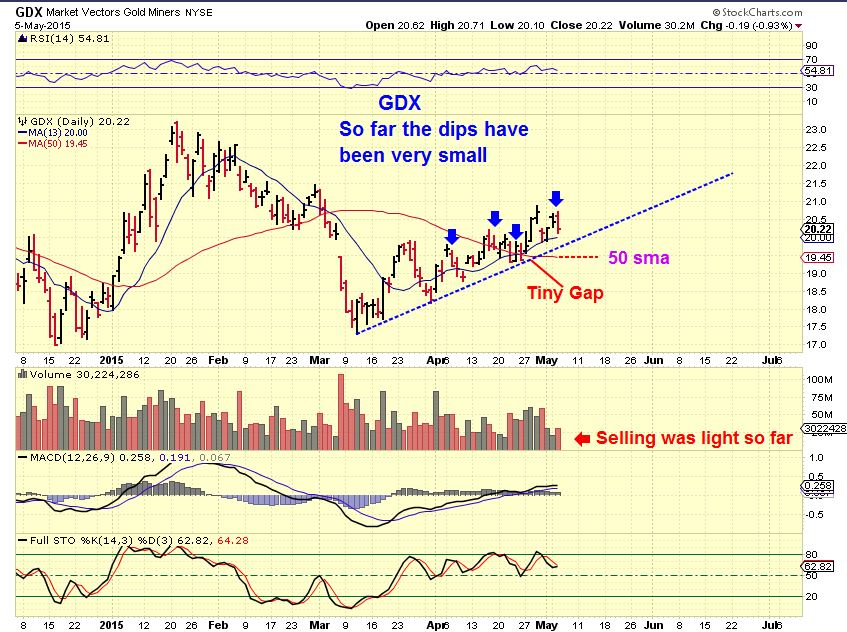
GDX – had what looked like bearish engulfing into the close , that indicates selling pressure and usually lower prices follow. I sent out an alert mentioning that. GDX Futures are higher, so it is either remaining strong, or will sell off into the close. This could just be 1 of those healthy pullbacks.
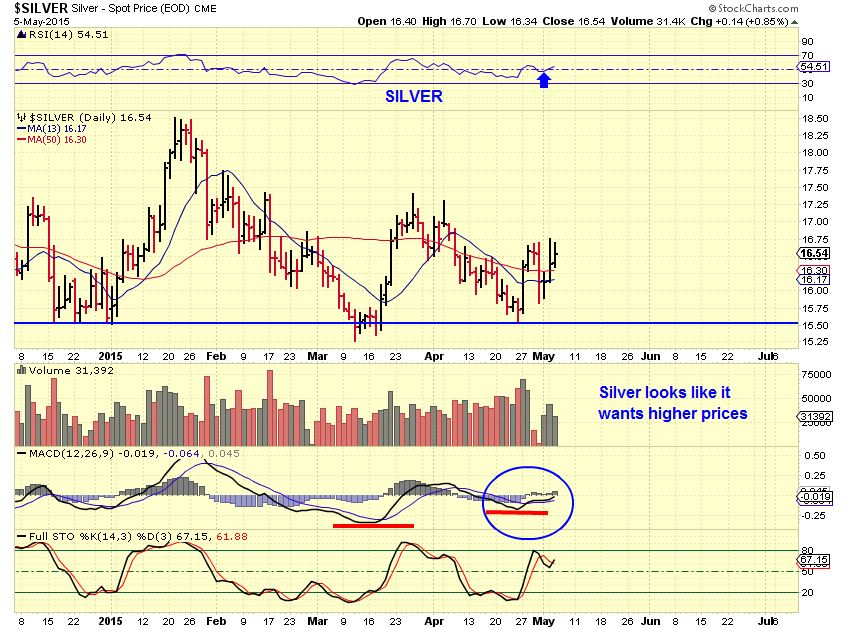
SILVER – still looks healthy above the 50sma , divergence at the lows, etc
I need to release this, it took a tad longer than expected and its getting late, so I just wanted to point out 1 trade idea.
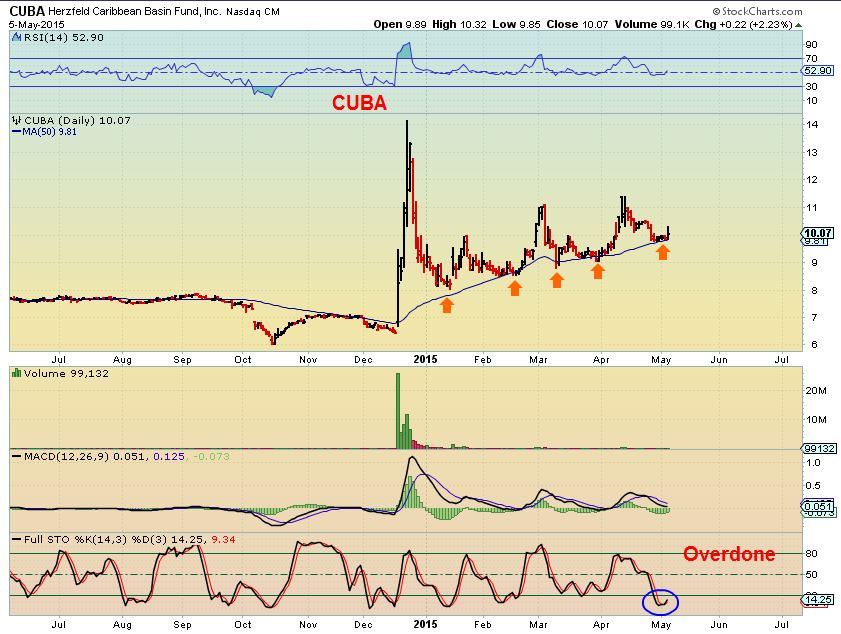
Remember when it was announced that relations with CUBA would change? I saw cruise ships POP and other areas that would benefit from an increase in trade with Cuba. I wrote a few ideas down , because buying the rumor (Pops on rumor) will kill you, but after the dust settles, you may see something interesting. Well on that day I saw this stock ROCKET HIGHER $6+ to $14+ immediately. It went on the “watchlist”.
CUBA- It is settling down and has become very trade-able, but also it could simply end up in the $20’s in time as it continues to find support at the 50 sma.
Futures are up all over the place, but we know that Gaps open can close an continue down, so I usually allow the 1st hour of trading to settle down and get an idea of what may be happening. I may add to certain energy stocks that have released earnings already, since that sector remains strong. BAS is an example of post earnings strength, and REXX may be next? Someone said SFY releases last night, but I have it as Thursday may 7 release, so be aware of that if you own it. Best wishes and happy Trading!
~ALEX

This is a wonderful anecdote-full interview of 1987 and then 2010 Flash Crash. Loved it. http://blog.stocktwits.com/flash-crash-happy-5-year-anniversary/
Thanks Jonathan, checked it out . I still remember what I was doing during the 2010 Flash crash. (Buying 🙂
I let go of S yesterday. Didn’t like the action and it’s quite exposed to further broad market weakness, unlike energy and PMs. The NBG buy yesterday is turning out sweet!
And EWZ & RSX still looking strong.
I also picked up a little UGAZ this morning. May be ready for another leg up, and if not I’d add at 2.70ish on $NATGAS.
I’m waiting on Thursday 10.30 am.
any concerns about gold being up the last two days and miners down?
Hi Knight
I am not concerned, because last week when GOLD dropped $50 Wed, Thrus Fri- GDX was higher. The chart for GDX is healthy lokking so far (See it in the report above) , GDX is above the 10sma. SO far, I am not concerned, I am thinking I may BUY as it tags the 10sma –or watching to see if it goes to the 50sma.
thanks for the response!
Oh, and I should have added that I have to watch how it approaches the lower areas as it sells off. High volume would make me cautious. Light volume selling and I could buy with a stop right below it if we get down to the arrow on this chart (refresh). We’ll see how it drops
.
HOWEVER- the dollar is getting crushed and GOLD just went RED. I may sit on my hands for a bit longer. This could turn into a JDST DUST but if things unravel
Yeah, this is interesting here. It’s never easy!
GDXJ not as bad as GDX, maybe some info there, but hard to tell.
I added to REXX on that GAP FILL. IT FILLED TO THE PENNY : )
I like that INVERSE H&S
Nice! Gotta love it when it works out just right. Makes up for the times when you get stopped out by a penny (or pennies)!
No kidding…like HERO – which hasnt come back for me at all : )
Dollar’s getting hammered. Losing that important support level (apex of the triangle in Feb). Could get mighty ugly as next good support probably not til about 90, though it could find support at the bottom of that triangle, about 93.35, I suppose.
But we may just have seen a failed daily cycle with a day 2 peak. That’s not good; but good for gold!
I’m liking AMCC’s relative strength here with the mkt getting hit like it is. Though I may jinx it. 🙂
I’m long from 5.51 yesterday.
Right now thats a good looking set up, but you “might” have to put up with a bull flag forming first? Slight possibility
Yeah, I agree. It could further back test the downtrend line (and maybe the 20/50 DMAs), forming a bull flag in the process.
Hi Alex, is BTU & CHK another buyable dip today?- Swing /Long Entry. Thanks.
Maybe, but it’s too early to tell . I posted a BTU chart in one of my reports, and the buy was lower than where it is right now. I will report it here (refresh) . So draw that trendline on your BTU & watch that
Yep, buying a touch of the bottom trendline of the wedge would be another way to go. It’s just bloody ugly here; death spiral. Falling knives and all that.
ok, i will wait out..Thanks Alex & Troy .
Personally I wouldn’t touch BTU until it broke out of the wedge Alex pointed out before, convincingly. It just got rejected by the downsloping 20 DMA again. Ugly. I think that is what Alex would say too, but I may be wrong.
CHK today is a classic example of how the nat gas stocks don’t follow NATGAS well on a daily basis.
Bonds are getting ugly too. Can’t rally when ST oversold; not a good sign. And TLT has broken the important 122 pivot.
Alex, Is that an ascending wedge on GDX daily from Mar 9th? Seems to be sitting on support as I write. Any concerns? Thinking might be a good time to buy for very short trade–upper resistance?
It could be and I was watching that, but I ( this is just me personally) dont label it until I have 3 tags on the bottom and top trend line. I only see 2 tags on the top one – the way I am looking at this.
The reason I look for 3 tags is that I have drawn one like you see today , with only 2 tags on the top line and several on the lower line, and it just burst higher making a channel later. I sold early seeing a wedge that only had 2 tags. SO I wait for 3 tags, but yes I do keep an eye on those beginnings.
Thx for the explanation!
LOOK AT EOX ( post earnings) NADL, REXX, and yes, HERO. ENERGY stocks still making good gains
KEG too!
CLNE might be finding support at the 10 DMA. A bit of a bounce
baby steps….. 😉
Where do you dig these things up 🙂
lol… i make some of them. hey…what do u think of this CF [or anyone else with an opinion 2 share–just be gentle] lol – kidding– i actually just want the straight up truth if anyone sees this… https://www.tradingview.com/x/nbJNqMoV/ [that means you too lurkers — if i can come out from the shadows..u can too… I promise i don’t bite…] ;o)
Yes, I can see that as a possibility…I’m just not sure about the time to get there. Yours looks a little earlier than mine, but a short covering/ buying spree could handle that. And thx for sharing
really?? wow…. [insert ariel clip again] ha! THANKS!
Somebody knows something about SFYs earnings release, selling.
Wheat and corn just spiked. Maybe, just maybe, ags are gonna finally turn here.
Take a look at RJA. Pos divs on MACD, RSI and possibly just an little fake break down/ double bottom here. Has to prove itself yet but it’s interesting.
Anyone shorting OIL :)?
Good Morning,
I am considering entering positions in GORO, GFI, PAAS, SSRI, IAG.
Still holding SLW, SAND and GG.
Alex do you see any concerns ?
No major concerns yet, but its odd how things are playing out . GDX pullback looks normal (See 50sma and 20sma and also the trendline) but gold appears weak with $USD down over $1. Odd.
Just use stops and watch the trend lines, moving averages and volumes. I personally am not adding yet , I want to see some kind of buyers step in ( reversal) but there isnt anything abnormal (yet) about this pullback in GDX/GDXJ
Sigh….I know, very odd.
Filled on PAAS.
By the way, I said I personally am not buying But I am still holding what I bought lower too, thought I should be clear on that).
Exited much of my solars last few days at break even or at a slight profit. Those haven’t been doing so well lately. Giving SOL a little room. Its right at it 50DMA.
I’m looking at some of the big runners like JKS, JASO, CSIQ, TSL…and thinking they had a few good runs higher, and now may pull back to their 50sma. Maybe even break it and recover.
If they break the 50sma, I start looking at FIB #;s, because stocks like CSIQ are way above the 50% re-trace or even 38%.
They have had nice runs. Just got into them a bit late and don’t want any losses if I can help it. Their charts don’t look bad.
Exactly, I actually both made and lost in money in this sector by getting in a little late too . Overall made some gains, but NOTHING like what these offered if I had noticed them sooner. Thats why I am watching for a pullback and hopefully they have another run up after .
A while ago I held BIOS and then stopped out at 5.00 Now it’s looking like a good short. Ugly
Not that I’m short, especially with earnings tomorrow. Just pointing out how it’s turned ugly.
Alex, thoughts on SFY, EXXI and PEIX? All seem to be at lower trend lines or 50ma. Loosing momentum?
SFY is recovering. The other 2 look normal to me. PEIX just went green
Pretty big reversal off of highs for WTI. trying to decide if I want to take profits on my 1/2 position in KEG or ride any pullback for a bigger move later…!
SZYM headed back into that gap area. 50DMA is at $3.20. Earnings after the close. CLNE at 10DMA. Ugly reversal in VALE. May be headed to 10DMA at $7.90. Been riding that up the way up.
Funny I was just starting to make a commend about SZYM. Still holding half of original position and looking to add on this pullback. Thinking we might get a quick move further down to close the gap tomorrow. Earnings announcement today after market. I have limit order set for $3.25.
Yes, that looks like a nice light drift down to the 50sma / Gap and the stochastic is finally getting oversold.
Now if Earnings co operates with this one : )
Yeah, I’m willing to give it room to the 50 DMA /gap fill which also closely coincides with the that important pivot at 3.35ish.
Earnings beat by 3 cents. Revenues missed by quite a bit. Conference call coming up.Seems like their Brazil production facility is improving. Not sure how it will react.
Beautiful move off of the lows in SWC today (Plaitinum / Gold miner). The weekly looks nice
i see many pull backs today..what do we dip buy today or short?
Glad I never messed with the 3D stocks DDD & SSYS; uuugly.
XONE too
HYH was mentioned some time ago, when it looked good. Now it’s a short on any rally to the 20/50 DMA.
Glad I jumped ship on NQ. As the saying goes, sometimes your best trades are realized losses (or something like that! ) i.e. protecting capital.
Could be a good short on any strength backtesting the bottom trendline of the triangle that has broken down after the fake out breakout. 50 DMA turning down too.
Kind of ugly bearish engulfing candle on EWZ; now we see if there’s follow thru tomorrow. I’ll bail if so.
Not quite engulfing, but close enough.
RSX too, definitely engulfing.
I’m not exactly sure what is going on, just know that it doesn’t smell exactly right. Alex, I know we don’t talk about bonds much, but holy cow, rates are going up incredibly fast. Check out TLT. Markets are extremely volatile and now we have money flowing out of bonds, markets, metals at the same time dollar is down. That doesn’t make too much sense. Seems that folks are front running a rate decisions but without any recent data to support. I’m looking at staying a little more heavy in cash for awhile.
Short the homebuilders? ?
Maybe? Though the best entry for that has already presented itself. There should always be a long available somewhere is some asset class. Was hard to find that today.