
CRAZY
CRAZY, right? What a difference a day makes. Traders that jumped from Long to Short on Tuesdays drop have likely been burned, and that may or may not change going forward. Lets take a look…
SPX WKLY- I love this. 🙂
.
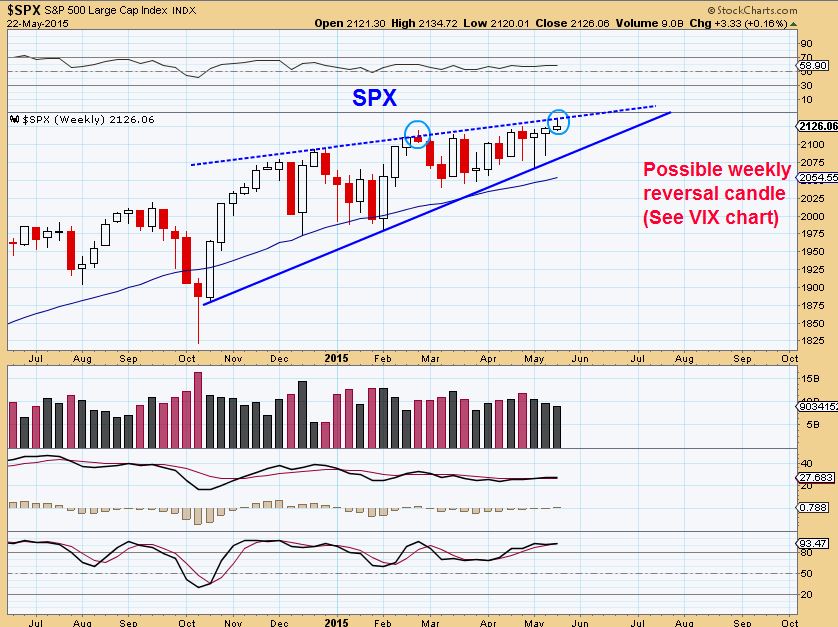
This weekend I showed this weekly chart.
1. Possible top Friday
2.Vix at lows
3. SPX Wedge , so I said to expect a drop.
SPX WKLY – Monday was a holiday, so this is the wkly after Tuesday & Wednesday. The drop & recovery – Boom, Boom.
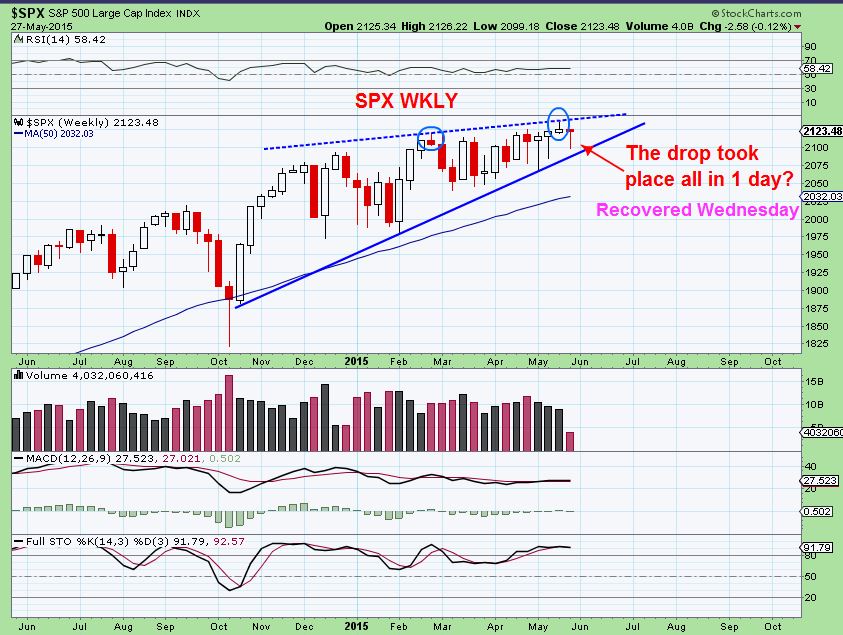
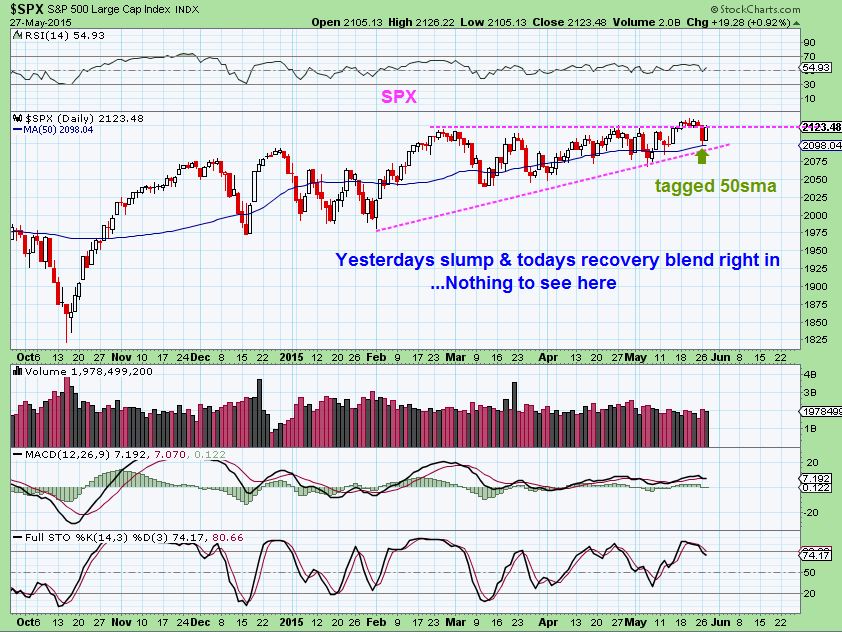
On a daily – you cant even tell anything happened.
NEXT…
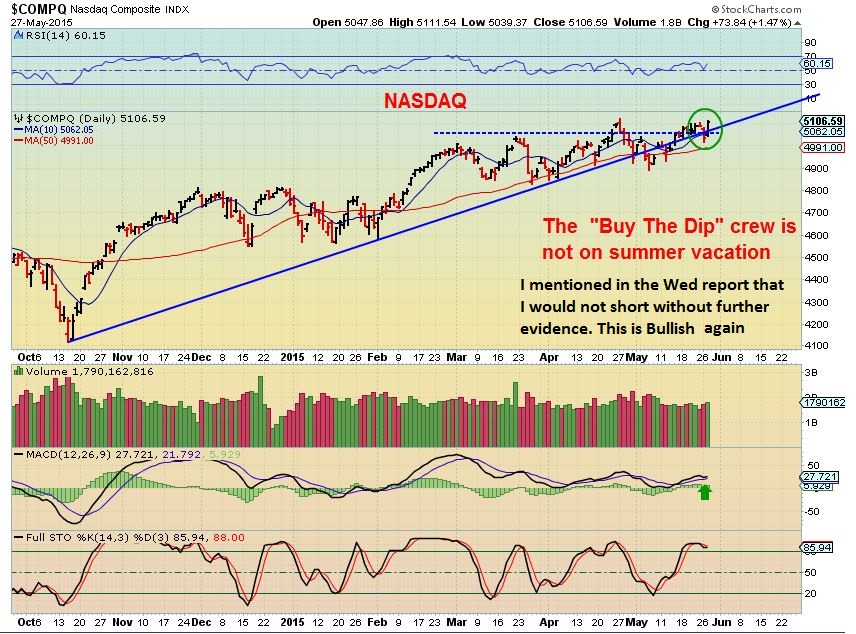
The NASDAQ has been breaking down, but it was strong Wednesday. Almost new highs!
The IWM is still bearish unless it breaks back above this , and it might! look at the Semi sector
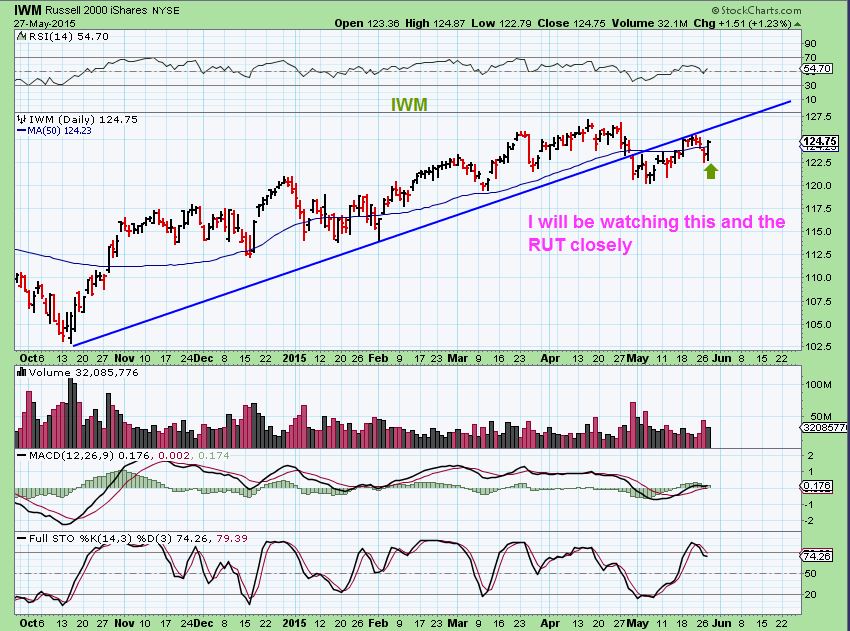
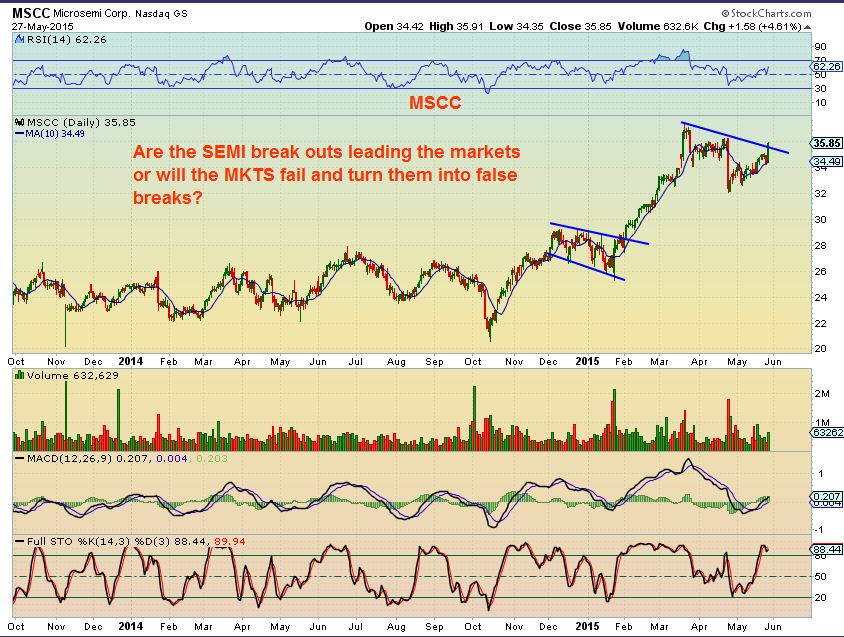
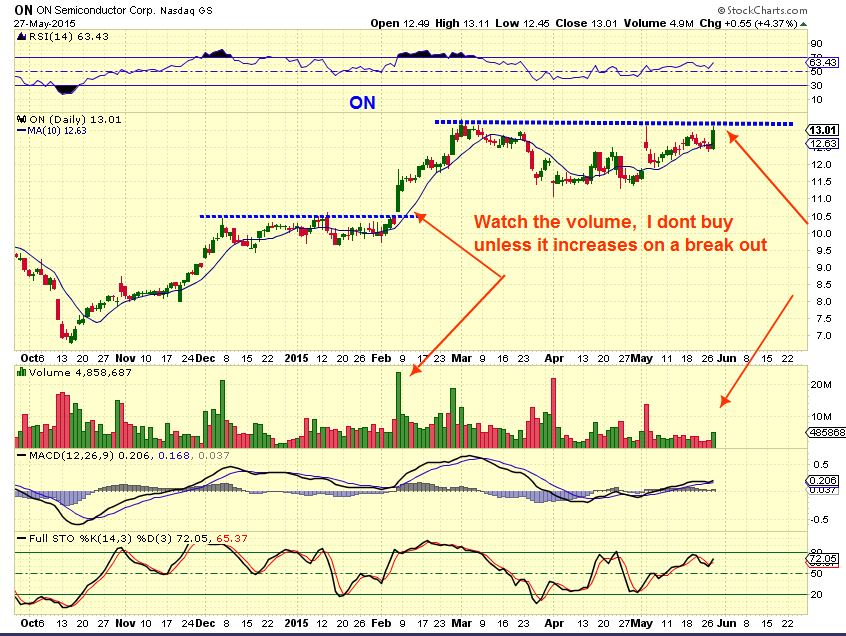
The SEMI’s usually lead the markets , and there was a deal made with BRCM that caused the semi’s to take off. See BRCM, AVGO, NXPI, CRUS, (The following may be a ‘buy the break out’ type buy here for traders) MSCC, ON, SIMO . 2 Charts will be added to the end of the report.

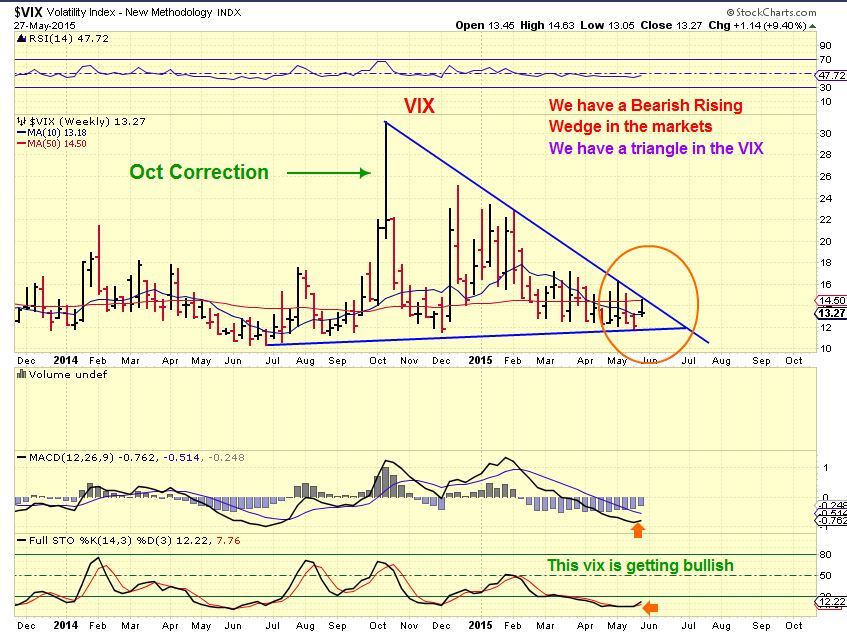
We dont want to forget that VIX however. This is a weekly chart. Notice that it Popped last summer, then dropped again and took off in October, dropping the markets in the fall. We could actually repeat that, which means pop above the triangle and back test, then run up this fall. That would top the markets .
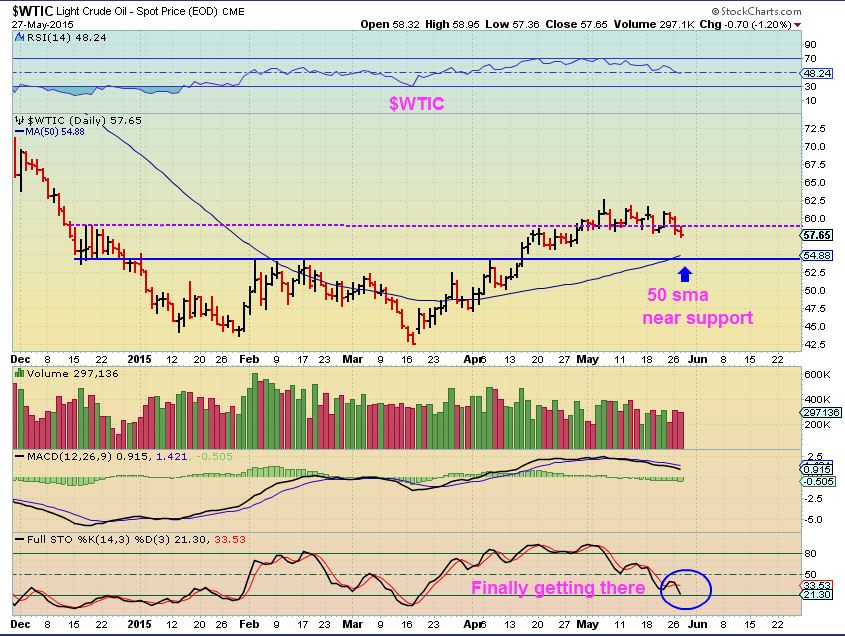
I had CNBC on in the background (Contrary indicator at times ) . I was hearing that ” OIL is really struggling and after losing $60, could be in big trouble.” HUH? Lets take it a step at a time and look at the chart. This chart remains Bullish to me, as oil does NOT want to sell off. If it drops to $54, its likely to stop there.
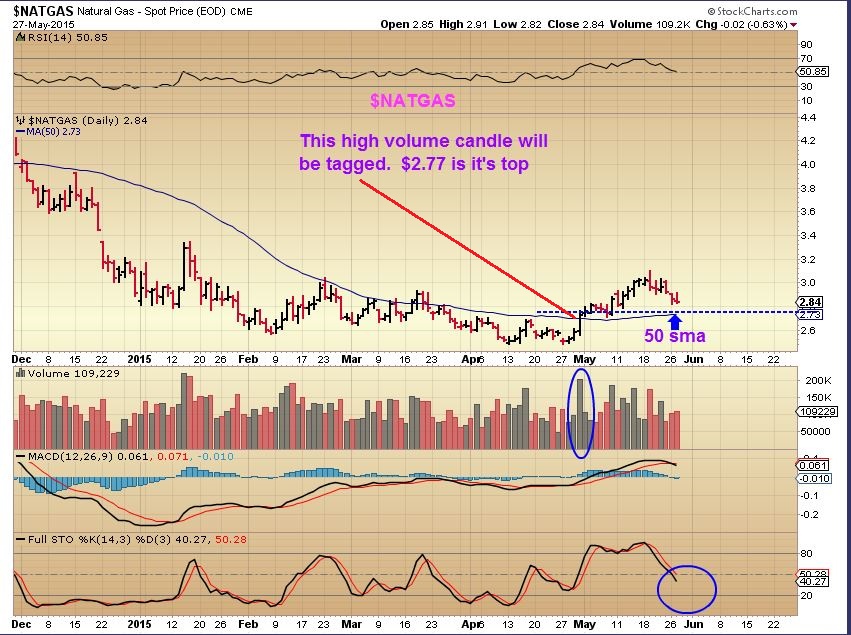
$NATGAS – Acting as expected, not oversold yet, and support could be at the 50sma.
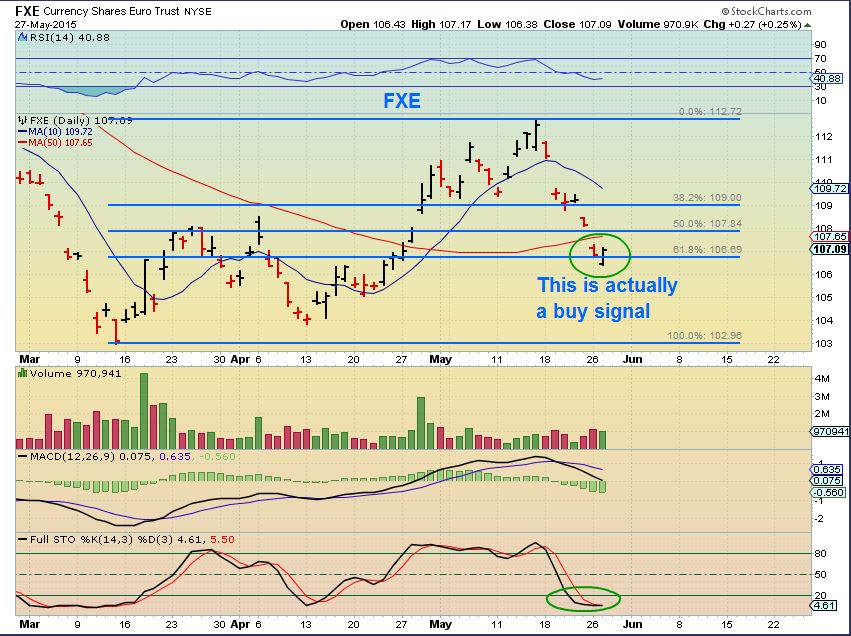
This is surprising, but the FXE got a “buy” signal. It is only a quick buy signal, it works this way. In a sell off, a gap down & recovery of 1/2 of the last candle is an immediate buy at the close. So the FXE should go higher tomorrow (or overnight) . It doesn’t indicate a big run is next , it simply shows exhaustion of sellers/ possible short covering. That may turn into buying since it is oversold, but its just a quick trade signal.
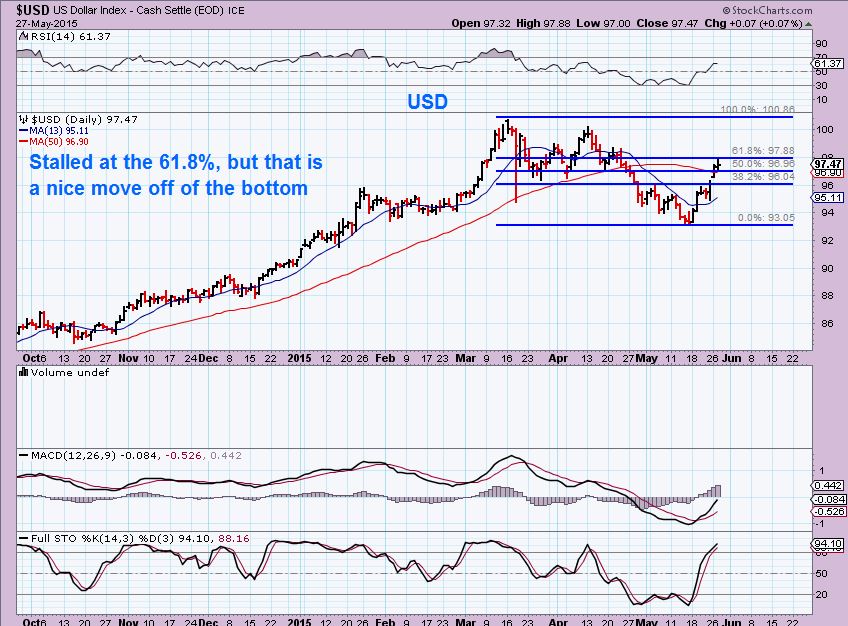
The $USD would be the opposite of the FXE. It hit the 61.8% and dropped. Pause? Sideways? drop? Obvious this is important to commodities.
In Wed mornings report , I mentioned that Gold looked bad, but Silver (surprisingly with that C.O.T.) held up rather well Tuesday. I said that I would not short this set up, it was still not acting all that bad. I would wait for the 3rd daily cycle to short . Did anything change today?
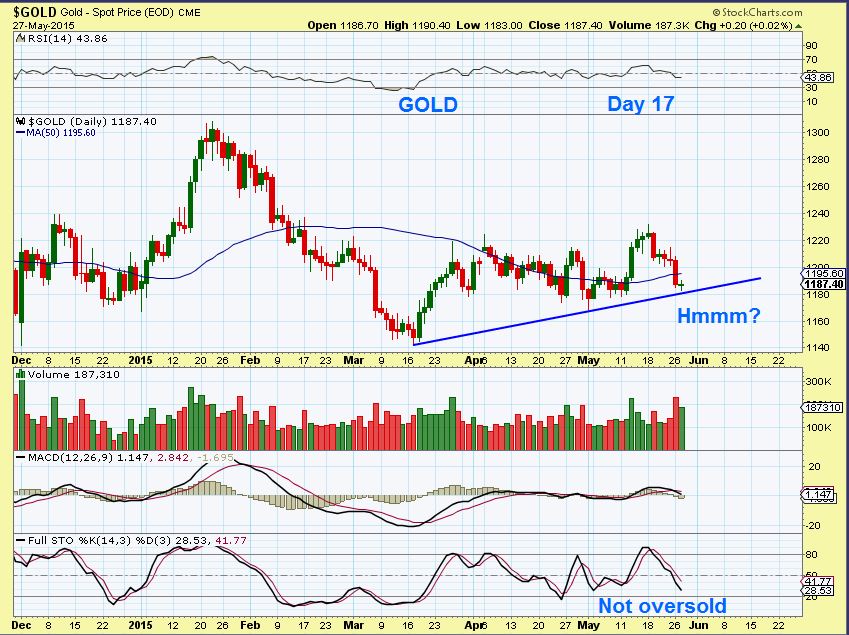
GOLD- The Bullish view = Gold is on day 17. If it bounces here and then drops to a DCL, it may not even break the May lows. A low before day 22 is Right Translated too. The bearish view ? Gold just breaks down, especially below May lows and then March lows.
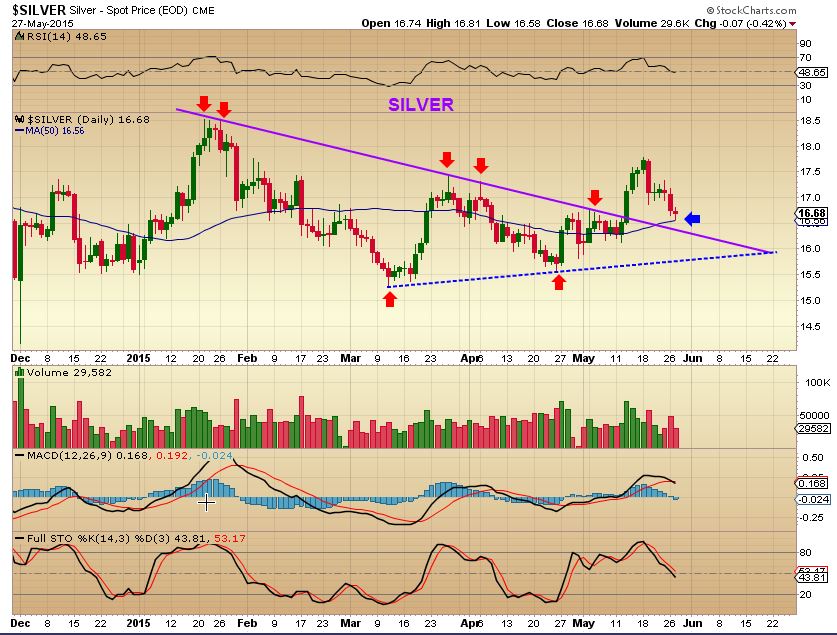
SILVER – Bouncing off of the 50sma with light volume selling , Silver remained bullish from a technical analysis view. It could be a fake out, with that Bearish C.O.T. reading and Silver is not oversold. Silver still looks Bullish oddly enough.
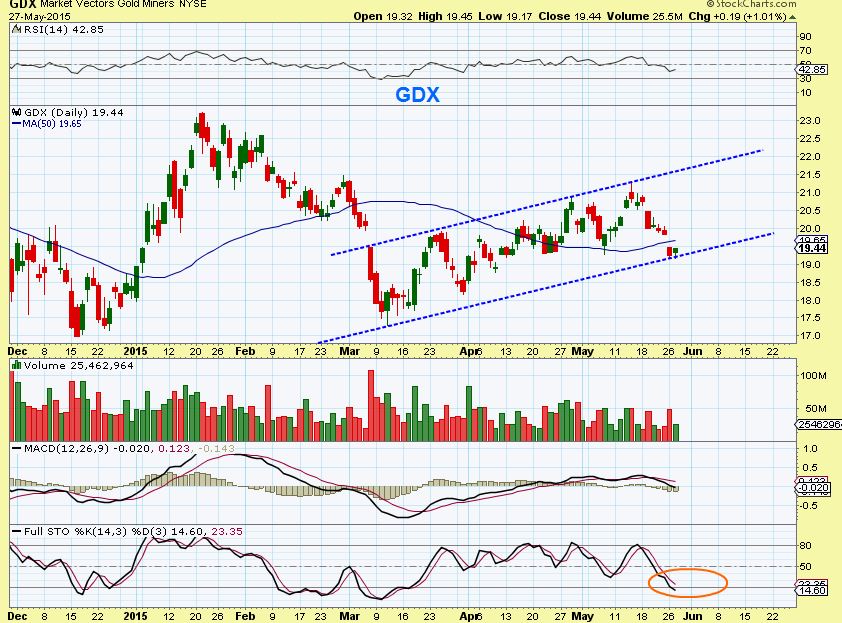
GDX- Below the 50sma, but Still in a channel? If the dollar drops a bit, GDX could regain that 50sma. If not, it may then be a short candidate for traders if it tags the 50 and drops into a deeper dcl. I still may wait for the 3rd daily cycle to buy Dust if I do go short.
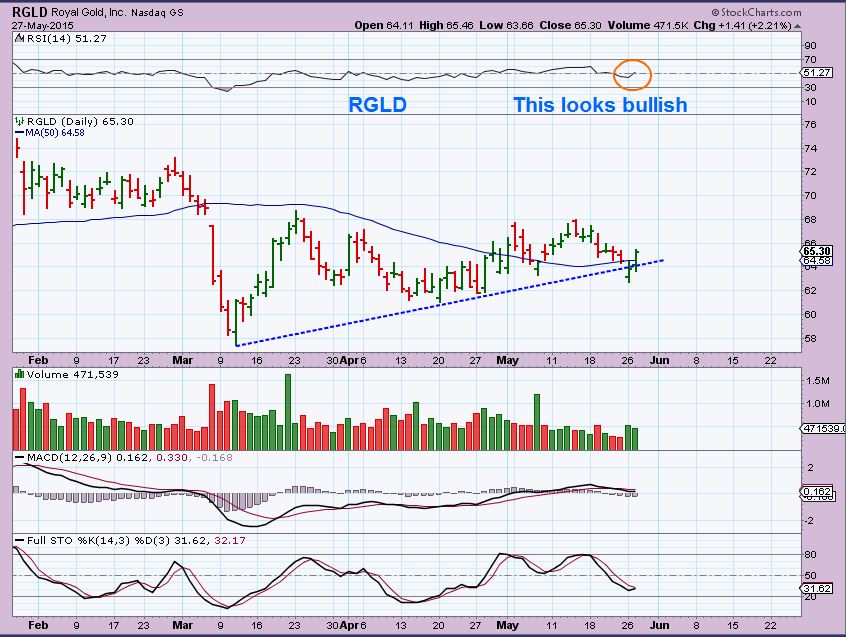
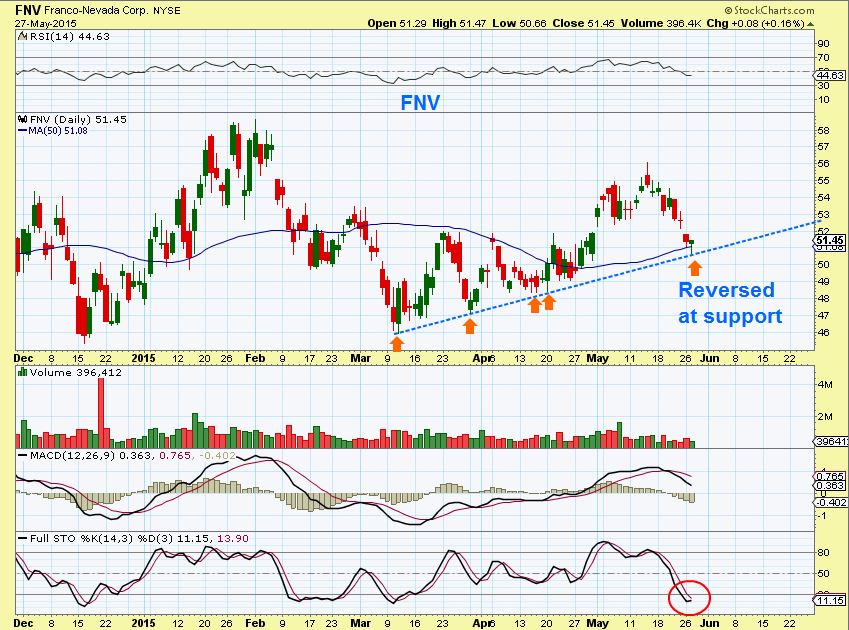
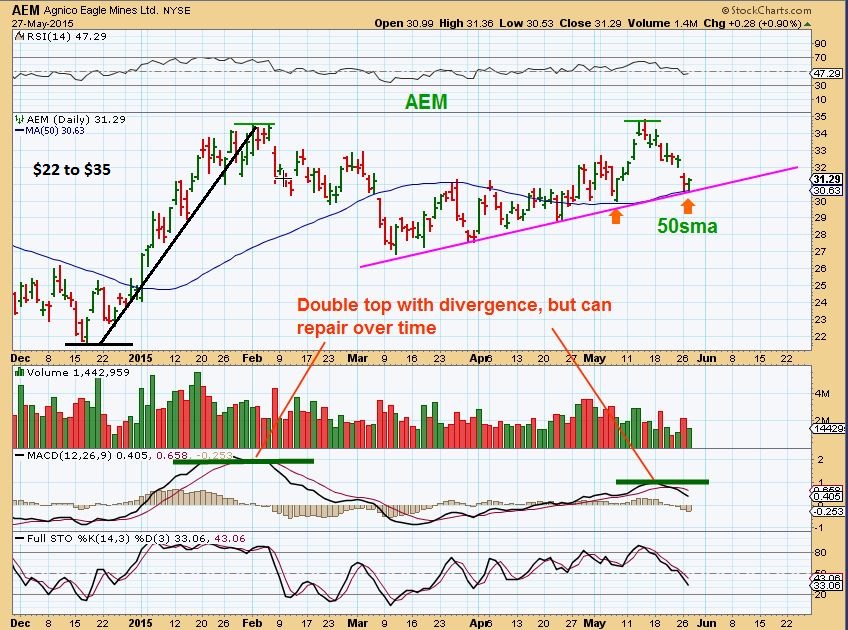
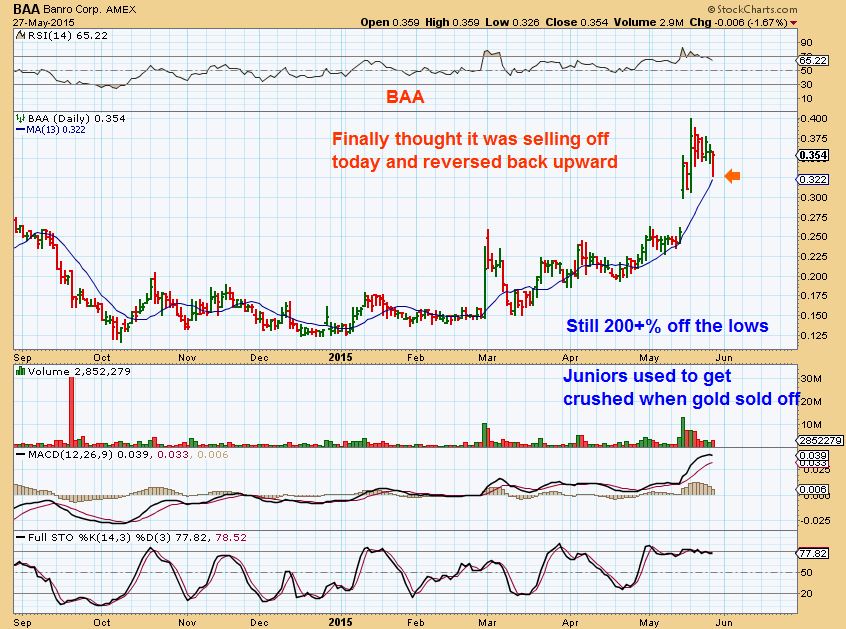
I have mentioned that certain Miners just look good despite the strong dollar and threat to Gold/Silver. I mentioned TRQ, EGI, BAA, GSS, NEM, etc . Here are couple more charts of other set ups that just are not bearish at this point.
RGLD – break down and recovery
FNV – another reversal at a key point. Oversold.
AEM– ran $22 to $35 from Dec lows and is still above $31
And the JUNIORS that used to get absolutely thrashed when Gold sold off, are holding up . BAA, TRQ, GSS, EGI, etc
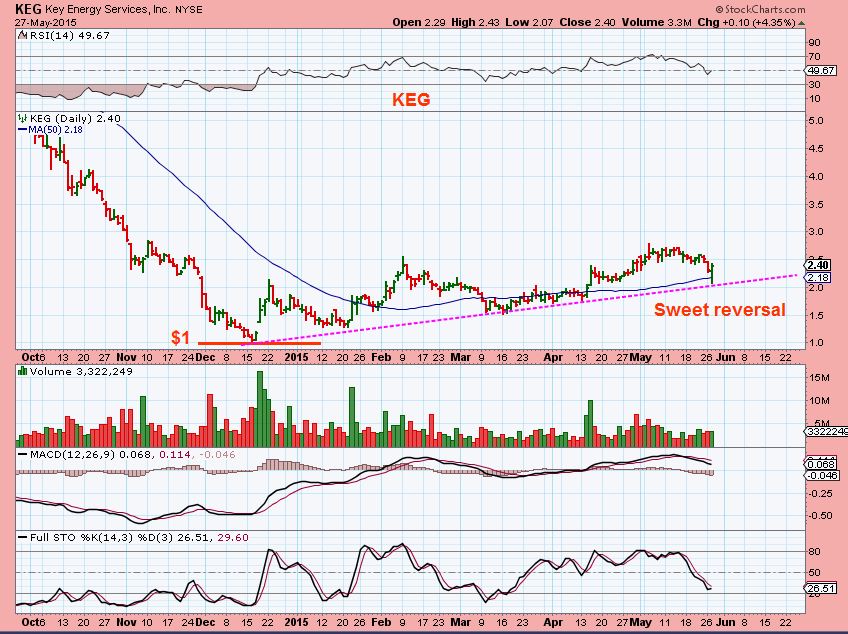
So the markets are volatile and though there are many trade ‘set ups’, the volatility is making it difficult to make money and keep it really. Stops are being hit in both directions now. Fast trading is the name of the game, unless you bought stocks a while ago and your entry is well below current prices. So if you’re not in front of a screen all day, what can you do? Patience may be the best thing. Find some low risk entries in areas that may be settling down. OIL looks close to a low and NATGAS may also be. Energy stocks are starting to set up for another run. ( KEG put in a sweet reversal today, after running the stops under the 50sma).
Keg is a low risk buy with a stop below the 50sma somewhere, but I have to admit that the stop run below the 50sma may have taken me out.
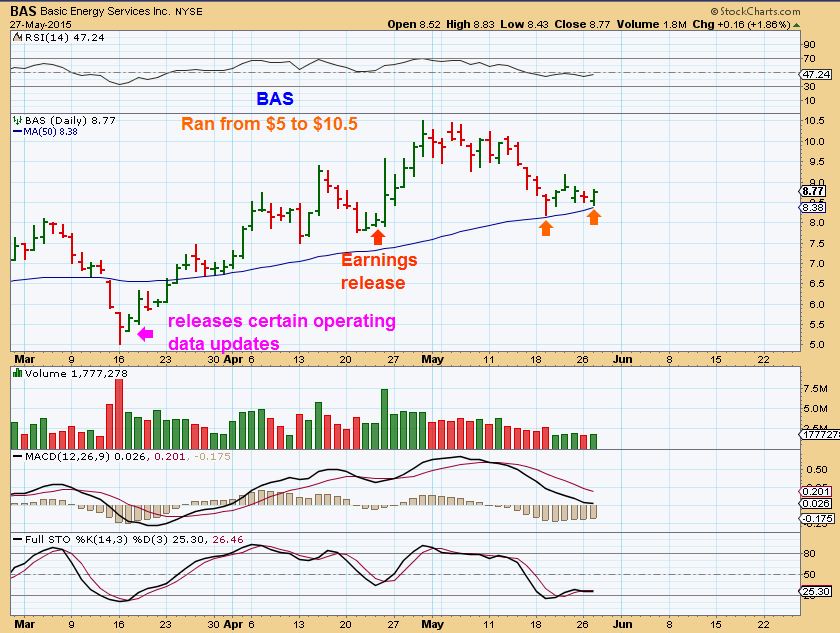
BAS- a buy bouncing off of the 50sma with OIL almost done pulling back
Precious Metals and miners may bounce here, but really they look like they may break down and fail later. The silver C.O.T. is quite bearish and the count ( cycle wise) indicates that there is more downside. I believe that those future lows could be a really good buying opportunity! The dollar would likely be pulling back then and the commodities seem to be bottoming now. Time will tell if we get that kind of a trend change, but its how I am seeing things.
Today is Thursday and I dont usually have a post Friday , unless there is a major change to report. Often not a lot changes between Thursday and the weekend report, not many like to BUY on Friday and hold over the weekend anyways. If I do see some nice trade set ups in Energy or another area after todays trading , I may post a couple chart set ups . If nothing special shows up for tomorrow , I will just wait and write the weekend report later. These markets are shaking it up, Stay Frosty and have a great weekend!
~ALEX
.
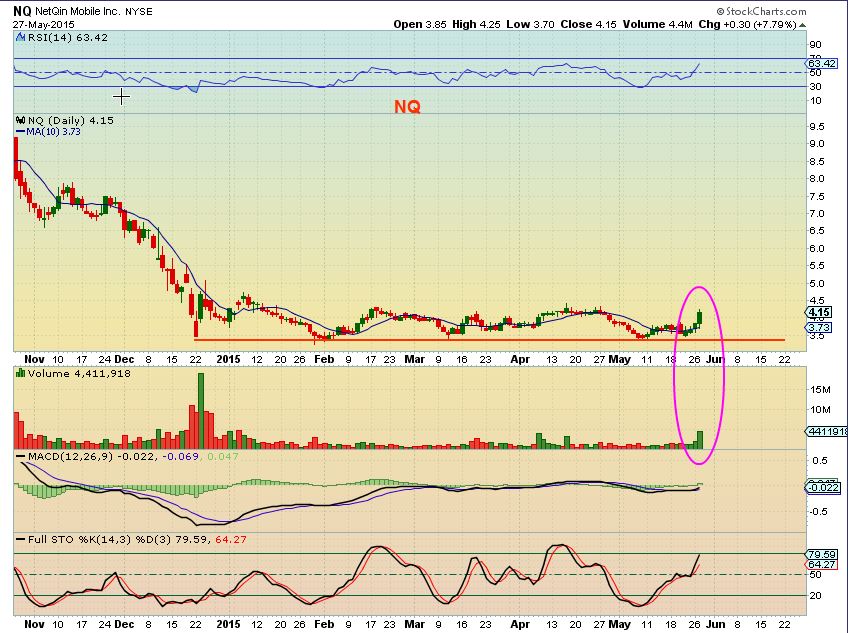
I have mentioned CMCM and NQ in the past.
NQ has a nice base and sudden volume . It looks like it may finally break out. In after hrs it pulled back to $4. I may buy a pullback, the 50sma is near $3.75 for a stop .
2 Examples of Semi’s mentioned above. They look ready to break to new highs and run.
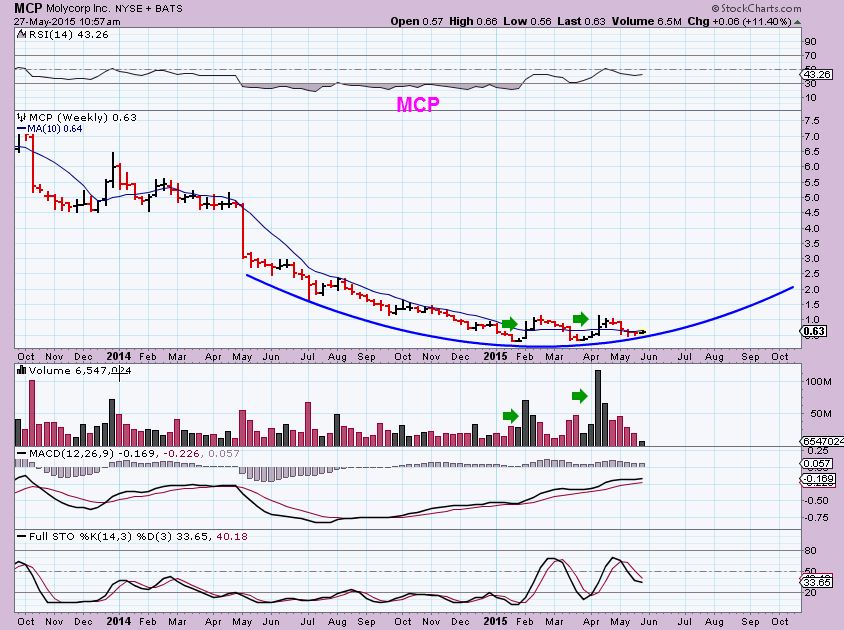
MCP WKLY– Risky since it is a Rare Earth company losing money, but this base looks productive.


The miners have broken their intermediate trend line and signalled a failed daily cycle by starting a new pattern of lower lows and lower highs. It’s still early in the daily cycle so more down side is possible before the cycle bottoms. I would say caution is warranted in the metals sector.
Since we’ve still had nothing that looks like an 8 year cycle low I’m expecting it to occur later this year or early next.
Thx,
I will cover this in my weekend report so all can see it.
GDXJ still above 50
Juniors are not acting correctly…they are showing strength : )
And sometimes you get a false break out (fakeout) and recovery. Cautious here, but I feel more downside to the miners as well.
Yeah, I agree with that too. I dont expect strength , thats why in my report I mentioned even possibly shorting a tag of the 50sma or short the 3rd daily cycle. I’m thinking I wasnt clear if I sounded bulllish miners.
I am seeing bullishnes in individual miners as mentioned. That can change , but its noteworthy.
THEN I was saying a great buying opportunity later, after a 3rd or 4th daily cycle could lead to good %-Gains.
I was referring to Gary’s chart.
sorry
http://stockcharts.com/h-sc/ui?s=GDX&p=W&yr=1&mn=6&dy=0&id=p15431055124
It’s looking like the bear market rally in the CRB has likely run it’s course. It too is due for a 3 year cycle low later this year, or early next if the cycle stretches a little bit.
FEB 2009 to JUNE 2012 was almost 3.5 yrs , I would think that the next could be shorter to split the difference.
June 2012 to March 2015 lows is 2yrs 9 months. Thats pretty close to 3 yrs
I call it a 3 year cycle for convinence but the average duration is 3 years 3 months.
Not Sold on GOLD here. All the indicators are heading lower. Still isn’t oversold. Thanks for the analysis. I’m expecting another big drop in Gold at the open, just a hunch. I did sell my DUST Yesterday, made some $$$ over the weekend although I was nervous.
Me neither. Was hoping big buyable spring low but not the case. Worst case would actually be like last two weeks of April – neither short not long could make and keep any money.
FYI Alex, a few of the charts didn’t show as usual. There was a button for each to see them, just odd. MCP, RGLD, VIX, BAA
Really? I see them Bill. Maybe you logged on quickly and they hadnt been completely saved to the site. Can you try refreshing and letting me know if you get them now? Thanks
Alex, all set. Looks good.
Thx Bill
UST yields heading back down. As Alex pointed out on an excellent chart, next stop up appears to be c $127 on TLT and down to c 1.97% on 10 yr.
Yeah, was going to get TLT on the next dip, but appears I waited too long and missed my entry.
But the Dip folks definitely on the spot yesterday. I have not made a broad index trade in months, long or short, for exactly that reason.
Oil really moving down now this week. Could hit 50 SMA soon, looking for sweet but there.
Boy, you must hate how close the “t” is to the “y” on your keyboard 🙂 J/K , lol
Syop yhay CF!
Tahnk s DJ
Stupid mobile. Hope you got a good laugh, just keeping it light here!
Yes, I laughed, with you, not at you 🙂
I’m DUSTing today 🙂
Lets hope that your DUSTing Cleans the House nicely
silver is making gurgling noises … HL EXK CDE etc u may hav said that above.. LOL i havnt had chance 2 read it yet …
Nat Gas could Not hold the 50dma. Too bad…….grrrr
Oil (USO) is on the 38% Fib level and very near the 50dma….fyi.
Ken
I have the 50sma for NATGAS at $2.73 and price at $2.78
Are you possibly looking at UNG or UGAZ? Or maybe EMA? I use SMA
I am charting UNG w sma so ……… sorry to confuse !
I have Not stopped out so I may utilize $NATGAS for my stop.
I know UNG is not the best to track NG but I like the chart……
Update…NATGAS is now at $2.73 @ the 50sma…Maybe Ken is able to see the future before it happened.
My wife does call me The Prophet. 🙂
………amongst other things……LOL
“…Kenny bo benny fee Fi Fo Fenny … Kennnnny .. “
The memories are flooding back into my head…..lol
Seems they let ole Maria drink at her day job. very nice.
And how do you solve a problem like….oh never mind.
IKR? and ps. i STILL havnt read the report 2day… :-/ im liking EYES tho ..anyone else??
…….. BEULLER??
https://www.tradingview.com/x/UN2KvLNq/
lol…. yeah.. feels good, doesn’t it?? #4everYoung ;o)
he has ‘special’ powers cuz he has a black/white chartfreak avatar…
Thats Right ! And I ain’t changing it either !!!
Not that I would know how to be honest…..:)….nor how it happened lol
I’m looking on stockcharts and $NATGAS above 50 and 100
nice drop in ugaz & uwti- both close to 50 sma..soon a dip buying trade anyone..Gold Miners been too difficult to trade lately:(
CLNE just reversed off of the 50sma. forming a tight wedge on the way down Is THIS finally it??
I own it and I like it ! 🙂
I just added a little more this morning in fact.
I may join you . I am about 1/2 cash right now & was waiting for OIL or NATGAS to bottom , but the set up looks rather low risk.
what a battle between nugt&dust 2 fill that gap.. getting alerts 4 both….ding ding ding
I know, no direction known at this point
FWIW:
Added REXX and PES to my energy basket.
SWN was stopped out.
I wasnt familiar with PES. I just looked it up. I like the way it surged off of the 20sma last run up and now is lightly dropping to the 50sma. The 50sma will also be a test of the High Volume Candle from the last run up. Those tests happen more often than I used to think.
Just picked up some BAS with a stop a bit under the 50DMA. Thinking about KEG here.
Bas sitting right on the 50sma and volume fairly light volume selling . That may work out well, it really ran nicely last time ( $5 to $10.50 since March lows)
Alex- please take a look at CLF. Selling done??
Thats a tough one, because it is rising (so far) on light volume. It MIGHT just be an oversold bounce. Re-capturing the 50sma is great, the 20sma could be a resistance as a 50% bounce, because it rode that as support on the way up. Support can turn to resistance in various ways. . See my attached chart.
It could be bought with a tightish stop at the 50sma.
Thanks! Probably will hold off on that one for now.
I know, I want it too, but that reversal candle at the lows was the best buy. There is a bullish view too, breaking the down trend line ,etc and It may just take off upside as it moves higher . I’m holding off too so far.
This could be your fake out in GOLD right here (see below). Break of the trend line then a reverse higher. Keep an eye on it. We might be at a bottom. Dollar?
Its not out of the question, because GOLD is on day 18 and we have seen lows as early as that. It also Could be a 1/2 cycle low, but its rather deep for that.
What I have noticed since Nov lows is that GOLDS movement has been consolidation / sideways, triangle, etc and throws off the cycle counts for those that reply on them. Many even go short and then this happens (basically nothing)
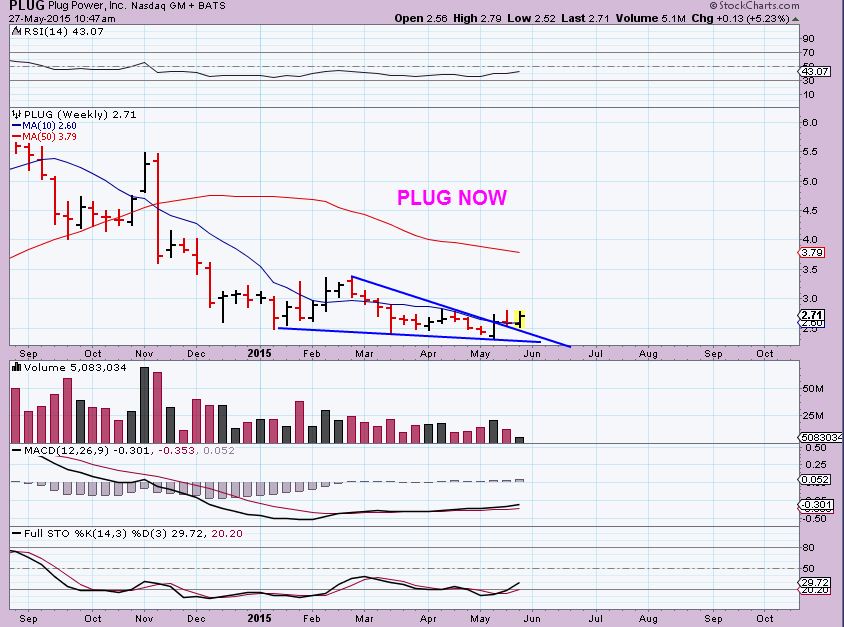
I think PLUG wants to fill that gap at the 50sma, and I blame BILL 🙂
Youre fine, still above the trend line. Looking good, but thanks for thinking of me! 🙂
Energy basket filling up.
Added; BAS, PEIX, OAS
Filling Energy Baskets? Brings up a good point all, what are the favorite stocks going forward? Why?
I do not have my list in front of me, BUT from memory …
REXX , BAS . REN looks great on a wkly and daily. BAS is slipping down a bit more than I like , but still ok and has almost recovered that 50sma. THAT is my line in the sand at this point, even if I have to wait until one recovers it.
Add RES and PES to that mix.
LGCY, BBEP and EXXI I liked in the first run , but now they just kept selling off below the 50sma , so they’re not on my list .
WRES and SD are so ugly
USO Calls anyone want to join me ? Short leash for sure !
USD rolling over into wave 2……fyi…..which “should” be positive for energy.
Thinking about it (see my post above)
Bought Some NUGT based on Three drive pattern (purple pattern lines). We’ll see how it works out. Should move up from here.
NICE Bill.. im watchn it also.. HOPING for 10.60.. will prob take 70s ;o)
Gap fill to $11.53 anyway. Did you get in?
no..not yet.. i “think” it is in minor wave 2 – correcting. 2 can correct up to 99% of 1-tho i do NOT think it will.. i am watching/waiting for it to show me a reversal & I will hop in for wave 3.. wooo hoo!! GL2U here is what i am watching ..(insert NOVICE disclaimer here ) ;o) ps. thinking 10.60-70s??
https://www.tradingview.com/x/JrOoSB0c/
Nice chart Maria
I’m not exactly sure if it’s correct, but it looks logical.
giggle.. I wont ‘cry’ if u say that is **&^% up ;o) ok welll .. maybe just a little .. but then I’ll just take one for the team & have some ice cream & feel all better …. ha!
Its E.W. , better than I can do & I would never critique ur hard work anyways.
…wellllll how will I ever learn then… my good man…??
ps. 1 can also extend to infinity.. which it apparently is???? omg too funny… ha ha
Don’t know much about Wave Theory, I’ll follow you’re lead.
.. gasp… red lights flashing…sirens going off in my ears….. 😕 i just threw that out there as something 2 think about … not follow..as u know,
… i ALWAYS defer to what Mighty King Master Chartfreak thinks….. ;o)
IMHNO (N is added for “novice”) u can see it better with DUST .. DUST is actually set up perfectly for both bull&bear right now.. BULL case for Dust- is that it is in ABC correction which is UP…if that is true it is now in A2 correcting-which can be up to 99% of A1- but it must not fall below the start of A1 – which is 11.10. If it does – thennn ..that is Bearish as it means it is an “extended wave 5” in which case it will follow the orange path down 3more waves to around 9ish. Hence… I wait… tick tock tick tock…..
https://www.tradingview.com/x/wFuSCv2L/
Nice chart, but if you see DUST correcting, why not jump in on NUGT?
Phew!! Had to do some bobin & weavin, but finished DUSTing. Ran into a couple vacuum cleaners in the process. Can’t take eyes off charts cause anything can happen these days. (Or any day for that matter! : )
REN at $1.28 looks great
I own it…so I’m keeping my eye on it. Looked so much prettier at $1.80 last week. lol
I lightened up ( just a little) when the second run higher had lighter volume than the first, so I am looking to add back in.
Check it out with the EMA 50. Interesting. I do love that weekly chart with the 10 WMA too, I just didnt want to drop all the way down there (50sma) , but it could so I am watching the 50sma or for a reversal first to add back in.
yes REN is beautifully sitting on its 50ema. (Which acted as support on May 12). I am also aware of the 10wma sitting at $1.16.
This is market is crazy… (as your post title is rightly named). UUP seems ready to give back a little, even though I think it can go higher before reversing. (see chart)
Yes, you can draw a trendline off of the 2 top peaks and be in that area. I was thinking along the same lines ( I know others are looking for a 1-2-3-4-5 up to new highs, but I havent felt that scenario as much as 5 waves up just finished and this ICL will eventually roll over.
i could definitely be wrong, I can see $1.20 dollar, I remember seeing it in the early 2000’s.
Thanks for posting, havent seen your name as much 🙂
with pleasure. I really enjoy your charts and analysis. Found you a few months back by chance on twitter.
Been a long time slope of hope member.
Another chart I like, the ratio GDX:GLD (see chart)
Ahh, Good ole twitter : ) Thanks for joining up.
And yes, I used that chart a lot in the past as more of a fast trader in the bull market run. Sometimes I used a solid line instead of candles and buy the trend line breaks, and sell too , in various time frames.
I didnt trade EVERY wiggle, but used it as a guide , also with the 8sma.
Kind of confusing, but see the upper box in this chart for an idea
.
LABOR AGREEMENT WITH STILL WATER MINING
Nice reaction SWC
$NATGAS is not looking good today. (while /CL is getting some vigor).
It needs to close at $2.75 tomorrow to keep the correction healthy…
And nice reversals in UCO / USO / UWTI
UWTI got in this morning $3.03 for a quick trip.
Nice,
On a 3 minute chart , I grabbed it at $3.10 on a break of the consolidation . I tried to get in earlier as it looked like it was set up, but it shot up as I bought.
MUX is looking solid at $0.97.
indeed.. saw that lil sucker myself this first thing this morning… greeeeeen. go muxie 🙂
I’ve mentioned MPO before (and own it). It’s breaking upward with the BBs now expanding from a very pinched condition, and it’s climbing right up the upper BB and staying overbought; all while oil has been taking a dip (and many other oil companies have been getting smacked).
Edit: changed “breaking up” to breaking upward, as the former doesn’t sound so great. 🙂
yes you have, and that looks very good . thanks
Actually I was thinking that it was probably one you mentioned, but I really can’t remember. BTW, look at HNR, and cry – with me. Unless you bought it recently, in which case I hate you 🙂
I saw it and cried 3 x already.
I also recommended RALY on here in Dec…traded it quickly check that out
Wow, yeah, that would make today a good day!
yes, I am scaling into some at the money calls on USO…although model suggests possible low point between 6-2 to 6-8 then up to 6-18 high……spy calls also on this weakness into 6-2 and top suggestion is 6-18 to 6-24. we’ll see. Thanks for all your help Alex.
what model are you referring to?
Thank you Shermo, for being here and even sharing your ideas.
Honestly I expected OIL $54 and I expected a bit of a faster drop into a daily cycle low , Boom Boom Boom… but its a nice reversal here, so I entered a position too. “Calls” should work well for you
Thank you. You have created a great trading site. Lots of smart people.
I would start scaling in long gold here for the next daily cycle but not against those commercials Will just wait and short the next expected daily top
I’m looking at USO June monthlies, will give you 3 weeks so you have some room. Coincides will next possible wave up.
Nice candle forming in oil. It’s flirting with the 57.61 level which is the 23.6% fib of the whole drop from 107.68 where the waterfall started. That bodes well if we can close above it.
38.2% is the more common turning spot!
Yeah, I know, but given the action I thought it worth noting. We’ll see!
I dont want to point out a stupid penny stock ( that I own ) as though I ‘m trying to push it up, I’m not and it could be considered risky here, but is that a bull Flag that GSS is just starting to move upward from? They couldnt push it into that gap while Gold was selling off? Hmmm.
I’ll bet you guys thought I was going to say a bull flag on BAA , using the 13 sma 🙂
I think they both look good here. Even if there is another gold stock sellout I think the ones like BAA and GSS that have gotten killed and now have good chart patterns will hold up relatively well.
Yeah that’s quite interesting. Launching off the 200 DMA and an important prior resistance in the .325 area. Hmmm
I didnt even see the 200sma. Interesting. I held off on adding further to my position due to that gap, now I can add and just use that as a stop for my recent purchase. Thx
I think I’m gonna nibble at that.
Golden Star (GSS) lottery ticket?
Like SWN here.
funny how they’re all running stops at the 50sma and recovering. Those programmed algorithms know where our stops are. Nice 50% re-trace on that one, from March lows to high.
funny… like funny weird.. or funny ha ha? (insert goodfellows clip here) ….actuallly, i can think of another choice word for that….grrrr
Funny like….somebody needs to pull the plug on those bad boyz
Bought UGAZ now at $2.08.
(riding the BB)
Well….just returned to the office ( lakeside ) 🙂 and looking pretty good.
Some follow thru tomorrow in Energy and PM’s would be nice.
Daily sell signal in the USD, some follow thru down tomorrow would also be nice….wave 2 down.
But…..Ya never know. Clearly defined risk for me.
If dollar fills gap near 96.18 or so may be next good long entry on UUP.
Transports are now in correction territory. Not a good sign. Going to be tricky for a while. Maybe cash would be King for a while. Just my opinion. (And Gut Feeling)
I’d like to see markets down, Commodities up : )
Is it ok to start a small position in oil -long today Alex? (leveraged etf)
Sorry, I went away and missed this. I would say its ok with the oil reversal. ( I did)
More a question than a statement. Someone said if UBER was in Transports the latter would not be down. Anyone any thoughts on the importance/relevance of this.
FDX is keeping it together while $TRAN has been dumped…
XLE retraced 50% since March bottom.
wow!
Looking at energy, pretty big late day reversal in WTI. My chart had WTI still a bit above 50 day but USO tagged the 50 day and dropped below lower BB before recovering. Natural gas continues to get beat. I have $NATGAS 1 cent below 50 day but with UNG well below and oversold a bit on multiple indicators.
Was today the jump back in oil day at end of Wave 4 we were waiting on or shake n’ bake before final wave 4 drop? Can natural gas recover now? Any more damage to that one and it’s game over.
Is anyone else looking at Alex’s GDX chart above and seeing a bear flag? See my chart attached (NUGT). So many variations, hard to predict. Point D isn’t deep enough, but you get the point.