
CHANGE
6:30 a.m. Eastern time : I collected most of the Charts for todays report last night. I thought to myself that like I wrote in the weekend report, it looks like we are seeing some Big Picture changes lately. I awoke this morning to Futures down quite a bit and that makes the charts you are bout to see all the more interesting. We all know that when you wake up to Futures down, the day can reverse and still close green and visa versa, but take a look at where we are , and you’ll see that things look quite interesting.
I like to start with the previous days chart, so here is the Nasdaq from Tuesday. Breaking down?
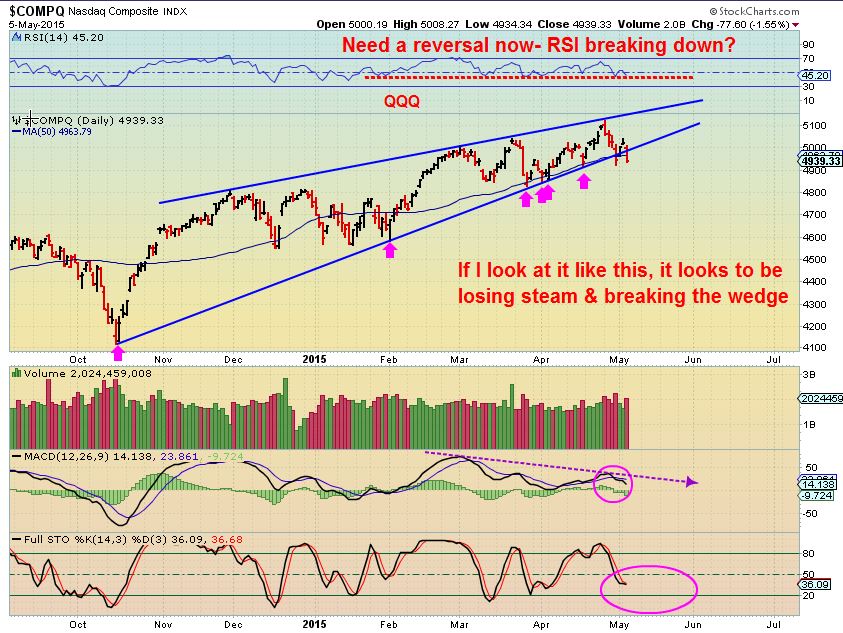
SO what happened Wednesday? Oh yes, it wasnt a FED WEDNESDAY, but The Fed did say something in an interview that shook the markets a bit more…
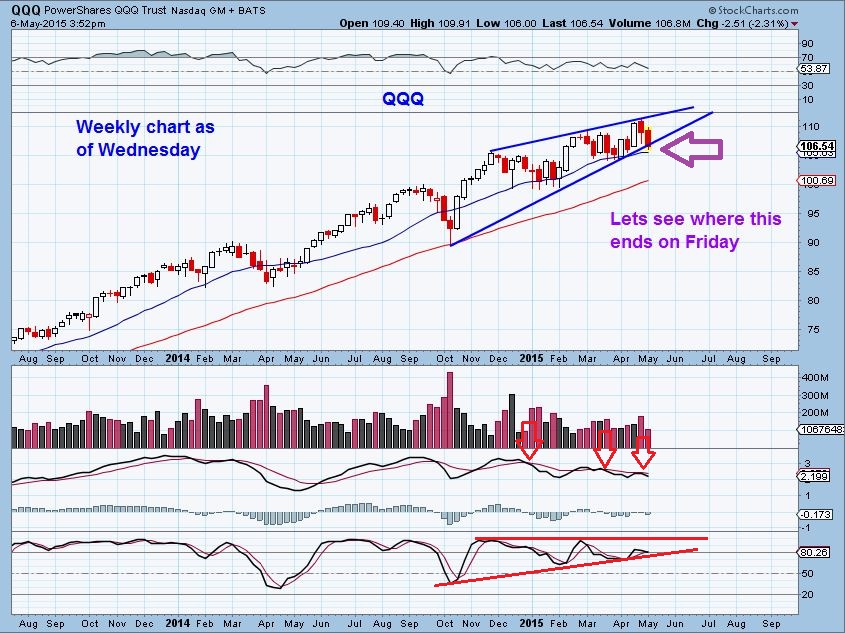
NASDAQ (QQQ WKLY) Wednesday – futures are down -33 as I write and if we dont reverse higher by Fridays close , we close below the wedge
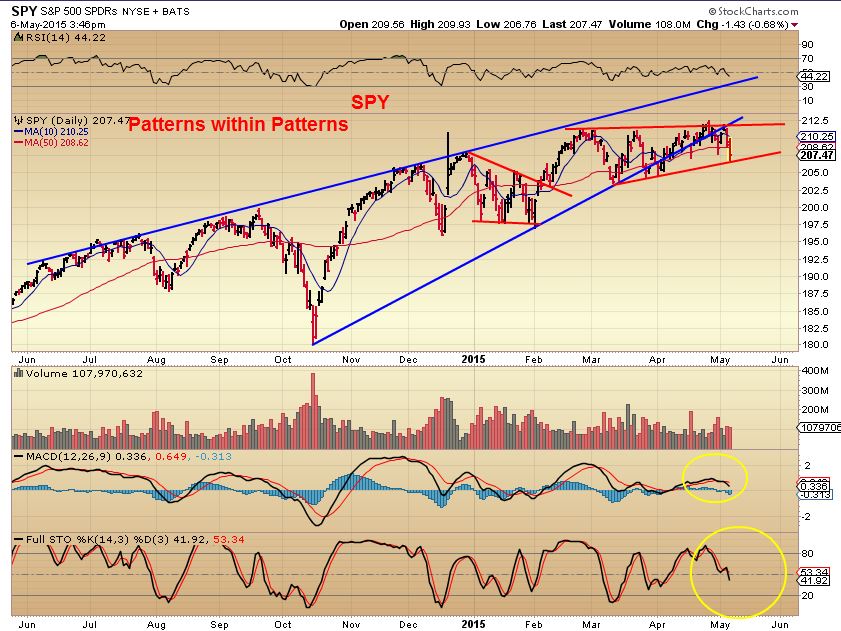
SPX – This is a pattern within a pattern, but it clearly shows where the SPX was as of yesterday. The futures are down -12.
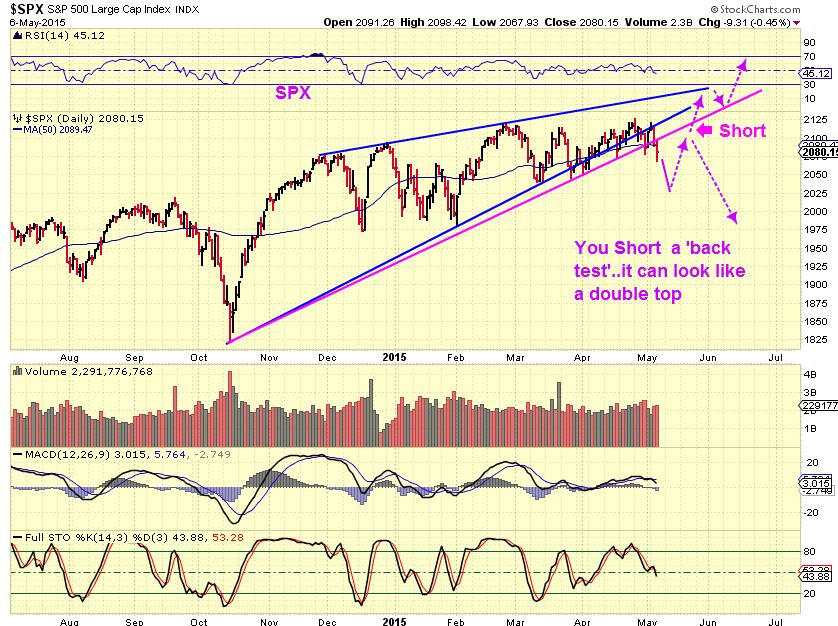
This is the tough part for those hungry to short the markets. It is possible for a waterfall plunge to happen here, but the safest short is to watch it play out. Usually you get a break down and a back test. THAT is the short if it is acting correctly. It looks like this…
SPX SHORT- with a tight stop in case it breaks higher
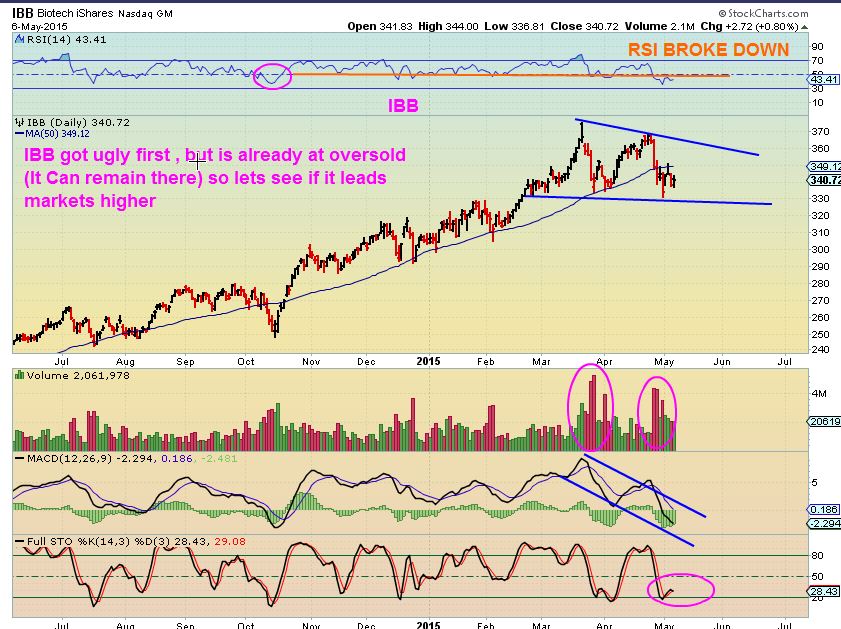
IBB– I see some change there. The big sell off in OCT was the last time the RSI broke down & stayed down. It has changed again
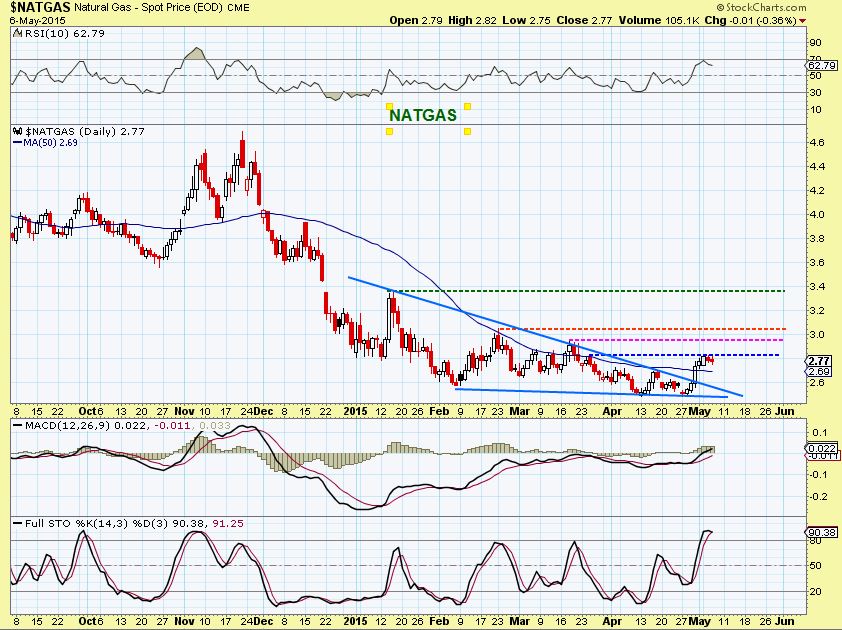
NATGAS– The big CHANGE here is that it’s not selling off. We caught the bottom here, expecting this beak out . It has now paused, but I expect higher prices
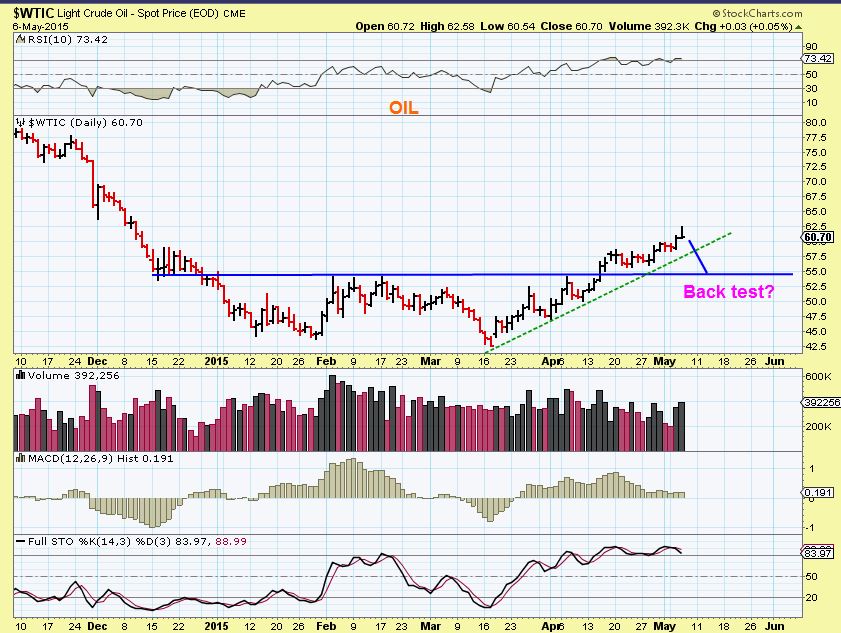
Oil continued its climb- but reversed and looked like a topping candle ? JUST A TEMPORARY TOP or sideways move again, I think OIL is fine.
I like to try to find things that maybe you haven’t seen or noticed before. It will take time to see if what I am about to show you is going to lead to any change or possibly be relevant to future moves.
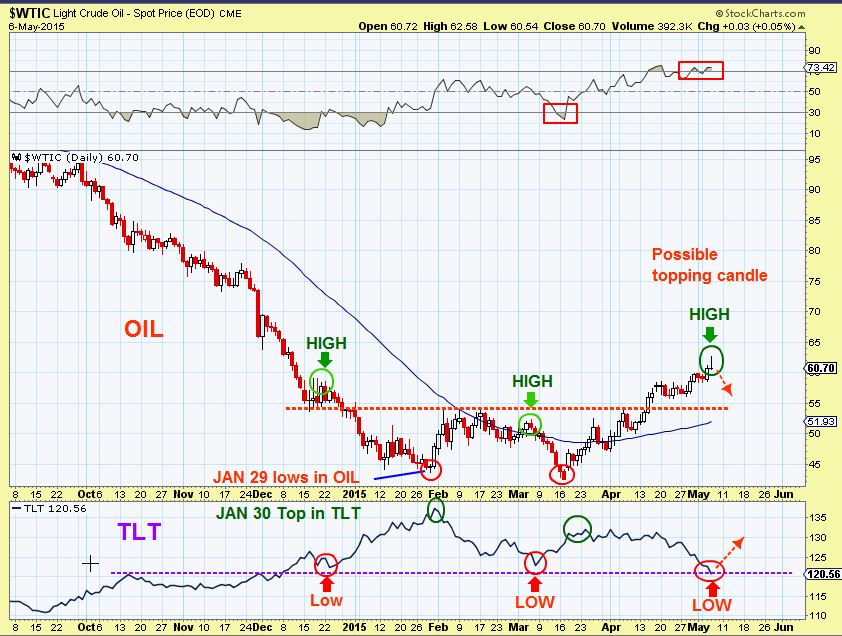
BONDS have also been selling off, but notice what I am looking at. CAN YOU SEE IT?
OIL & the BONDS have acting rather inversely. SO I ask myself…
“If oil is about to pullback or go sideways , are bonds about to bounce??”
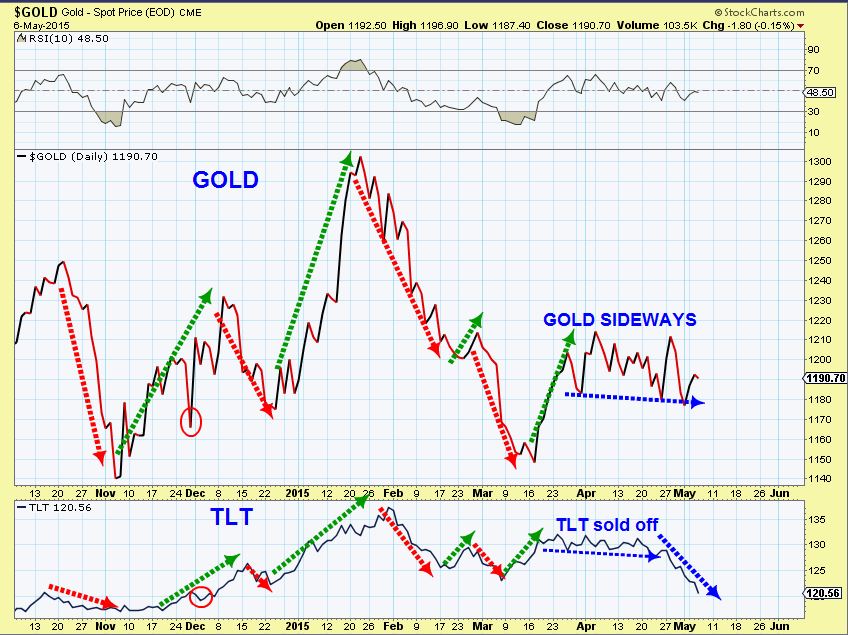
I also have been noticing that GOLD and the BONDS were acting in similar fashion, until the past couple of weeks. So If the BONDS are about to bounce…It seems to indicate that GOLD might be ready to go higher . See if you follow this-
1. Gold and TLT made highs at similar times ( Green circles 1,3,5,6,8) and sold off to lows at similar times (RED circles 2,4,7).
2. #8 shows that they both went sideways and the TLT sold off fast to oversold in the past 2 weeks (9). In the last 2 weeks, however, Gold did Not sell off . Gold held up. Is Money moving into Gold? And if the TLT bounces now , might Gold POP with it, since it has held up better? We’ll have to see on that one.

Here is a clearer look at that relationship
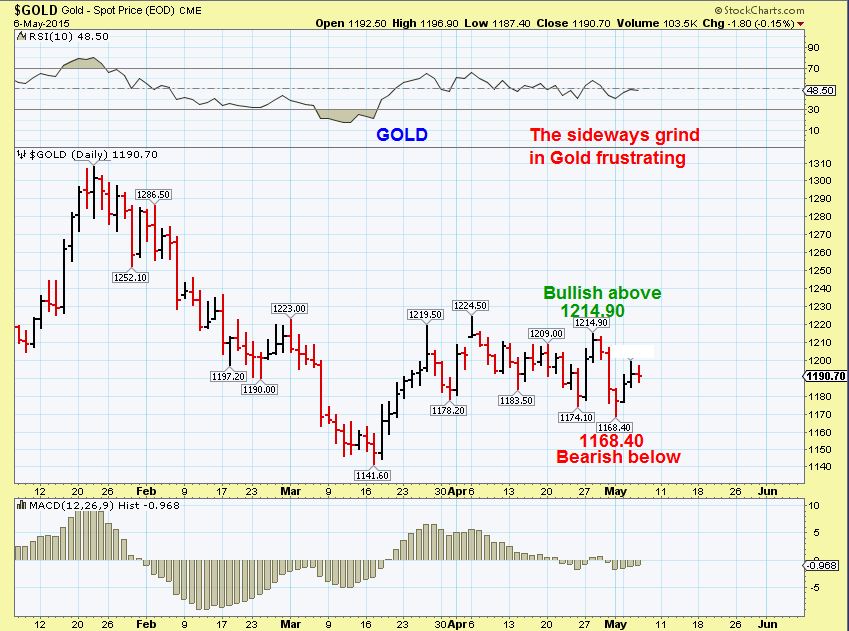
GOLD – I am looking at 2 price areas for the next move , since Gold is acting neutral to sideways. Is it weak and ready to drop, or ready to pop? Time will tell.
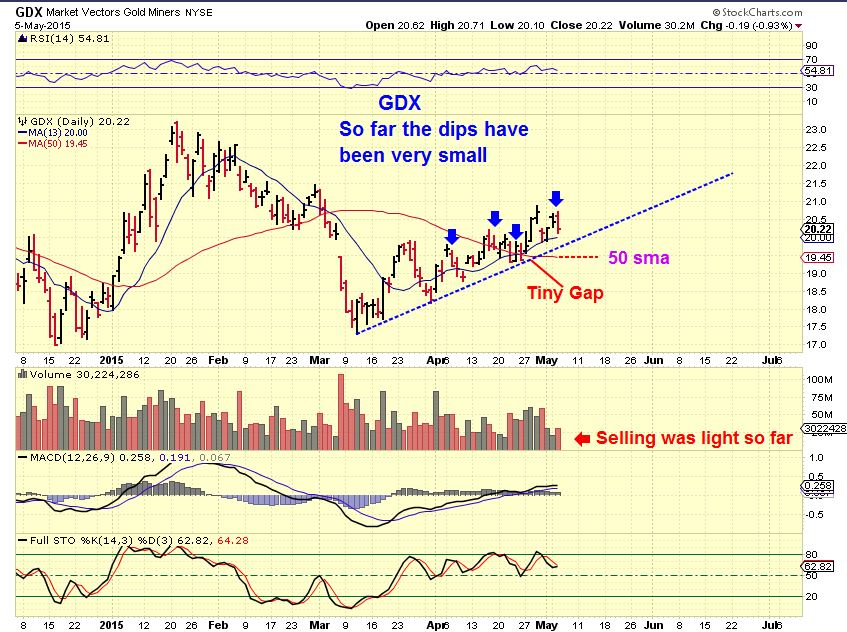
Though GOLD is just spinning its wheels a bit, the Miners have been stronger in a mini uptrend ( See the weekend report for GDX:GLD, etc ) . I want to re-post the chart for GDX as of Tuesday first. See the 50sma is below the trend-line. GDX can go there and reverse and I would personally love that. The trend-line break will shake out longs.
GDX Now- this shows a different cycle count. A friend of mine known as ‘Likesmoney’ has pointed it out and he has valid reason to look at it this way. That would indicate that a DCL is due and we had 2 right translated cycles. I would not buy a close below the 50sma . THAT needs to recover first. GDX futures are currently right on the 50sma. Interesting .
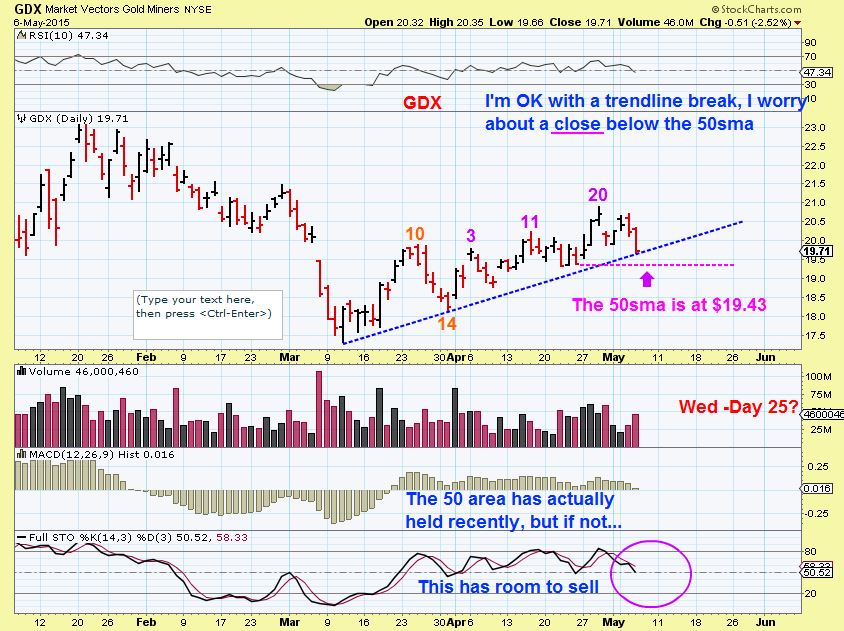
So for Miners : A low risk entry would be to buy that drop near the 50sma with a stop closely below that 50sma ( $19.43 is the 50 sma) . A Tag of the 50sma and a reverse back above that trend line could be bought too. GDX is in an uptrend so far. Take a look at TRQ, LSG, EGI, BAA…these are bullish. TRQ is extended, not buy, I am just pointing out what is happening behind the scenes in some of these miners. This also means you may want to trade/ buy the Miners you like if you see any good set ups ( CDE, EXK, etc). And for Experienced Traders in front of the screen– you can try JNUG NUGT, but these move fast, its a quick trade for the experienced only! I will not monitor your leveraged positions…have a plan and stick to it please.
.
SO I usually dont have a Friday report if Thursdays report plays out as expected. You often just get similar follow through on Friday , and I can cover it all in the weekend report. This Friday I may post a follow up if we get any big changes. If at the end of today, the markets pretty much still reflect what is mentioned in this report, then I will just cover every thing in the weekend report. Please check the comments section under my reports too. As the day goes by we sometimes mention various things as they play out and become clearer.
As I was writing this report, the futures recovered greatly, but again the Theme of this report was “Change”. Things can change fast so on days like these…you have to honor your stops and Stay Frosty ! 


Looking at the 2 charts in the report of GOLDS price points of interest and GDX 50sma, we see that GOLD dropped on the jobs report to 1180. That is fine so far. GDX pre-market dropped to the 50sma.
Conservative Ones may want to wait & see what Gold/GDX do going forward, because you know how these things can unravel rapidly. According to the GDX chart, it also may be a DCL.
UP in Pre-Mkt GEVO, SUNE, BABA,
DOWN GMCR, WFM, PCLN ,TSLA
If there is anything to Harmonics and Fib levels, GDX would seem to indicate a reversal here. A perfect Gartley would have B (the middle) at .618 and D (the end) at .786. We went to .672 at B and are at D=.786 currently? Refresh for chart.
There is a lower trend line that would seem the logical reverse point (purple lines). Premarket sales would indicate thats where we are headed.
The futures show GDX opening in the $19.40’s area. Your chart doesnt include that on your perfect gartley. It only has a drop to $19.70 to make it work. Does that invalidate it ?
The Gartely is the only Harmonic that has D at 786. Most other patterns go to 886. The purple lower trend line would be around 886. BUT the patterns at 886 don’t go as deep as 618 at the center B. The other choices are CRAB and BEAR which have a much deeper draw down, 1.27 to 1.618.
Yeah, price is actually sitting right between the 2 purple trend lines now . Thanks
$19.40s would be the lower trend line I mentioned it above.
Bounced right off it. Think I’ll try some NUGT here.
I added a little but the hazy cycle count and so on has me keeping it small. I like that the miners are right translated and basically trending higher. Just a little suspect with GOLD itself here.
neat..tx 4 sharing
i drew this last nite.. w a buy at 10.74ish…hmmm https://www.tradingview.com/x/ykplXb7i/
Thanks
Sitting in some cash now, stopped out of EXXI yesterday. Youre thinking Miners (GDX) may be the next uptrend to catch (from the above report). A break below the 50ma and the above would be the BUY. Got it.
No, I dont want a break below the 50sma really , unless it recovers and closes back above. In that last chart I wrote that I do not want to see a close below the 50sma .
SZYM dropped to that gap yesterday, reversed higher and look like it may recover from here
fyi…im watching this… https://www.tradingview.com/x/d8Ge9WWZ/
SZYM hit the 10sma today and rolled right back down. I thought that it Looked like it really wanted to fill that gap at the 50sma , but the gap may hold as support and allow the 50 to rise to price.
Your chart shows that it wont break yesterdays lows on this ‘b’ drop ? or is that a rough idea & it may break it ? Thanks – It just reversed right above yesterdays lows : )
It’s lost both its 10DMA and 20DMA. Looks like a test of the 50DMA is in store. The way this one moves that might happen sooner rather than later, or might have already happened as I am writing this.
LOL- I went from the 13 sma on the steeper climb, to the 20sma. Now I use the 34 sma ( it broke it 1x in the March 18 area and reversed higher). The 50sma is right there so why not stop by and tag that too : )
I still like the 6 month chart on this one
Yeah, it can go to 3.00 and not be in too bad shape, preferably not straight down though. Of course if it holds the trendline and pivot right here that would be optimum at this point.
SFY – OUCH Yes I held thru earnings; stopped out at 2.395. Ah well, that’s why position sized is important. My basis was 2.52 so a 5% loss. Not so bad.
Yeah, I didnt read the report, but thats a pretty big gap down below the 50sma. Best to just walk away and let it re-group.
Yep, you can’t win them all. And you probably won’t win most. Ride the winners, cut the losers.(easier said than done, for sure)
Had a small position. Sold half yesterday. The rest this morning at $2.39. Not a good day for energy so far.
Yeah, it’s kinda gotten ugly in a lot of these names.
Stopped out of my last solar SOL this morning.
Yeah, I’m out of TSL
This has not gone as planned! 🙂
Solars too.
GDX needs GG to start getting healthy. Kind of ugly over the last couple weeks.
True…Maybe a triple bottom here today : )
Nice move by SLV ( SO FAR) , using the 10 & 50sma. Bounced right off of both & moved higher ( SO FAR) .
I have to allow the first hour of trading to pass before i start trusting numbers a bit more – LOL
My 2 bright spots this AM are AMCC and NBG (which has bounced nicely from a retest of the 20 & 50 and now is at the 100 DMA again where it has “failed” twice; interesting juncture here)
Careful with AMCC. looks like a harmonic pattern forming, could go low $5
I honestly have no idea how useful such things are. I keep it much simpler: pivots, MAs, vol, and such. And AMCC looks real good right now, nice base and breaking out on good vol.
Well CLNE has lost its Superman cape. 🙂 Maybe the 20 DMA for support? Or the 7.50 pivot. That might be a good spot to take a shot at it.
Yeah still holding. Will likely get out if the 20DMA doesn’t hold. I am a little worried if the broad market doesn’t hold up in the near future.
20DMA at $7.98 now. Hopefully that will be support. Otherwise down to the 50DMA and 200DMA
No hard bearish follow thru by EWZ today. If it holds 36 it’s looking pretty good still.
PPP – Earnings out. Record production, positive reaction.
HL very positive, I agree with the positives on miners, but tomorrow NFP can change everything. I got a few positions on HL, LSG, NEM and a few minors. May trim at the end of the day. For once though I would like to see the NFP give a boost to the miners as it has not been the case in the recent past.
Well, that’s interesting: NATGAS Now to see what it does with this report longer term (i.e. more than 15 min or so)
Yesterday’s oil short position working out fine so far..Thanks for the advanced reports:) hmmm now NG is pulling back
NADL and HERO getting whacked as well. RIG had blowout earnings but want to cut their dividend way back and I guess their conference call didn’t go so well so that is down too. Natural gas was my lone bright spot but then the inventory report came out. :((
HERO now 10 cents off its lows. Missed it.
Yeah, nice reversal. At least something’s going right. 🙂
OK, now the miners are getting ugly.
Interesting though that some micros are holding up here, like BAA, XRA, VGZ
I have been adding to BAA on every dip, thats why it doesnt drop : )
https://pbs.twimg.com/media/CEVMJqcUUAA_Qh_.png:large
Bonds have tended to rise when TLT reationship with 3-7yrs is as now
Thanks JD! They do look set to rise or at least bounce
I agree JD.
I have been building a position in IIM since last Friday, just added another 20% to the position a few minutes ago.
OUT of LGCY with 1/2 my profits.
And Alex….. I bought some yesterday.
GDX…. did you see the GAP at 19.00 dollars Alex?
Yes, If you look back at the 2008 lows, there were 3 or 4 small gaps on the way up that never got filled (until the drop last year ). So I stay aware of them, but so far the 50sma is holding up ( SO FAR)
Anyone own GEVO? or GURE? : ) Me either. AMRS l& ZBB looking interesting again
Yeah, I’ve been looking at ZBB this AM; nice relative strength with so many other oil names getting slapped.
That was once nasty chart to be buying in GEVO! Must be a huge short squeeze!
Big news with Alaska Airlines deal. Guess all the shorts bailed.
MCP went back and filled that big gap. What now? Could be a decent entry pt here. Always signficant risk there, of course.
Slapped on earnings today. Another 100 million down the tubes. Went from 90 cents to 53 cents over last two days. I’m holding REE and AVL which have been going down on light volume since they issued some bought offering. Those are a little more stable as far as price variations go.
I’m taking a lottery ticket position here at .57
How much room are you giving it?
Well, it’s lottery sized so I think I’ll give it all the way to .32, the Mar low. It’ll probably go to .30 now and reverse sharply! I may give it room to there. What the hell, what’s another .02, right?
Good luck! Hopefully won’t go that low.
We’ll hit a bottom in rare earths someday, right? 🙂
Nice entry there!
Yep, so far so good! It’s fun, even if it’s a small position.
Problem lately is that I’ve had some really good trades but also too many painful stop outs. I’m going to take another look at those and see if there’s something to be learned. Maybe more waiting for end of day price.
VALE is back at its 10DMA that it’s been riding on its upmove. Would normally take a shot at it here but a little gun shy after seeing what’s happened to CLNE and SZYM.
GSS a little interesting looking off the recent lows . Earnings release & news on a royal Gold deal
ENERGY stocks starting to recover here. SFY, PACD, WRES beaten like dogs. May be great buying opportunity.
I’ll add a few interesting ones OAS, ZBB, AT, TPLM ,HERO, AMRS, VTG? , CBAK? (GEVO…woohoo)
GDP double bottom?
Quite reversal in RIC. Many others holding strong as well. FNV for example.
I saw that too, been watching RIC, LSG, TRQ
SWC surged yesterday and sold off today, but that was the buy. Nice reversal higher agaoin.
Also seeing some Silver stocks green ( HL, EXK, PAAS, SSRI just tagged the 50sma and is almost green),
The weeklies on LSG, RIC, FNV, KDX, SMF (all TSX tickers) and a few others are incredible. They’ve all been in bulls now for over a year. These are the buy and holds, if a guy can get in at the bottom of a channel.
Yes, RIC , FNV , KDX.TO SMF.TO RGLD, & LSG could have been bought in 2013 (but who knew then) .
UGAZ 28.2% retracement from the lows. Probably will hold at $2.21 and reverse.
That would roughly coincide with the 2.70 pivot on NATGAS, so I’d agree. If not it might get pretty ugly.
Bought CLNE here. Down 20%
Looks like good timing. Nice turnaround today.
What does this pull back in NG say Alex? Is it broken?
No, its not broken at all. Look back at the chart of OIL in the report above …it had solid pullbacks too. All healthy markets will have pullbacks along the way. Todays drop in NATGAS is nothing at this point.
NATGAS just ran from $2.47 to $2.82, its at $2.73. Go look at a 1 month $Natgas chart , $2.73 is barley a drop
I agree, but I’m glad to see it’s causing some concern out there (not aimed at Ash, but I’ve seen others on Twitter, etc.)
ha ha yes.troy..i see on ST &Twitter too..many call it short..i am lazy to do it all over again.i got in at 1.80s and if i sell i will have to work hard to buy back-& i have no energy to chase down to renter 🙂
Yeah, trying to dodge all the pull backs is most often a fool’s errand (or worse, trying to short them). And if you get lucky it just emboldens you and eventually you get in trouble (or miss the larger move up).
Yeah, decided to just wait,for next long entry instead of trying to short the pullback.
ok,thanks Alex..feels much better:) & i took a short position in oil via Leveraged etf..are we still looking at 55 pull back/test. i got in for a short term PB window (1-2 days max)
The OIL pullback could get that far and test the break out, but it has been a strong run and may only dip slightly and go sideways it if continues strong. Its tough to tell at this point. It may only drop to the top of the last sideways move near $57.
If you look at the oil chart in the above report and draw a trend-line from the lows, ti also hits that area.
I got stopped out on ugaz ..totally forgot I had a stop set @2 .20. 🙁 Chk don’t follow NG trend anymore ? Or was that the ER Effect + today’s PB..Alex. Thanks.
Sorry I meant 2.26 !! Hmm sigh .
Correlation between CHK & NATGAS is all over the place: http://schrts.co/97Okal
And this is 50 day correlation: http://schrts.co/sfYoKq
I sold UGAZ a few days ago, I figured it went up too fast. Damn, now look at it. Should have bought at the 38.2% retrace, thats a big reverse point.
Personally I don’t believe 3x ETF’s can be charted reliably.I chart the underlying stock/commodity and,go by that.
Now we find out if TLT is serious about going up for a while. Back tested the 200 DMA and the 122 pivot. and yesterday’s high. I could see it going down just a bit more to a new low around 118 before a more serious bounce to back test the 200 DMA/122 again. But that’s really speculative.
We have a reversal (So far) in GDX at the 50sma, but it doesnt feel real. On a 10 day / 30 minute chart it looks like a bear flag too. AND if we are dropping to a DCL, we have seen how you can get 2 or 3 big down days in a row (See March 23-30 for example on the GDX chart in the report above )
There is a gap open that shows at 18 on that chart too (Doesnt show on candles stick).
just thinking out loud, but its hard to trust this reversal, I like the fast sell off and quick recovery to leave people behind.
There hasn’t been any real convincing movement in the miners in a while. Im waiting to see what happens. Some of the energy stocks starting to recover. CLNE looks good. SFY not so much.
I agree, no real burst of short covering ,followed by buying. I like to see that kind of move. In fact, I just looked at the day of APRIL 9…kind of looks like today and it gapped open higher then next day.
I’m looking at SZYM too (It kind of looks like a last engulfing , might depend on how it closes).
On miners, each Bear Market Rally has been sharp every 6 months. This one is slow, what does this change of character represent? A slow change to uptrend or a lower high before the final waterfall? This has not been conducive to simple options, so going to change my game plan.
GDX Chart with trend lines
Recovered that 1st purple.
I don’t know if we will get a true move in the gold/silver stocks until the stock market truly breaks down.
Carl, I’ve been saying that for months, man. I’m with you there.
I have that same feeling but…..I am going to hold for atleast another day.
I have Calls on GG, SLW PAAS, and SSRI…..my stops are below todays low or below a Trend Line. Risk ratio very good imho. 🙂 Well….. GG not so much acting like a very bad dog.
Things changed after I wrote that… I needed to see GG improve and it did a complete reversal along with ABX, so that can help run GDX.
Some may have shorted that ‘break down” . I liked the close : )
I am back in EXK but we have NFP tomorrow so a Crap shoot on that. I did like the reversal at close today. NUGT was a good short early week but was ST oversold this morning, so good place to cover.
Anyone buy YELP on my recommendation this Last night ??
.
.
.
J/K- LOL
giggle…
I still see REXX as an inverse H&S , Look at it on a 5 month chart and use only the 10sma
So far it looks like GG reversed and decided to stop holding things back
Impressive reversal in GDX, for sure. Shook me out a bit. I’m sticking a toe back in here, but not greatly encouraged, especially with gold still looking sick.
FWIW … watching this https://www.tradingview.com/x/qDETZp6x/ while listening to this … https://youtu.be/fJ9rUzIMcZQ … lol
Good to know and Nice chart. 🙂
i should probably add …. im also watching this as a possible too. FYI
https://www.tradingview.com/x/tlDIrFOr/
Wait, this chart does the opposite of the last one that you posted above Queen, doesnt it? This shows a good size drop in NUGT, the other showed a rise? SO is this 2 possible actions, a bullish and a Bearish? I get that at times, and if so…which one are you leaning too? Thx
yes…,my apologies for the confusion…. that is the problem – I find the wave counts often change as more data presents annnd i wasnt able to study the chart until after close [darn work] which is when i found the 1-5 zigzag pattern of B emerging [with a little help from a friend] ;o) B can be 3 or 5– at first it looked like it completed B with a 3zigzag and was already in C1 – ready to pop… which was my first ‘bullish’ scenerio. After close, i saw the possible B 5zigzag with one more zag down for a trip down to 10.60ish before a screaming ride up to 16.80s. I am ‘kind of’ leaning toward the 5 now ….actually i believe volume & stoch support that theory more [using hrly&30 min chart] so I pulled my buy order which was originally 11.40s & I am in wait and see mode now. It could ‘technically’ do either but personally I’d rather hop in on pbk than go underwater waiting for bounce. I am still BULLISH, it’s just that now i see two scenarios that could play out. Here would be my possible path if it does one more zag down… https://www.tradingview.com/x/cYB4caHN/
Which could mean hop in 10.60s & ride it until 16.80s … [or daytrade it] .. remember, I am a novice and these are just the possible counts I see & i am ‘watching’ these not using them as my Bible. I just wanted to post for fyi sake and of course for feedback/discussion/learning ;o)
I don’t know if that helps but I thought i should at least post the 2nd scenario just in case someone actually was following along… lol
Happy Mother’s Day to any ‘lurking’ Mothers out there…. :o)
MPO getting schwacked now.
Hey Alex, Noted that GDXJ also a bit lacking c/w GDX..hard to compare on day to day but generally I would think this higher if we were getting ready for the next move up. Thoughts?
I like what I see.. for GDX GG did a stop run type reveral.
.Look at PAAS 3month chart, EXK, even baby TRX RIC , LSG…I like it
Still a lower low on GDX!
cursing a bit when stopped out of a lot of the energy stock 2 days ago only to see them move up the following day. And here we are today…stops really do manage the emotions well. Thx for the continuous reminder Alex.
Yes, I agree…what a difference a day makes.
Just my 2 cents worth on USO (WTIC),……
I think we have completed wave 3 up of major 1. Now will be working on a A B C wave 4 correction I will be reloading on energy stocks again at those lows for the final wave 5 of major 1.
Here is my chart if interested.
Ken, how long does wave 4 usually last? Expectations?
was going to buy another tranche of natgas post market…then “pop” another good plan up in smoke! 🙁
Me too. Was going to double up on any decline. Oh well.
Perfect, beautiful bounce off the 2.70ish pivot by NATGAS.
And that’s why you advised folks not to go short here. 🙂 Alex, the gold:bond ratio was pure wizardry. Thanks for that piece, market had me thoroughly confused there for a bit.
Good Morning Alex,
When you can find a bit of time please look at SGG (Sugar) and WEAT (Wheat) please.
I would like a fresh set of eyes on these two. Thanks!
Yes, they look good. Sorry I wasnt around today .
Yesterday I mentioned the activity in GSS. I mentioned in comments near the bottom of this page. I took a couple lottery ticket in BAA, GSS, and VTG and added to my REXX . yesterday that ll worked out pretty good. Still holding.
Many Energy reversed and looked good today . NATGAS too.
AND DID YOU SEE THE HUBS CHART THAT I PUT IN THE WEEKEND REPORT. I did NOT buy that one 🙁
Boom! Goes the Dynamite!!