Are There Storms On The Horizon?
As I have discussed in previous reports, I am seeing some really bullish set ups in some Sectors, and some interesting moves in other sectors, but still I have to wonder if there could be future storms rolling in within the equity markets? Lets look at some charts…
The NASDAQ re-gained the 50sma, but is still weakish. Look at that MACD. We need a burst higher soon.
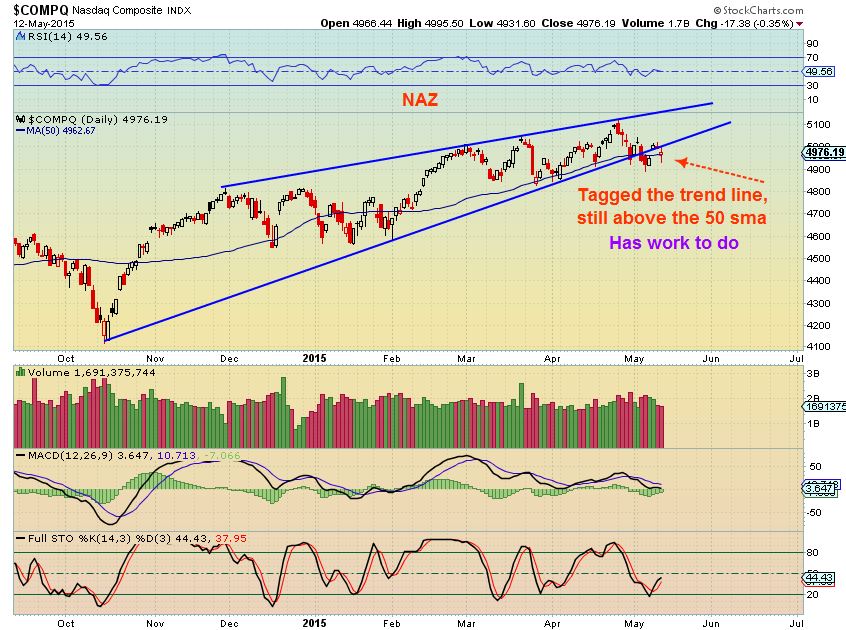
Lets look at the SPX…
SPX actually looks a little healthier, reversing off of the 50sma
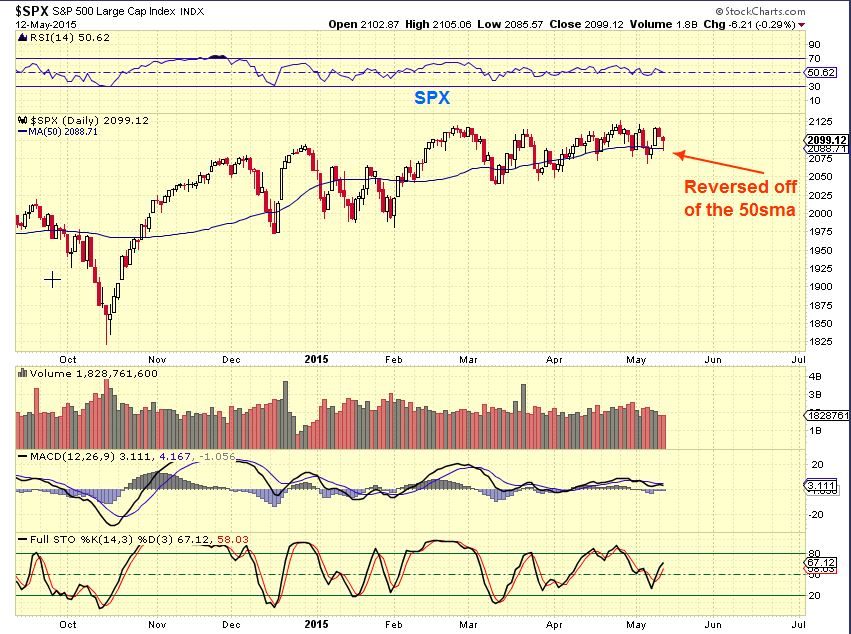
The IBB actually looks to be improving recently
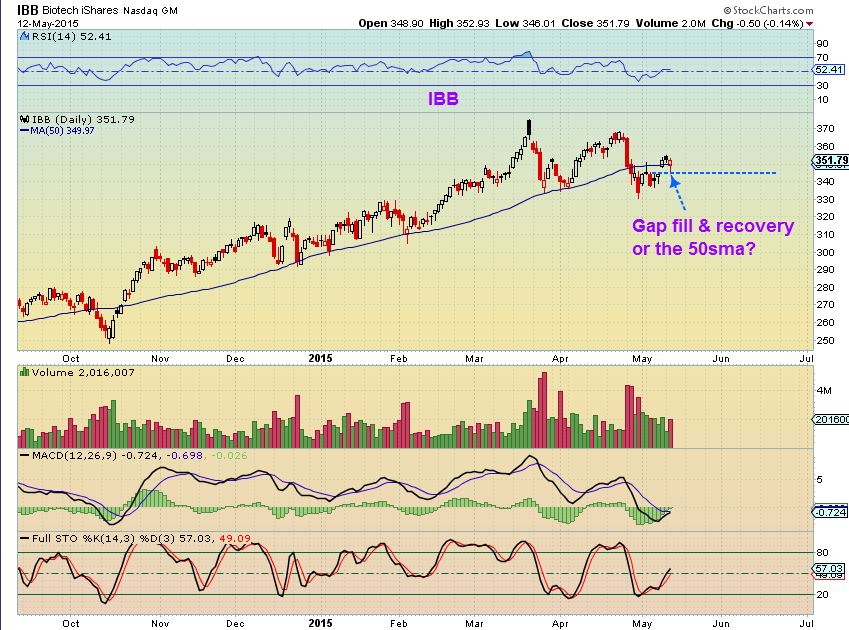
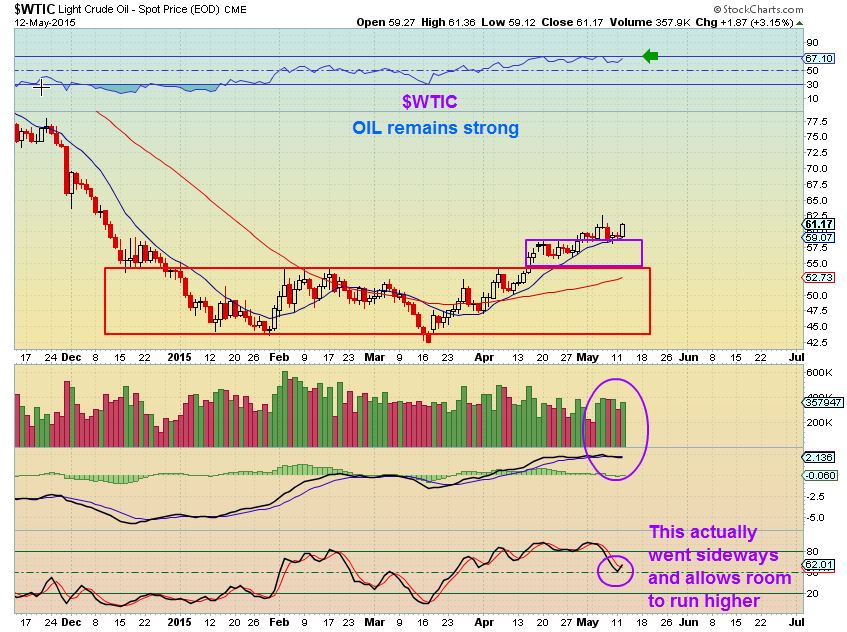
Of course we have favored $WTIC. No storms here, It remains strong .
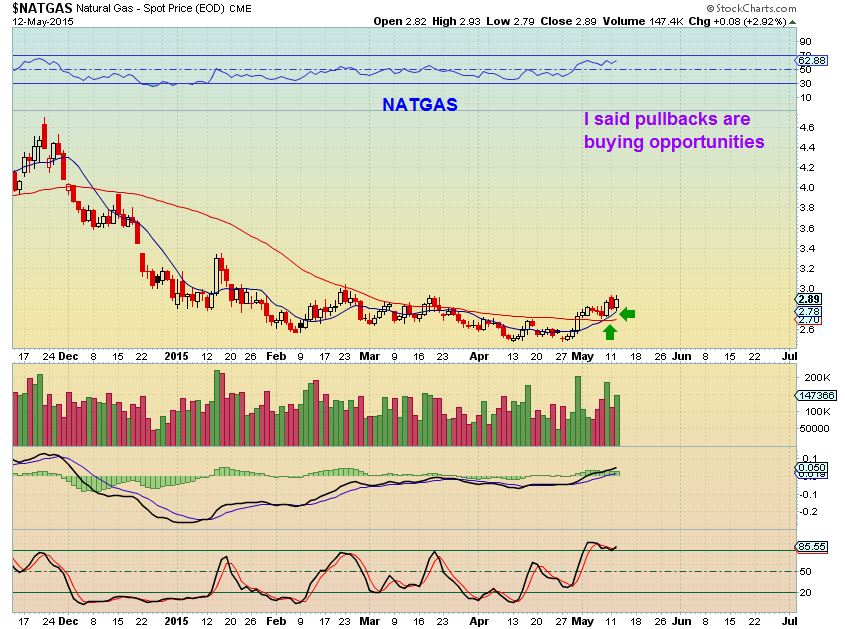
And no storms here with NATGAS – I mentioned that early in its move off of the bottom, pullbacks are buying opportunities.
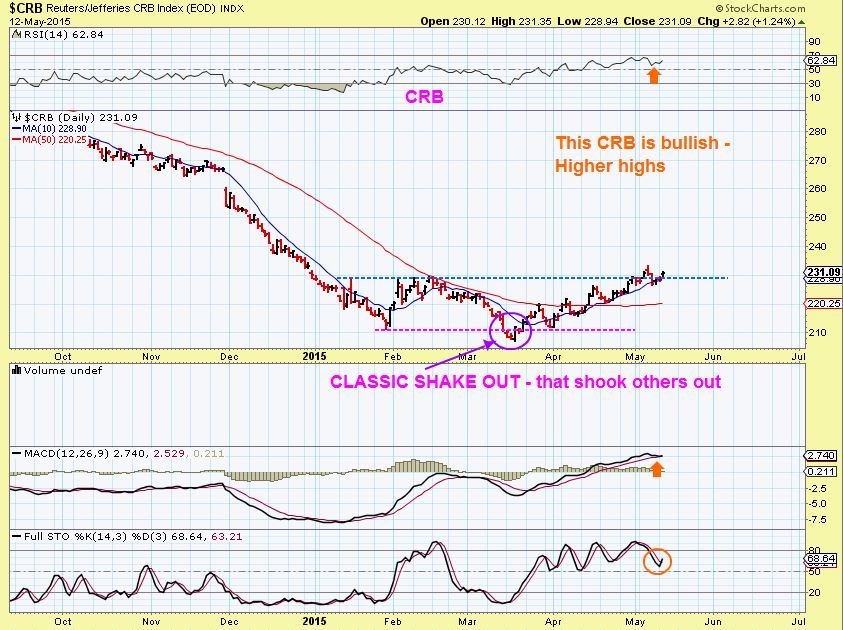
$CRB- I pointed out the double bottom shake out & have said that Commodities look Bullish. Now we see higher highs.
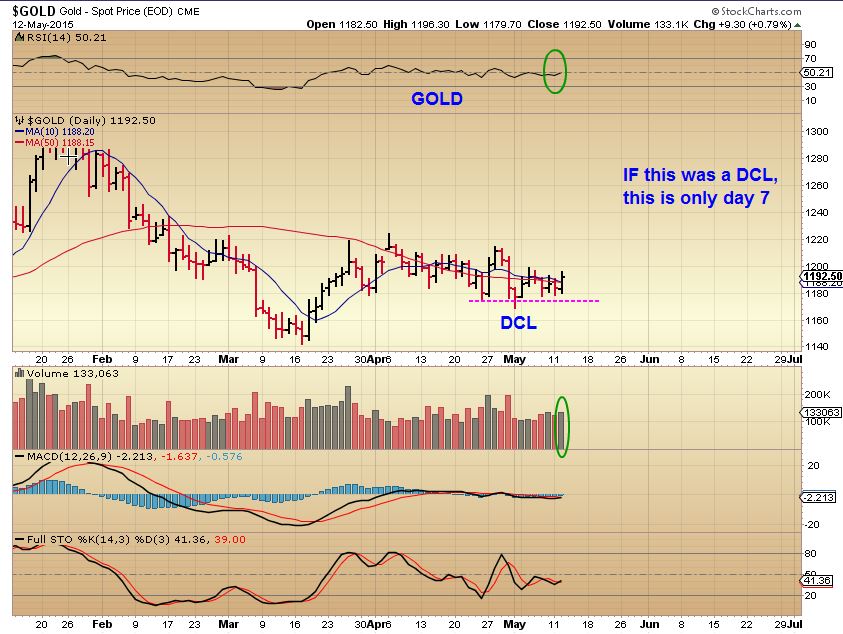
GOLD is in a triangle, and that will BORE people to death. Cause them to be afraid of the unknown. It is not BEARISH or BULLISH here, it is neutral In my opinion, but looks like it wants to break higher. It has resisted selling off so far, are we on day 7?
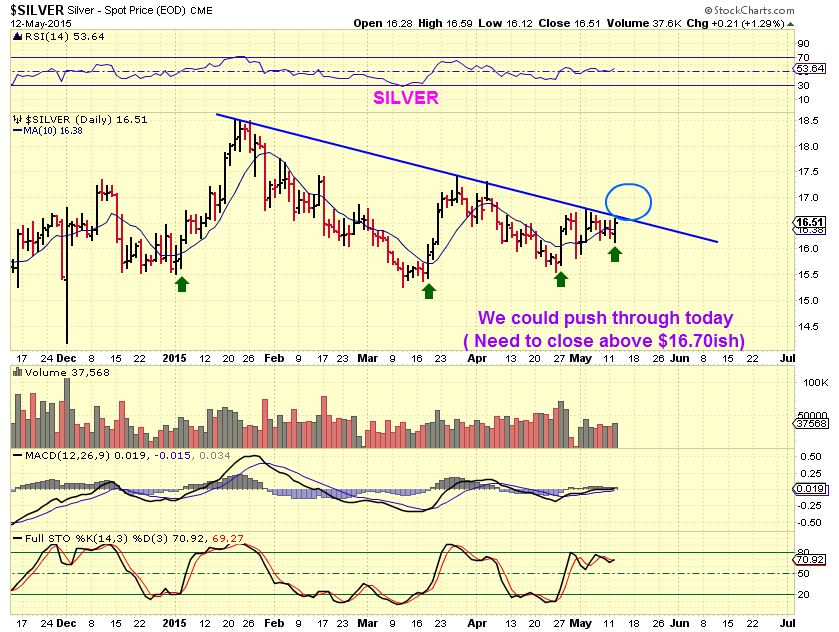
SILVER actually looks Bullish so far, it is not backing down . I’d love to see a close above the $16.70’s
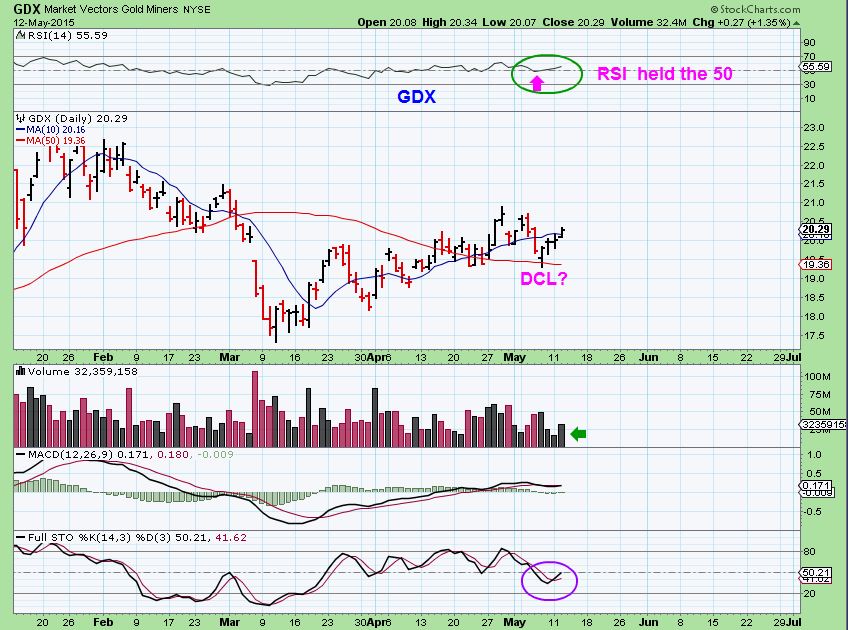
SO I look to the MINERS and what do I see? I see MANY miners acting stealthily Bullish.
Have you seen Juniors like GSS, EGI, LSG, TRQ, RIC , etc etc ?
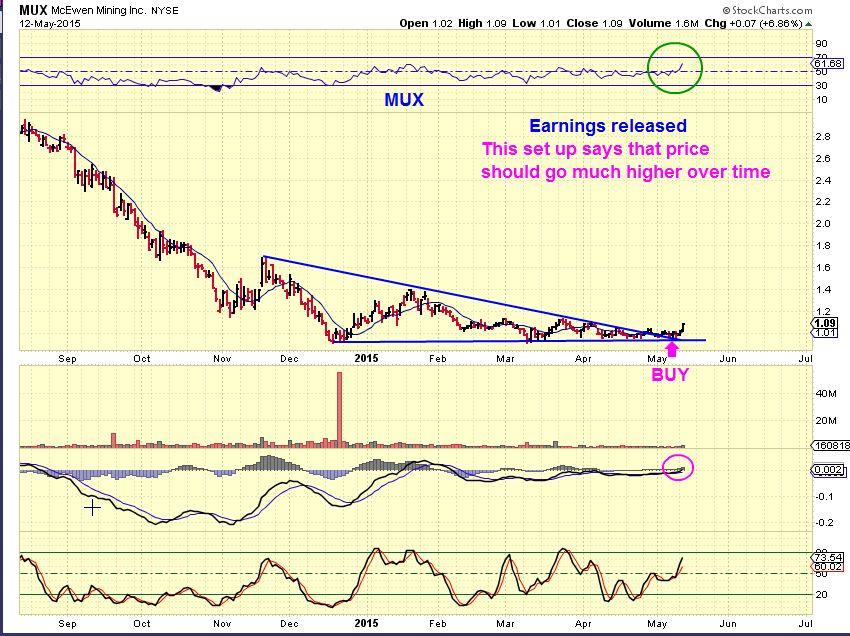
MUX came out with earnings and this is MUX today. Surprises are starting to come to the UPSIDE. I now own MUX, I think there is plenty more upside if GOLD breaks higher ..
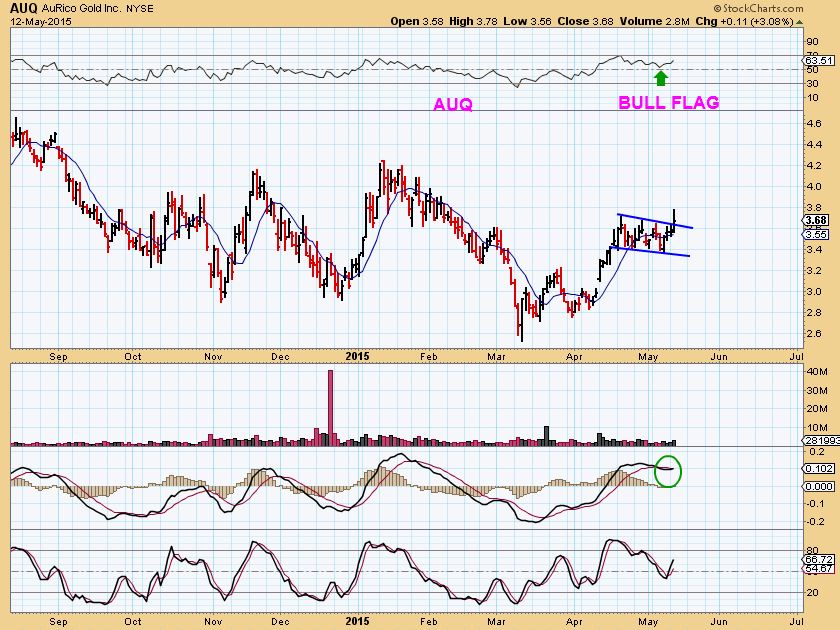
AUQ – looks like an attempt at a bullish break out too. Its a buy .
GDX
So I have mentioned that the commodities keep looking like they are bottoming and many are breaking out higher ( SEE previous mentioned stocks like AKS, X, Solar stocks, Many Energy stocks, now some Miners , etc etc) Lets look at a few more.
.
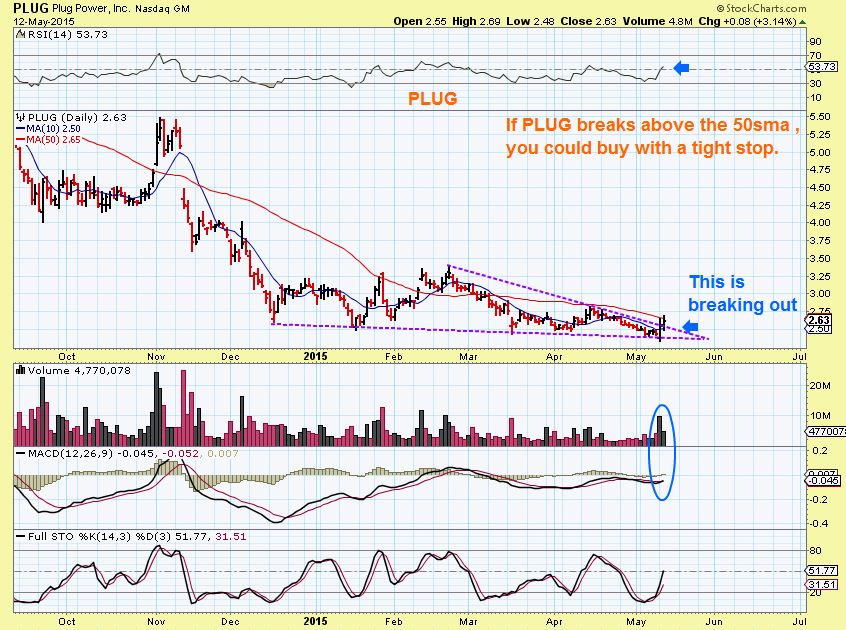
PLUG- I mentioned that I bought this as a Bullish Engulfing Monday. It was down Tuesday, but then went higher (bullish). A break above the 50sma and a close there could be a positive sign to many traders and invite further buying. I still own it.
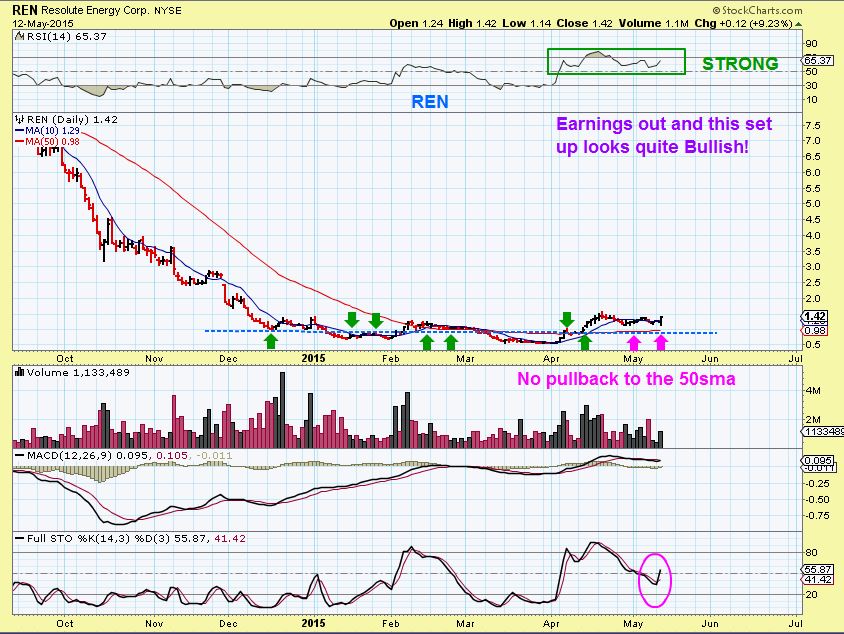
I mentioned in the Comments that I bought REN a week ago and added after earnings . What do I like about it? This is…
REN – LOTS of upside if it gets going, and a long base.
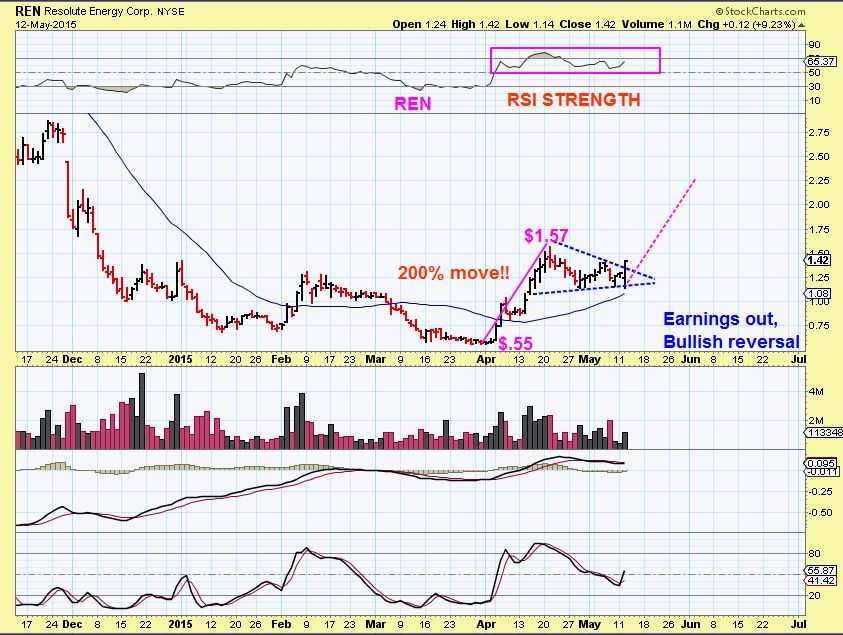
REN CLOSE UP: The reversal today after earnings was bullish and closed at the highs. It is already up 200%, but selling has been limited before earnings release. That was a bullish flip today and I wrote that 2x in the comments section ( I mentioned that I added too).
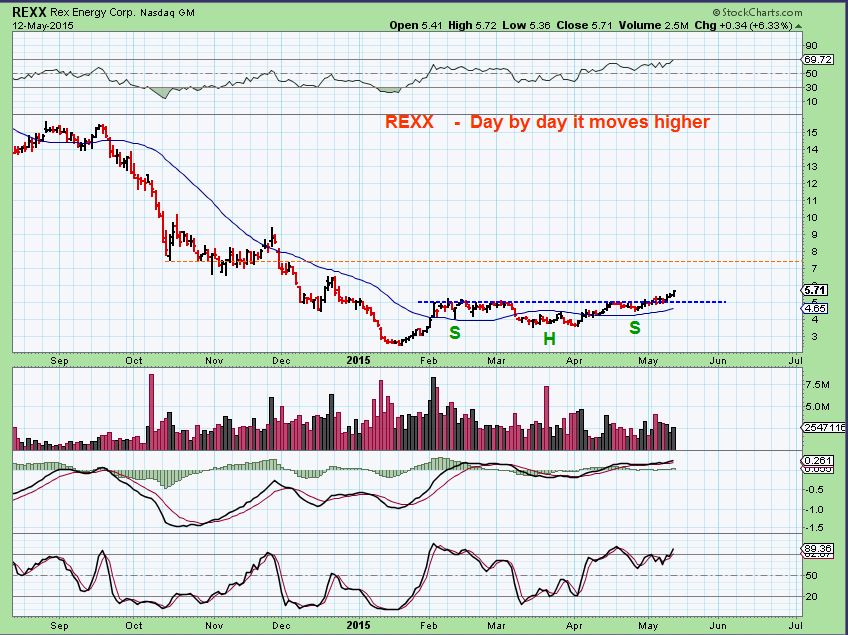
How many times have I said that I love the set up on REXX. Inverse H&S and it continues higher, added at $4.50 & $5.00
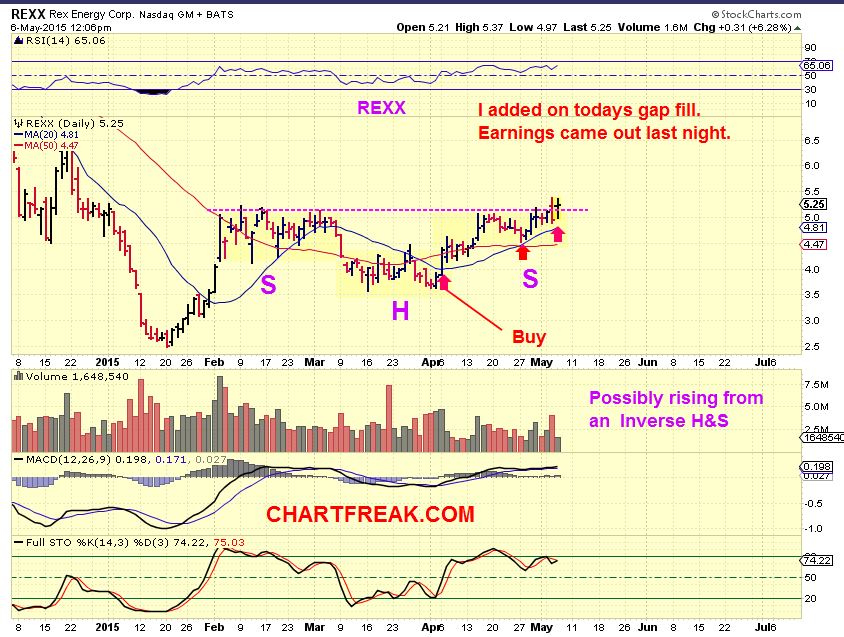 REXX- $5.71 today
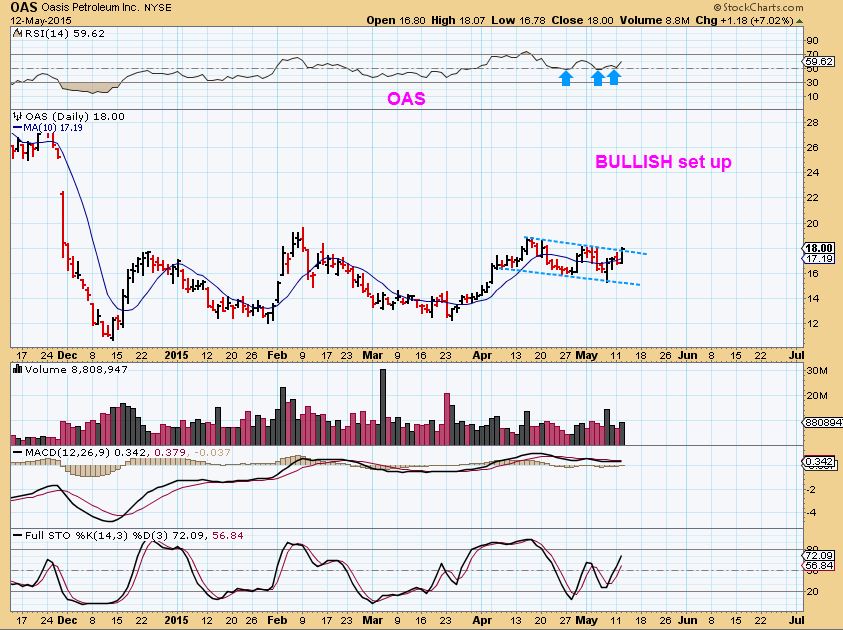
I mentioned OAS in the report. Earnings came out May 6 & it popped. It is about to break out now, a buy as it does.
I pointed out that the solars were reversing last week. TSL, JKS, JASO, CSIQ, etc
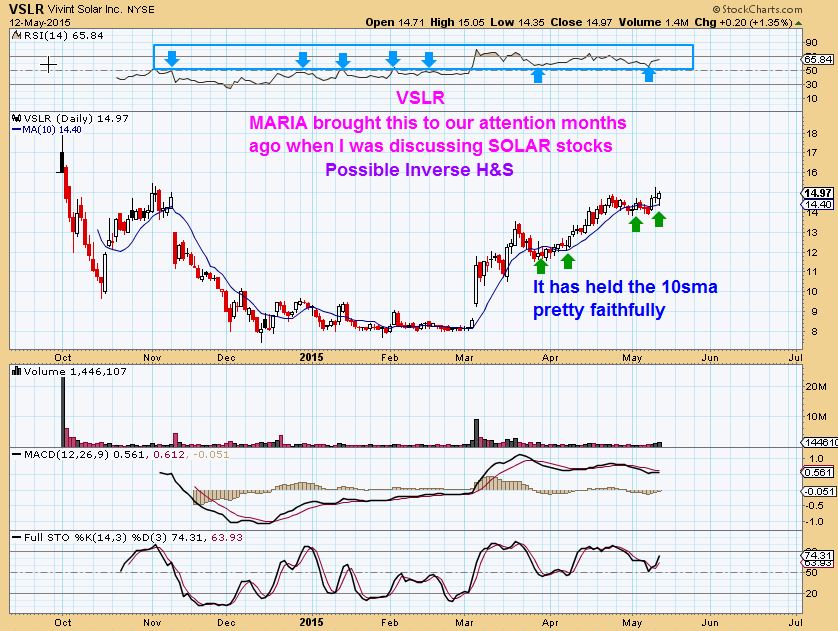
VSLR was first mentioned here in the comments section by Maria , and it did not sell off when all the others did. Notice how it held the 10SMA the whole time? That looks strong $8 to $15 since March. Possible Inverse H&S.
In my Monday report.
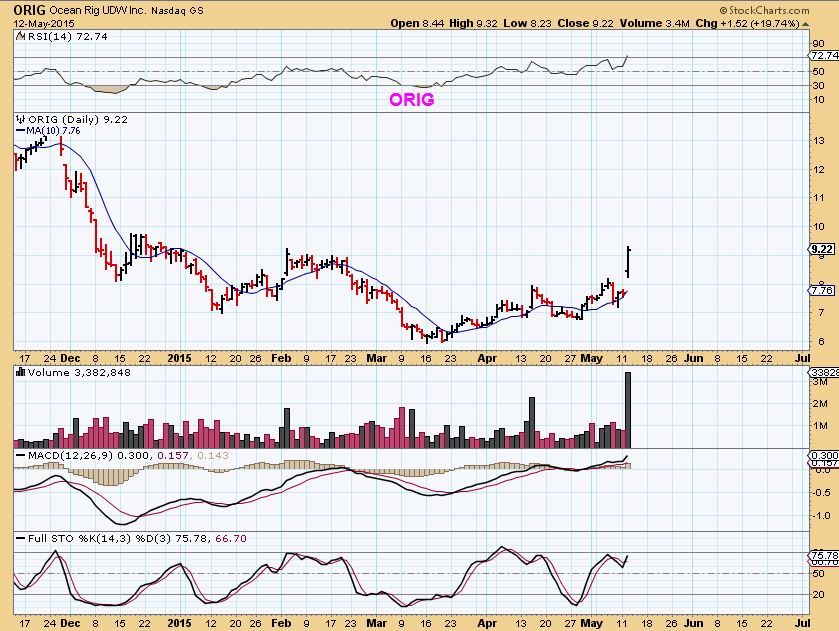
Ocean Rig UDW, Inc. is an international offshore drilling contractor, which provides oilfield services for offshore oil and gas exploration, The set up was tightening.
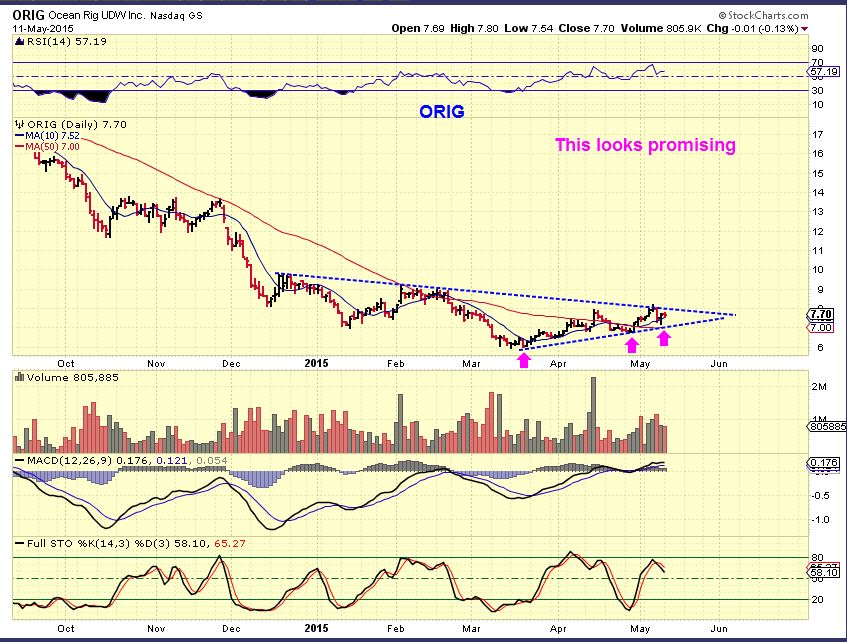
ORIG popped. BUY a pullback/ Gap fill, but it may just run from here.
SO you can see many set ups are still working out, and our ENERGY set ups are still working out great. Miners are starting to benefit and POP, and the CRB has made new recent highs again. It seems that maybe Commodities are perking up. I am not sure if other sectors will start seeing the storms roll in or not, will they start rolling over? I cant know for sure right now, but you can absolutely see & feel a change taking place in slow motion. I have briefly pointed out changes in the $USD & TLT -will those changes continue? Are the Markets topping while the CRB, DAG, MINERS, ENERGY , NATGAS, etc are bottoming? Time will tell, and we just need to try to remain unbiased and trade what we see in front of us. There have been some good trades this year, and I think there will be many more to come. Stay frosty ! : )
~Alex
Ideas for our faster or experienced Traders?
Check out MOSY, MOBL, MX, EBIX & IMH ( man I wish I did the buy & hold on EBIX & IMH ), HIMX?,
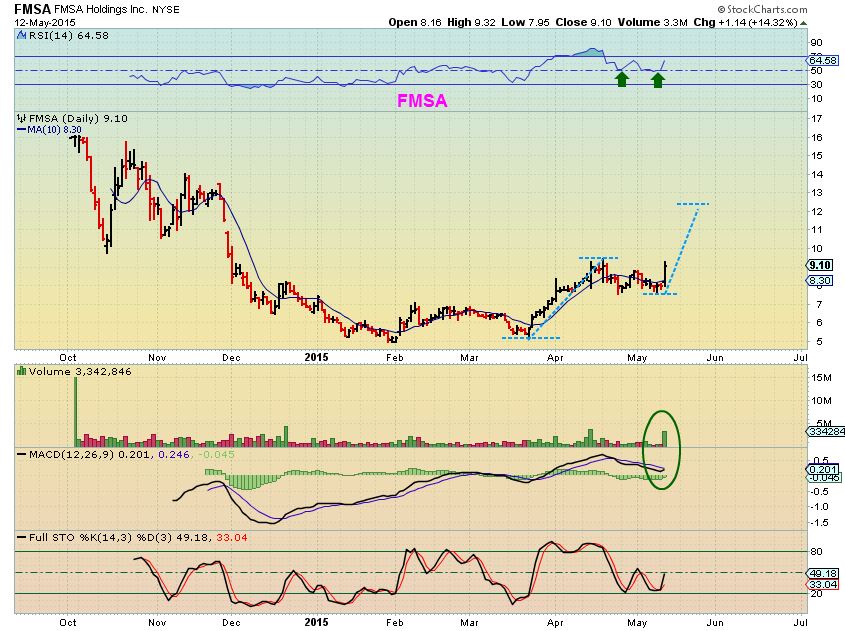
FMSA
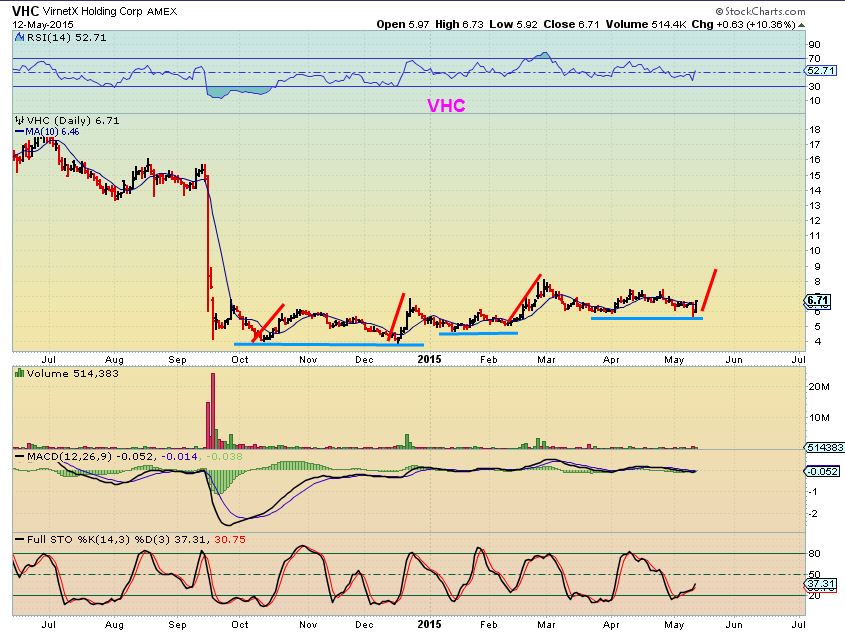
VHC – Run / Consolidate with double bottom / Run / Consolidate etc


Thank-you Alex for all you do for us !!!! Excellent work,
Thanks Alex, good charts everywhere. I currently own, SFY, PEIX, BAS, CLNE, RIG, and NUGT. Pretty much fully invested. RIG has been my best investment, SFY and BAS got beat down after earnings, but look to be recovering. Would you sell any of these to move assets to any of the above expected breakouts?
I have RIG and PEIX and FWIW both look very good to me. Next RIG resistance may be at 25$ PEIX and 15$. I still think CLNE will make another run soon.
Thanks Carl,They all look good Today, except CLNE. I bought it after the big correction, looks like I bought a little early.
CLNE now green, RIG and PEIX blasting off.
I think CLNE needed to consolidate after its big run up. It has a very similar chart to VALE. Hopefully both those and SZYM will move up soon.
Here is my 2 cents on the miners. I’m showing NUGT here (2hr). There are two possible channels. The original one that would mean a large move up via the upper blue arrow. I am leaning to the 2nd channel that is more downside ( the downward blue arrow). I think NUGT gets to $12.50 (the up red arrow), probably a false breakout to $12.73 and then drops back down in the downward channel. Setting stops and hoping for the best. Any opinions?
Well this worked out to be the first choice. Miners rocking forward, when to sell, when to sell?
Nice work, Bill. I had been in JNUG since late last week, exited this morning. Too early! But with work knew that I couldn’t babysit it today so was better to take profits. Still in EXK, looking to Nugt or JNUG again if there is some pullback.
Did you notice that (until today really) miners were slowly creeping up, not the normal rocketship then harsh, harsh pullback. I think I rather prefer the mild up continuously myself. Questions is, does this change of character mean anything?
Cason, Mild up is the best, nobody wants the draw downs. We’ve been thru them 2-3 times lately in energy, but bouncing back. I posted when I bought NUGT. I think Friday? I sold by the close Yesterday, nice profit, didn’t want to give any back. I expect some kind of down day in here, but I think we are headed to the upper purple channel line eventually.
My 2 cents on WTI. Looks like we are moving away from the last resistance zone. The next resistance should be around $66. We just completed a bull flag and are making a 3rd drive higher. A measured distance from the last CD leg has a target near $66. The big picture Harmonic pattern BAT has a high point of $73.80. So, happy in energy for now.
Boom, there went gold. Now, is it for real? Or is it just going to yank us around again. Strange looking chart either way. Gotta make a new high to be sure but I think it’s upward and onward.
Sure looks like more than a head fake! Keep running.
Yep, and the dollar looks sickly here; lost the 94.09 pivot again (peak of that triangle in Feb and launch pt for the last surge). Rejected at the 10 DMA again too; weak.
Another ETF to bolster the whole commodities-have-bottomed theme is XME. Nasty fake breakdown and reversal on good vol in March (with pos divs) and nicely set up now with 20 above 50 and both sloping upward.
Alex, what was that Commodities BEAR chart you showed the other day? How is it looking?
(Accidentally posted this on yesterday’s post; don’t ask)
Key juncture here for COFFEE. Look at a 5 min chart. It tried to
break above the lower trendline of the bear flag last night and was
looking good, but broke down this morning below the up trendline from
the recent bottom last week and is now backtesting it. Still could go
either way here but I wouldn’t take a long position until it proves
itself back above about 136.5, or even better the 20 & 50 DMA at
137. If it does so those MAs start sloping up.
So again, very key
juncture here where it could go either way it seems to me. And short
with a stop at 137ish would be a good play, though I’m not doing it
myself. (and you can translate all that to a JO chart of course).
COFFEE’s popping here, looks good, but right at that bear flag lower trendline now. Let’s see what she’s got!
CENX is indeed popping above the 50 DMA; well done, Alex. Getting overbought ST so if it doesn’t pull back from here there’s probably some real good follow thru to come.
I got stopped on BAS and SFY today. Bought CENX. I have PEIX and RIG they are on tear.
I just added to SZYM here at 3.34 Clearly this is a key level, but volume remains low and it’s approaching the 50 DMA. Good chance that it pops soon.
I bought today as well at $3.37….stop at $3.18
…aaaaand stopped out. I can’t win :/
I watched that stop run. Took it down 10-12 cents in a flash.
It was ridiculous. I’m a little ticked at that…wondering if I should jump back in?
Waiting to see what Alex thinks. It’s right at the 50DMA. See how it opens tomorrow.
Yeah, that wasn’t pretty. Minutes after my buy.
Broke the trendline and the 50 DMA, but very low vol on the day. Not great but not broken yet. Sure need to get a bounce here though or it’s liable to fall off a cliff.
Hey Guys,
I didnt see that until just reading your comments here, I’m writing the report, will include it in the charts.
The one darn time I immediately set a stop(instead of lazily doing it the next day) I’m out instantly on a stop run. Darn it!
I added today as well at 3.40 to get back to full position. Cost basis is 3.15 so I hope we see buyers stepping back in soon.
Looks like we just had a stop run which might be downside capitulation.