
What To Look At
I dont always do a Friday report, but there were a few interesting things that happened in the market. Lets see what those were…
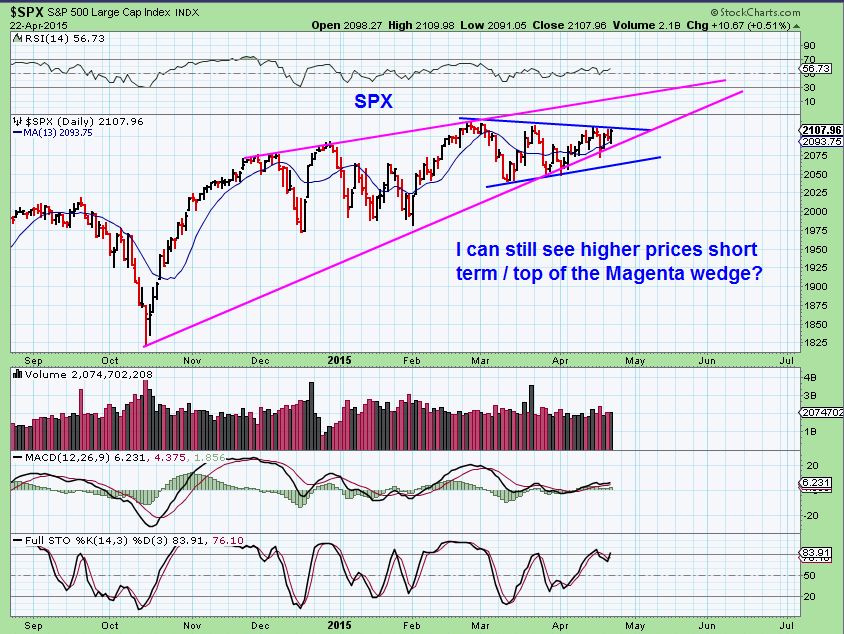
This was the SPX going into yesterday, you can see that anything higher would be a break out type move
Yesterday the markets did move higher, but they pulled back into the close.
I captured 2 charts 1/2 hr before the close and started writing an end of day report, but by the time I finished, the markets had pulled back! These are the charts as of 3:30 p.m.
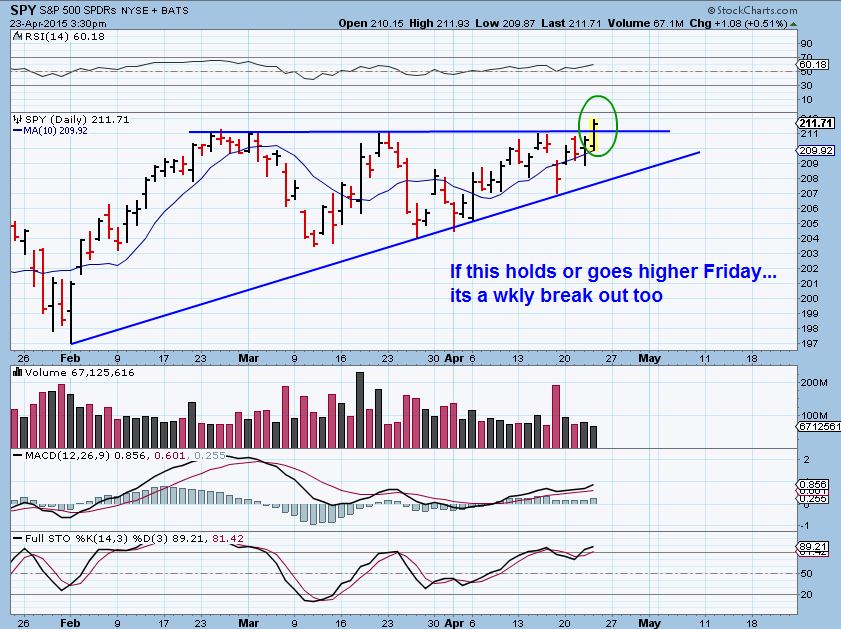
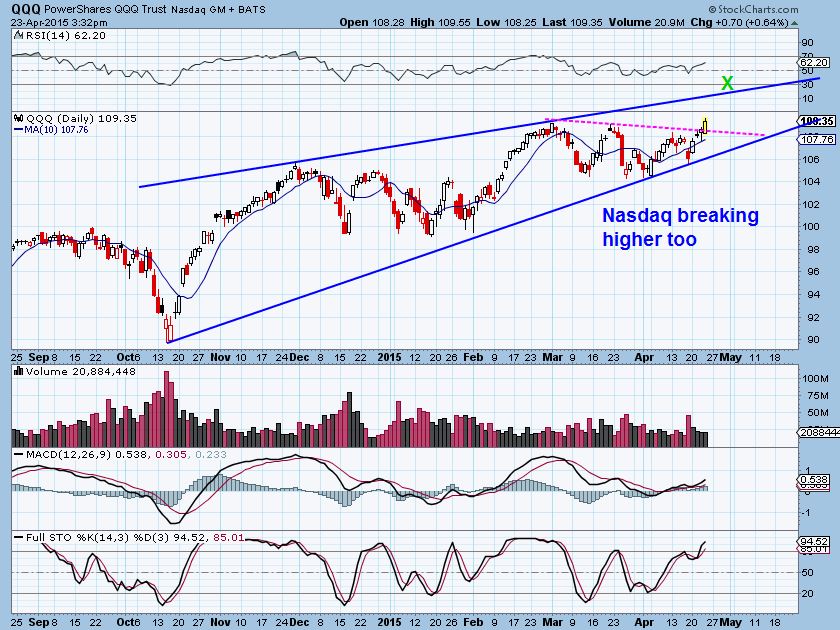
We were experiencing a break out , if it would hold. It didnt, but its important to note that the futures are up (NASDAQ futures are up 30 points!). This would be a break out of the weekly charts , if it holds, since this is Friday. I think it will hold since there are so many bullish charts out there. This would also be a record close for the NASDAQ (Not a record intraday high yet).
SO ALL IS BULLISH RIGHT?
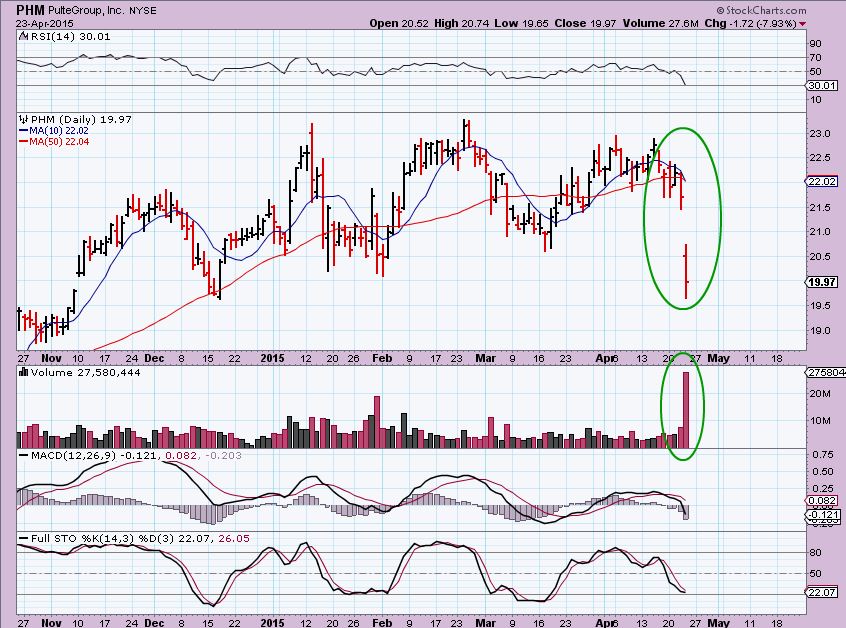
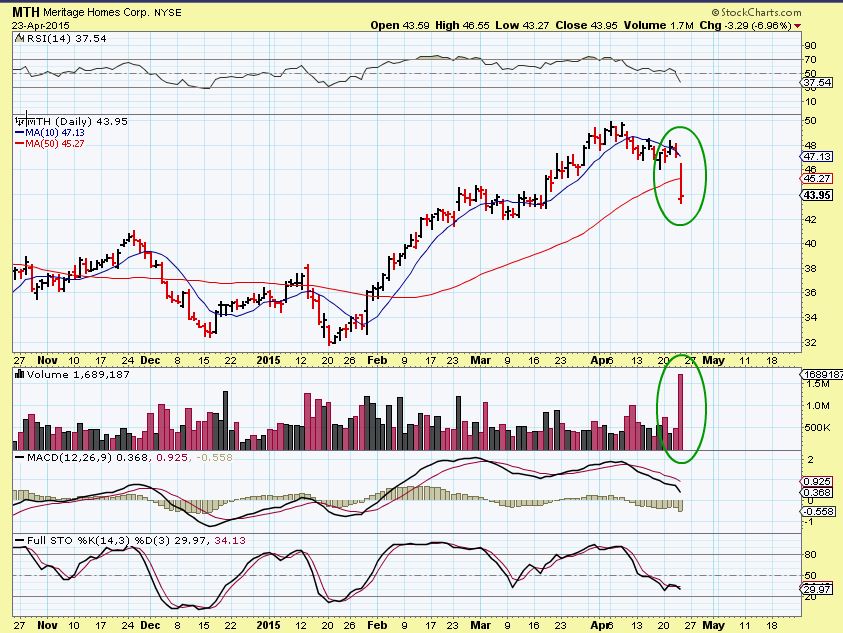
No. I have to point out on crack in the armor . Housing took a big hit the past 2 days, so I have to wonder if the markets are running to the top of the wedge, but housing is an early warning?
Please see DHI, MTH, LEN, PHM, TOL. Behind the beauty cracks appear? I dont hear anyone talking about this housing sector damage. The volume is huge and I had to take notice.
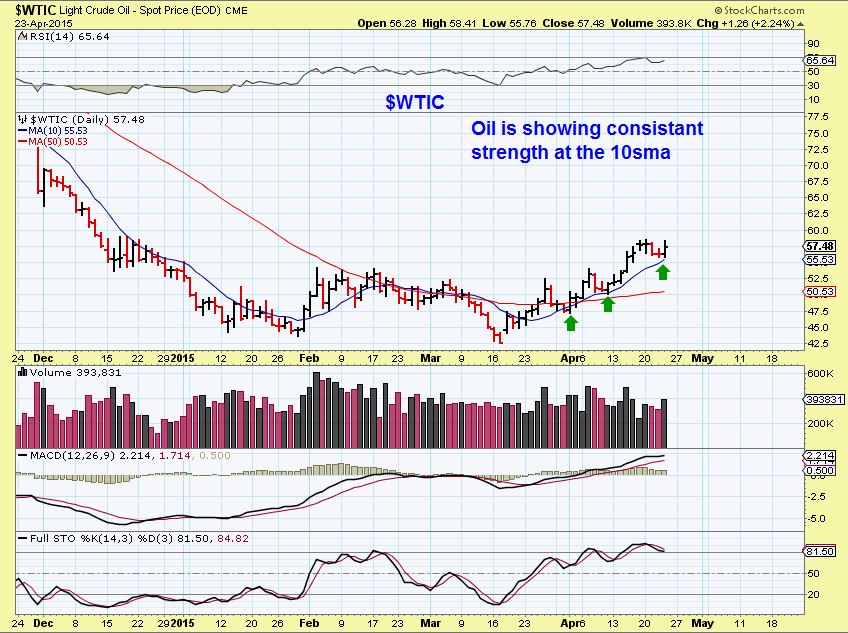
OIL- acting beautifully at the 10sma. It actually could break out today after a week long sideways pause
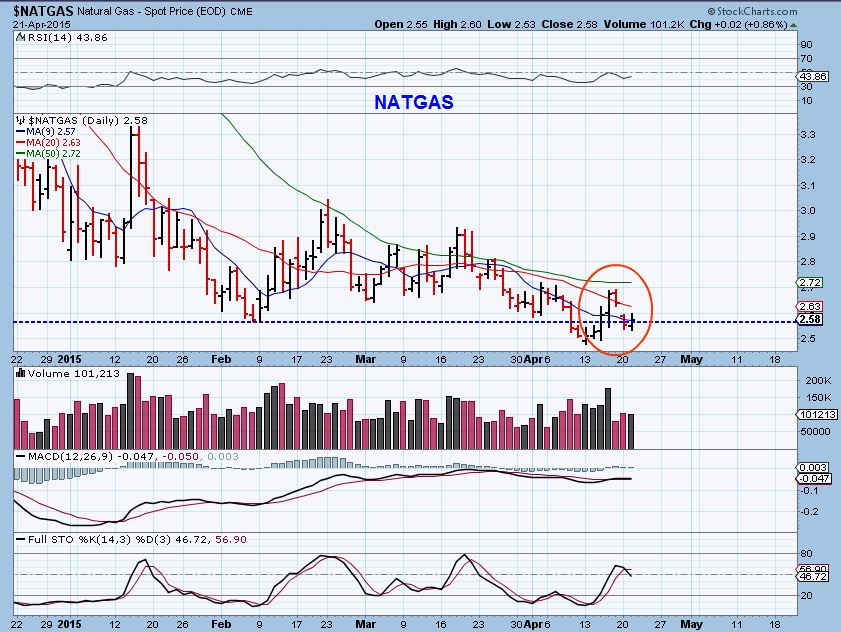
NATGAS – the chart below is APRIL 21. NATGAS recovered and fell back below the blue dotted line ($2.57) . It is still at lows currently futures at $2.59. I am still thinking that it has completed its downside selling. Waiting for the recovery on a closing basis, which could be today ( Above $2.57 lows of Feb 8).
Nothing really changed from yesterday in Gold/Silver/ Miners.
One day they look bullish the next not so much. Miners do look bullish, I expect a break upside soon. I would LOVE to see a quick flush down for 2 days without breaking the March lows. This would be the ideal buying opportunity to clarify the picture for me. IF that doesnt happen, then it is possible that we had a mild daily cycle low recently already in place. I have stated many times that a close above $20 , especially on a weekly basis for GDX would be bullish.
I think all of the things mentioned in prior reports remain bullish. SOLAR stocks are trending higher (SOL TSL,JKS, JASO, etc ) , STEEL stocks look very good (AKS- X-STLD) . I like VALE, CLF, . S (Sprint looks like it finally wants to break out )along with NQ . Uraniums are on fire along with Rare Earth.
If you have time and like to just run through charts, please look these up. I have been interested in these as a trader. Some are set ups, others are set ups mentioned here now breaking out (Those go on a watch list to buy a pullback). I wish I had time to draw up all the charts for you, I have been a little under the weather since yesterday.
.


NBG up 20% since Tuesday lows… It seems to want to fly. And likely will do when Greece setlles down. Again.
Weekly candle (not shown) is positive.
Worth building a long term position? as it has languished down here in lows single digits sicne mid 2013 and appears to have double bottomed.
Its possible. I was watching GREK since you mentioned it too , charts are similar, but I like NBG better for liquidity and movement.
Thanks for taking trouble to answer and for your tentative affirmation
NBG also better set up IMHO
awesome…tx! Be well chartfreak.. take care. :o)
Thank You Maria – Have a nice wkend
FCX is indeed following thru on its reversal yesterday; looks good.
Very nice follow thru.
I was looking at SUGAR, COTTON, COFFEE STEEL URANIUM, etc etc etc – ( $CRB & Check out DAG)
Commodites are moving nicely off lows lately
Anyone looking for a uranium lottery ticket look at MGAFF.
nice- URRE hasnt really dont a whole lot either.
SSN – made a little money on this one a few years ago and hasn’t moved yet like the other oil plays. looks like a tight base to me but would appreciate another opinion on the chart. my chart reading is not great.
FWIW, here’s my take. It does look like it’s trying to bottom; pos div on daily RSI, MACD; possible double bottom. And vol has been large on up days.
Don’t like that it’s been so weak compared to others in the sector and 50 DMA just tipped down again. Almost feels like a better short if it tested the 50 DMA. Not much volume either.
Of course it could pop from here, that’s always possible. But it just feels too much like a 50/50 shot to me at this point. I’d keep it on a watchlist (and will do so myself).
thanks for taking a look at it
Hi Alan ( refresh for a chart)
It looks like it is improving in amny ways, but it struggles to go higher, so it needs to break above this downtrend line first , then it will deal with the 50sma. Personally I’d let it prove itself at least above that trend line. There are other better charts in Energy. I’ve been in HERO for a bit and its not worth the wait : )
thanks!
Yep, that’s pretty much the way I see it too. Thx
Silver is bouncing just above the lower trendline of a falling wedge (on the daily). Maybe a bit of a bounce here and then another to touch that TL before a real bottom (and of course watch for the break out above the upper TL).
VALE, holy crap! But let’s face it, that wasn’t a good setup down there before this spike. A bit positive with the fake breakdown and some pos div on a daily RSI, MACD, but it was a bit of a coin toss as to whether it would go down or up, IMO. I’d love to hear that argument refuted though. Maybe I’m missing something there.
On April 22 it was very positive with that divergence you mentioned and so I Posted a daily & weekly chart. See 2 charts below . As long as it stayed above the 10wma …it remained a good buy. chart attached from my April 22. I pointed out on my daily that this time looked different.
Oh yeah, I was referring to just before that pop. Of course it was a bit tough to buy after a 10% pop, and then it just kept going! Shows that sometimes it does pay to buy that first breakout strength (with position size, etc. caveats, as usual).
Mostly I was just making the point (or trying to) that it’s enticing to see this kind of pop and then be lured into pure bottom fishing instead of waiting for a bullish development and then maybe watching for a good pull back to buy with a better risk/reward, etc.
Yeah, sometimes you get a good POP , and then it drops , so buying any pop doesnt always work. i was kind of alluding to that too in the daily. We’ve seen this before ( pop & drop) .
And let me make it very clear, I was definitely not criticizing your work, Alex. I’d forgotten that you’d pointed out this stock the other day. And now I wish I’d taken a position based on that chart! 🙂
Or BAS Holy crap! 😉
Yeah, a couple of these popped out of no where.
SXC & VOC were nice. GNE has been a real bull
BAS 🙂
Positive earnings today on Newmont also. Maybe that will help hold gold stocks up.
Nice island bottom on NEM, and really since Dec it has held up well.
Whats with BAS? I own it, not complaining…….
Earnings reported last night
May be the start of the next nice run : )
wondering if here a sale is warranted. I did that last week and rebought one time at 8.9 and once at 8.05. I do not want to lose on patterns I don’t know.
Maybe BAS can help some of their friends get hot, too!
BAS earnings must have been better than expected!
P is pretty interesting here. Big upside reversal off of initial sell off on better than expected earning last night; bounced right off the 50 DMA on the open. I’ve been watching it but no position.
I got into some SCIF (India). It’s slightly below it’s 200DMA. Tight stop a bit under its last low. Very limited risk and could turn around here and head back up. Just an interesting idea for anyone that likes India.
ASPS is a good one to watch here.
I like both ASPS and Pandora , nice set ups so far
If we can push thru this resistance band of previous consolidation at $58, WTI should head much higher $67. We’ve hit up against it twice already.
68-80 are the 38 to 62% FIBs
For a few minutes this morning I thought GDX might stage a rally even with gold off pretty heavily. But doesn’t seem to be the case now, certainly not with low Fri PM volume. No trigger, no trade. Seems likely now dropping in to DCL, just need to see where it ends up. Would be nice if it just falls into the low instead of bouncing up/down each day.
Another Fed meeting next week. Maybe that will be the catalyst, one way or another.
Oh not again. Really getting tired of every time there is a single data point off (up or down) by .1% then the Fed rate increase rate ‘changes’. No, it doesn’t! Not one piece of data by itself. Wish they would stop messing with my setups. Ok, off the soapbox, have a great weekend.
Tried a small position in ANY after it showed up on my screen a while ago and Alex mentioned it today. Going to promptly get out–20% trading range today–not for the faint of heart and definitely not for me. Good luck to all those who want to take a stab–day traders delight I suppose but that’s not my style (sadly). 🙂
Pull up a chart with only the 50sma and 10sma for ‘ANY’.
See how it struggled under at the 10sma in Feb , then finally broke above to the 50sma. Then struggled at the 50sma 2x and broke through .
So basically looks similar so far. …It struggled above the 10sma again, now tagged the 50sma & dropped, so I want to see if it holds the 10sma and tried again, etc then I’m watching to see if it can get through that 50sma.
Maybe I’m reading WAY TOO INTO IT : )
That’s the way I see it. Building a nice base and proving support at key areas is what we want to see to tip the odds in our favor. Of course there’s also a possibility that it just rockets from here, leaving us behind. Those are much tougher to sniff out and are just lottery tickets. But that’s just the way it goes.
Sometimes you just have to let it go without you. Plenty more fish in the sea.
I definitely see what you’re looking at, it’s just the volatility that gets me. Well I’ve got my stops in so maybe I should just shut the computer off and stop torturing myself. I suspect that’s 3/4 of my problem 🙂 btw original comment wasn’t being critical just not used to holding this stuff…Now where is that power button?
No – I didnt take it as critical at all, and totally agree that when a certain stock ( like DGLY for ex) can move SO MUCH in one day & in either direction, it can be WAY TOO MUCH to stomach. Some trades are for the conservative and ones that move like that ( 10% or more in a day) are not for those trying to avoid risk. Thats why I dont mention 3x ETF’s too. I trade them, but I look for the low risk entry ( bottom of a drop) watch them a lot.
KEN- You asked me to email you yesterday, but I dont know which KEN you are in my sign ups.
If you can hit the ‘support’ tab at the top of the page & then click contact me , there are 2 choice. Contact support or contact Alex. If you email there I can reply to you, Thx
Hi Alex,
I did this morning……under Alex (Author) ?
Just in case: ktvelting@yahoo.com is my email address.
Odd, I never got it and I usually do. Yes ALEX/AUTHOR should have gone to me. I will contact you. Thx
I actually think that I love what happened to GOLD/SILVER / MINERS today. It brings us so much closer to a buying opportunity and Miners are holding up so well with Metals selling down? That seems quite bullish.
I will try to do a more detailed write up in the weekend report.
Sounds good, Alex. Late morning thought miners might stage a rally, but it was not to be. GDX looked solid despite GLD was down a pretty good chunk. Hope we get that DCL in soon, ready for it. But for now, boring and blah Fri close as always.
Back to the regular grind next week so no more midday posts, at least for a few days.
THANKS ALEX, this sound encouraged. B.T.W. I saw the same .
Have a wonder full weekend.
Geurt.
Do you think this could be the dcl or the fed Wednesday will determine it?