I cannot believe how many beautiful chart set ups keep popping up for traders in the markets. I’ve mentioned STEEL stocks, Energy, Tech, and really even some of the Miners have been setting up rather interestingly. Are all systems go? Lets turn to the 38 charts for more information…
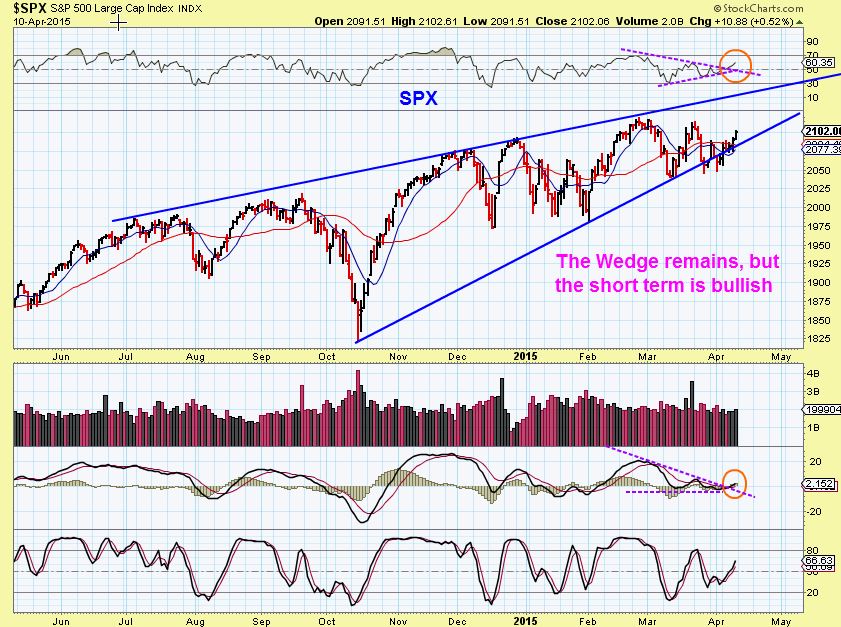
SPX– Still wants to run higher
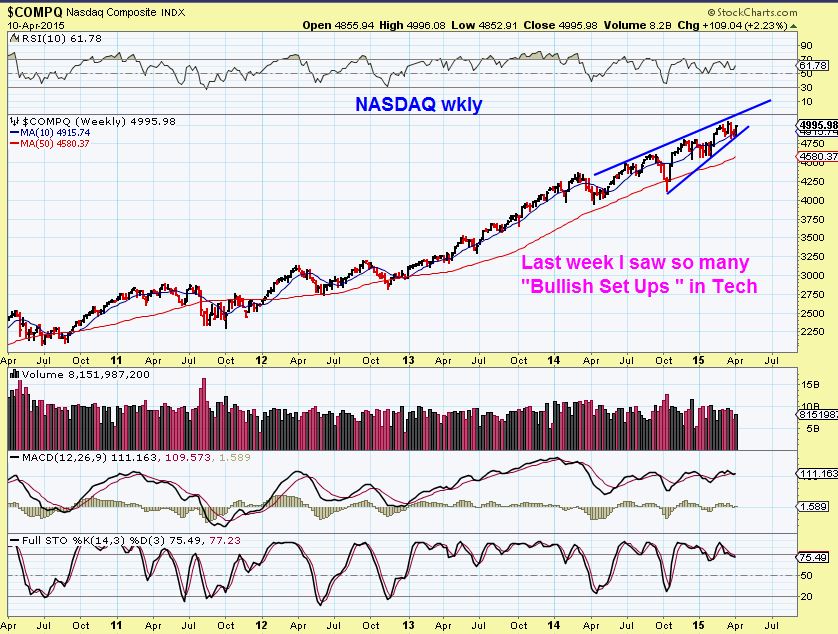
And since the week has ended, here is the NASDAQ WEEKLY CHART…
Last week I mentioned that I am seeing so many Bullish set ups, but that pesky wedge is still there?
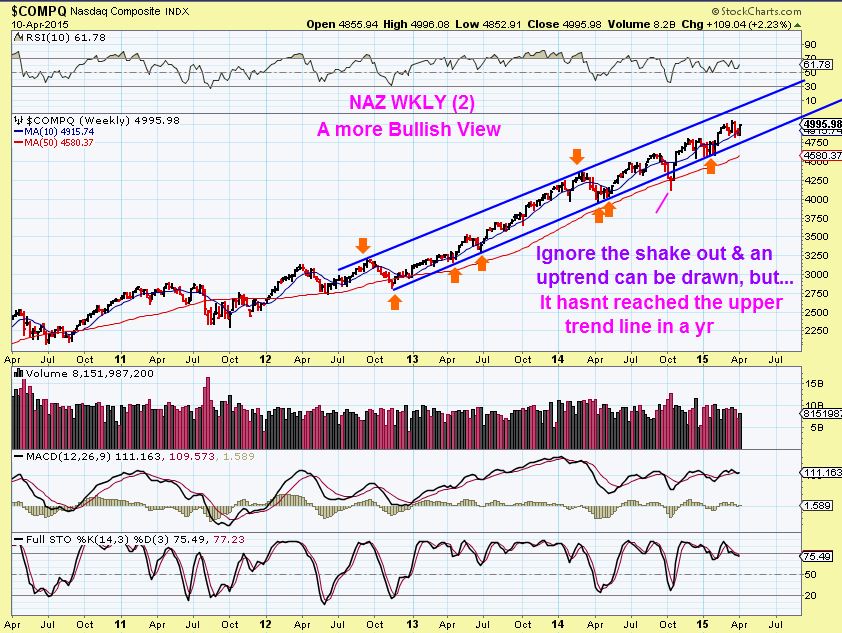
With all of those Bullish set ups , I wanted to point out how that wedge could morph into a channel , if the current consolidation simply breaks higher. For now I still want to keep that wedge in the back of my mind, especially since there is one in the SPX too. So far , it hasnt reached the upper trend-line in a yr.
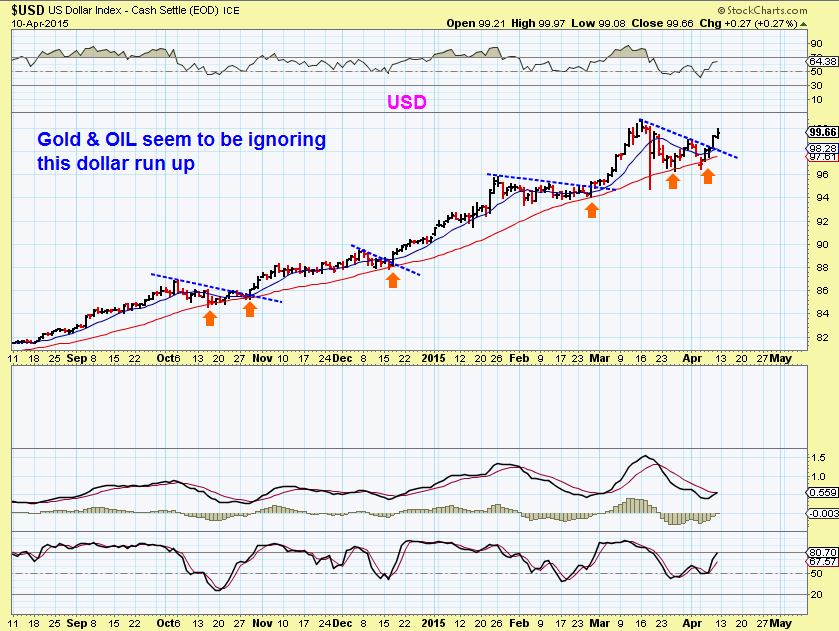
The USD March 24 – I did expect a bounce & drop. Thought the double top could help Gold.
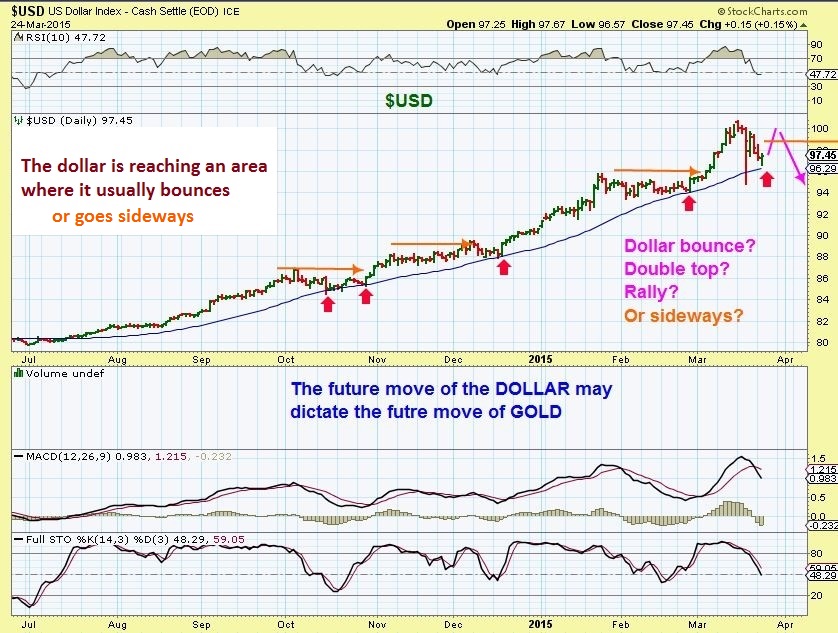
USD now- We got the bounce & a drop, & now a break out higher. That May cause GOLD to drop into a Daily Cycle Low (so far Gold & OIL ignored it). It also may be an True Double top, breaking 100 again.
OIL
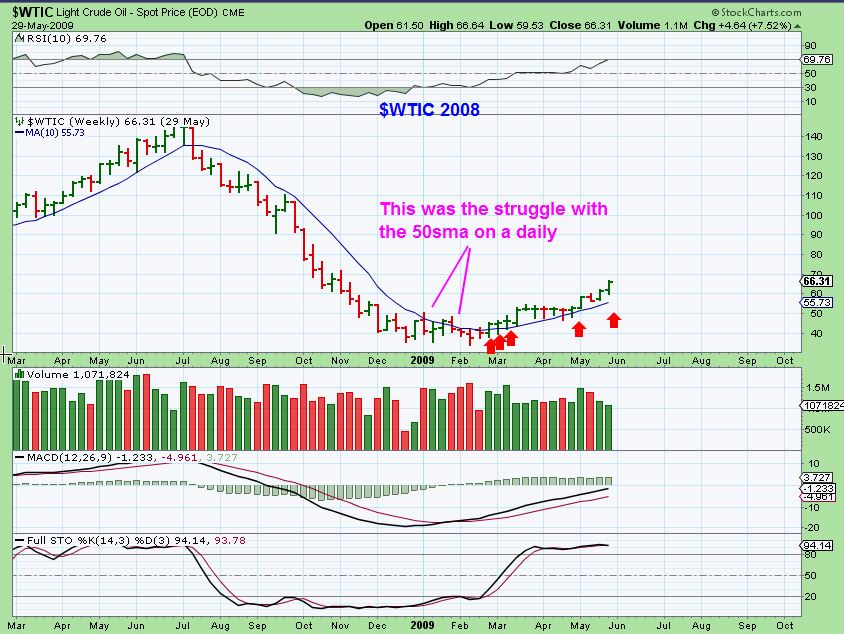
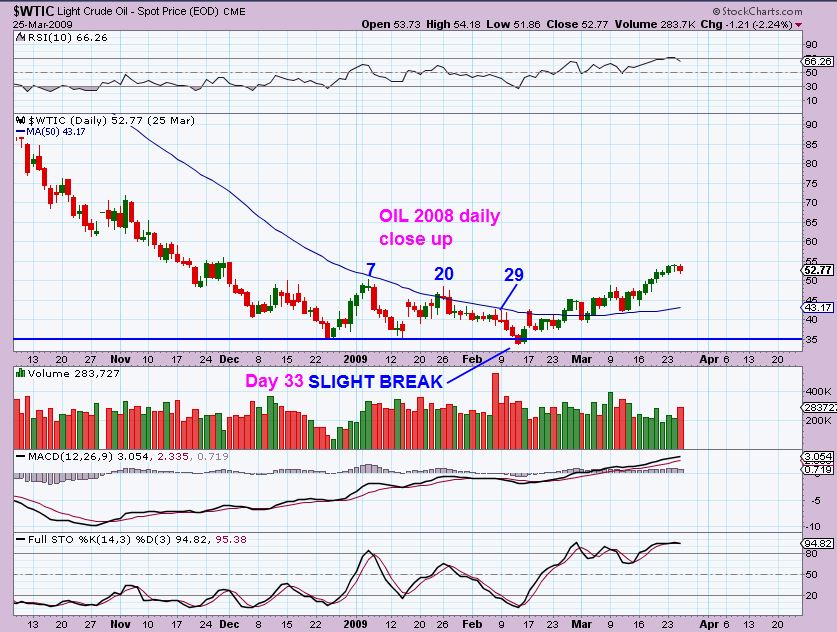
Lets look at the 2008 bottom in OIL again on a weekly basis. THIS is what I am watching. When OIL broke above the 10WMA…it went sideways / up for a couple of weeks ( Red Arrows).
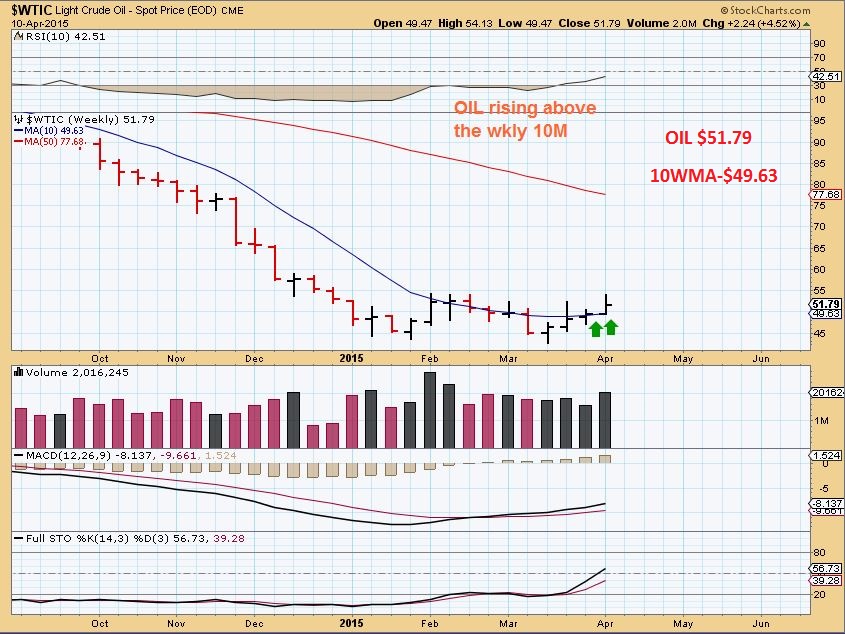
OIL has now broken & closed above the 10WMA . It may just continue higher, it may just stall. I want to see it hold the 10WMA
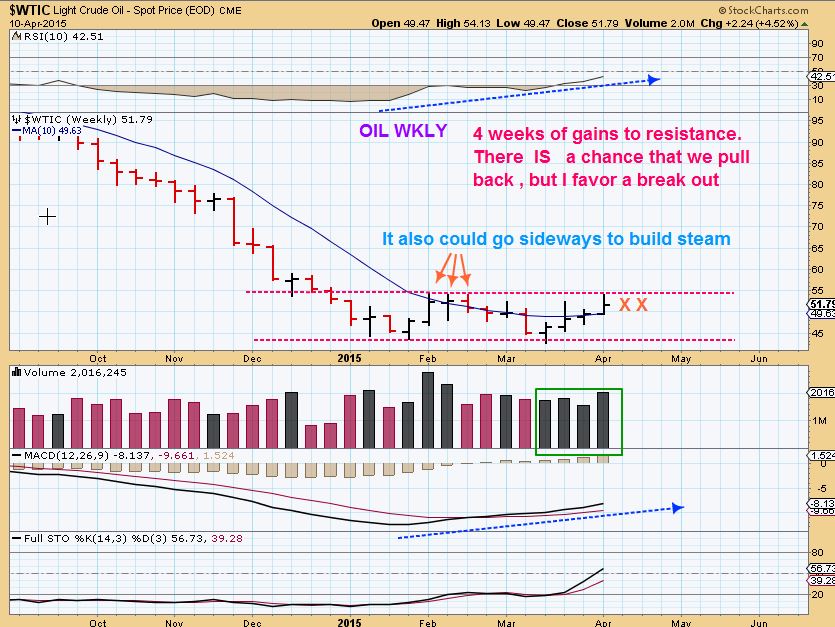
OIL WKLY AGAIN… Oil is also at resistance, thus it may go sideways .
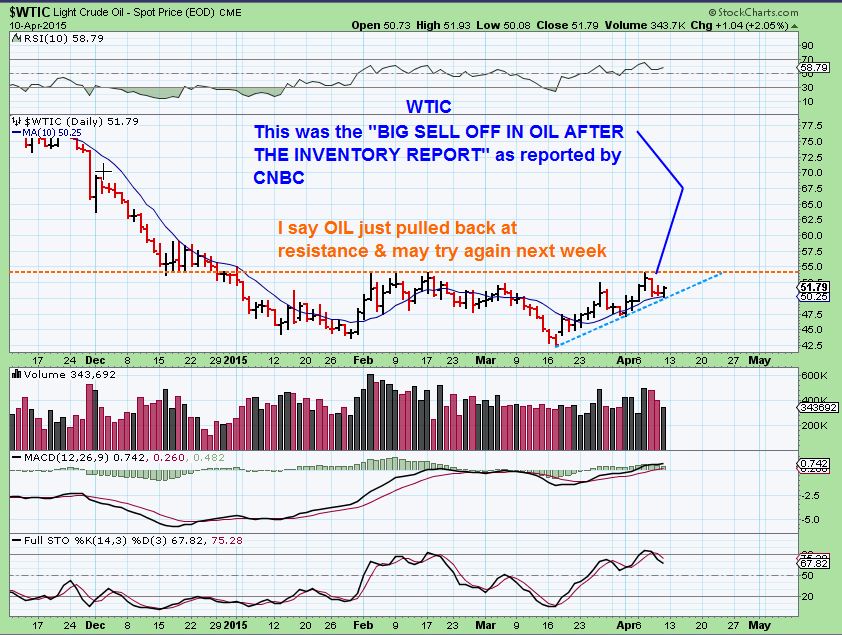
OIL DAILY– I still own Energy stocks and the set ups look fine. If oil breaks out, I would expect ENERGY stocks to rally.Resistance has been $54.24ish
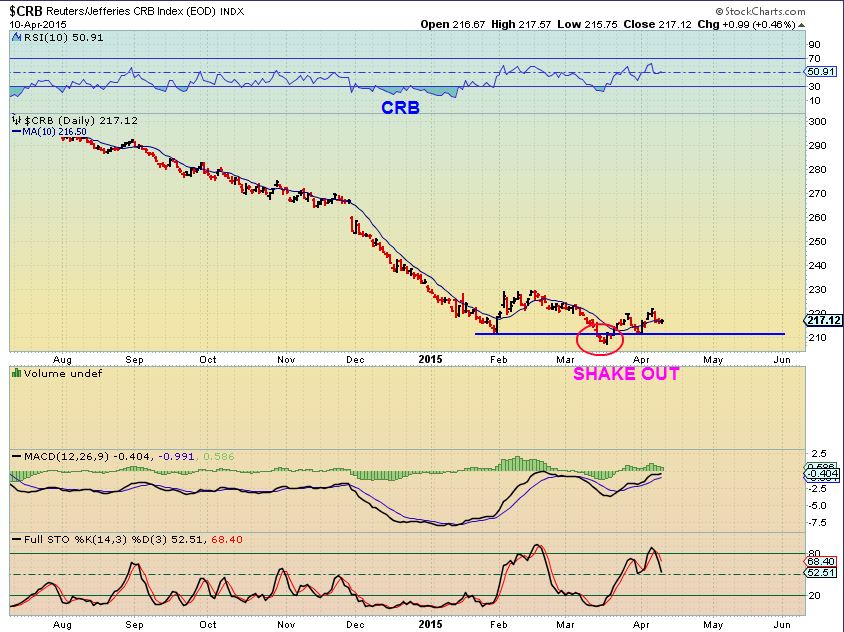
Note: If you have been here for a while ( we do have some new readers to welcome ) you know that I called for a double bottom “Shake out ” type move lower in GOLD & OIL and then a quick recovery. We did get them. We also got one in the CRB, so after seeing that , I mentioned that we should probably expect a “Shake out” in NATGAS too. As a review for newer readers, this is what you can expect when BIG MONEY wants to enter a position. They have too much money to just buy on the way up, that would just drive the price up on them. First they sell the price off and break lows , so stops get run and others will try to “Short the break Down”. Then they Buy and prices recover, shorts have to cover and they enter large positions. This is what it looks like.
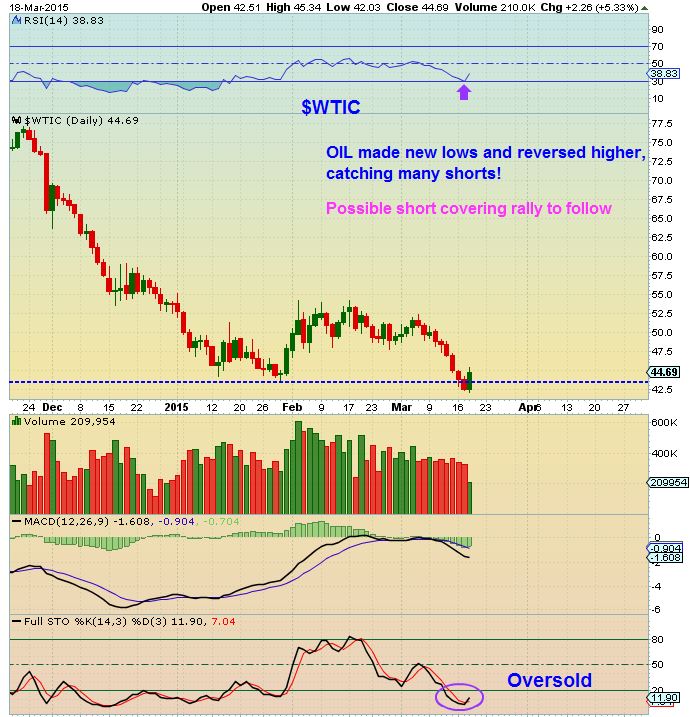
OIL had a break down & recover March 16- I posted this chart. As people went short, Big Money was able to step in.
I showed how it happened in 2008 too
CRB– this is the CRB currently, you can see that “shake out” in March
And now look at NATGAS. A break down now.
Are we in the middle of a “Shake Out”? I think we are . The recovery can be bought by “EXPERIENCED TRADERS ONLY” Only with UGAZ or BOIL. These trades need constant attention in front of your screen. please know that I will not be able to monitor these trades for you, so please be experienced with 3x ETFs and know your trading plan . One MUST wait for the recovery, in case NATGAS just keeps selling off.
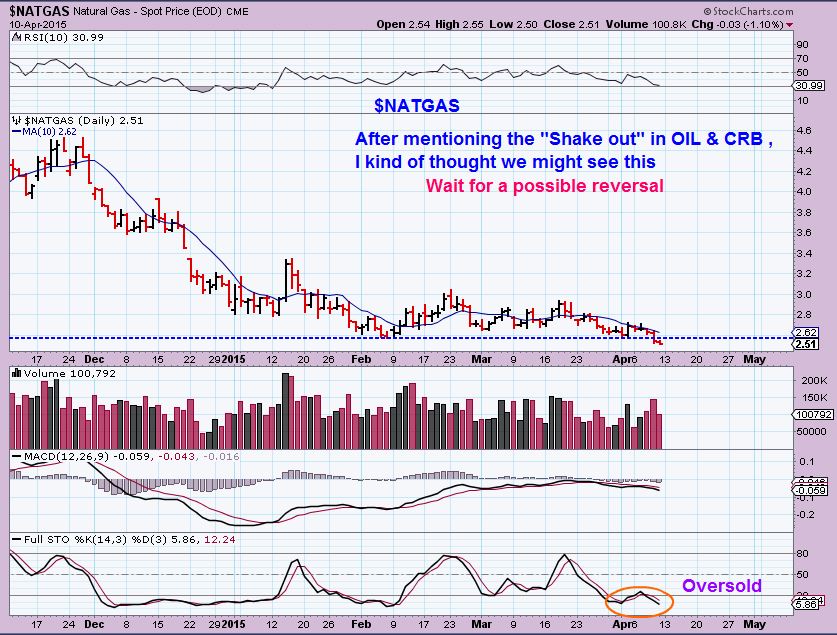
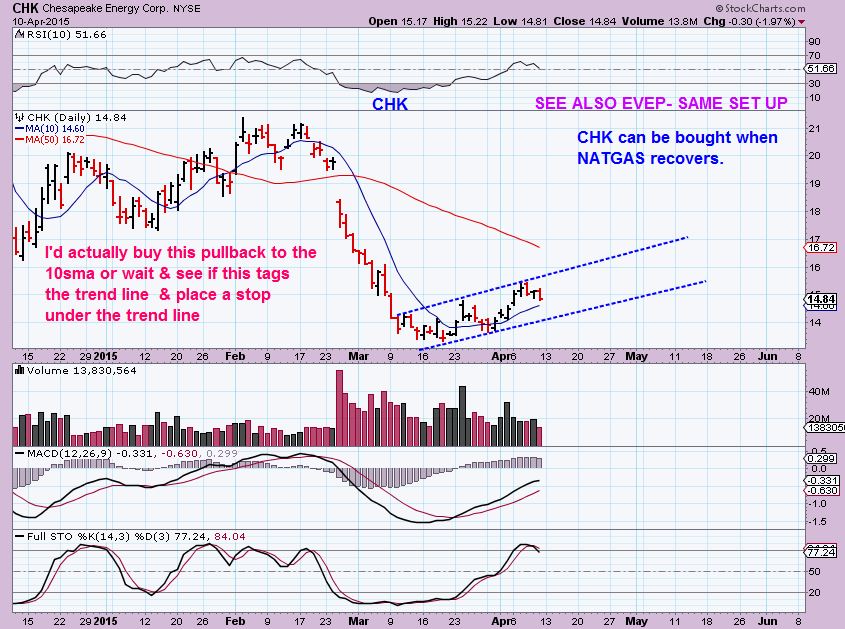
The reason that I think this is a shake out is that many of the NATGAS favorites are already moving nicely and Not selling off . CHK, UPL, EVEP, PQ , & check out PSTR . CHK & EVEP may be setting up for another run higher if NATGAS does recover.
GOLD SILVER & MINERS
(Sold my NUGT over a week ago – I do not currently have a position. Looking to buy miners soon)
The C.O.T. for Gold was at proper levels for that Deep Meaningful low ( An ICL). However, It was last Oct too, and rolled over.
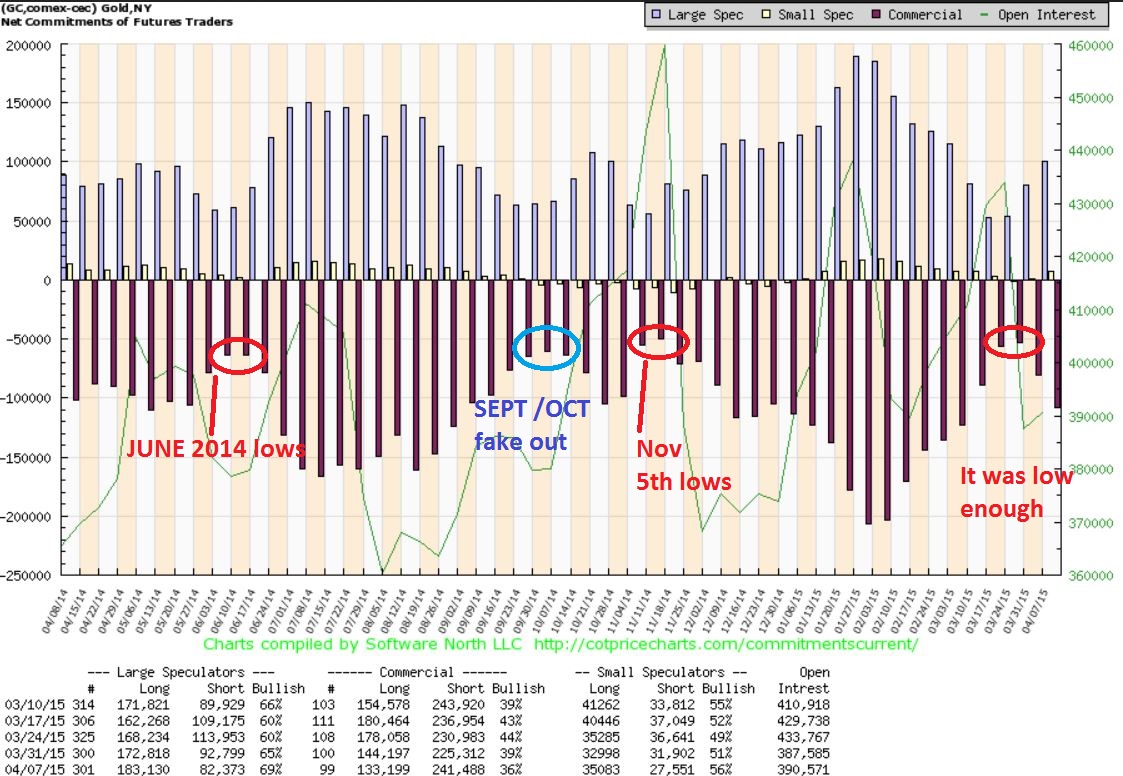
So I do think we may have seen a major low in March , we will know soon enough.
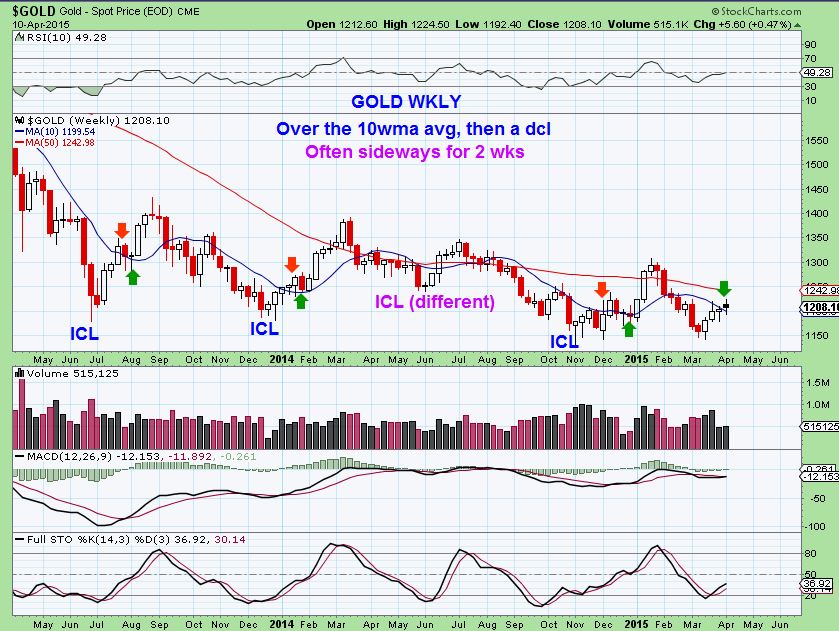
The Weekly GOLD chart below seems to confirm this, but the immediate direction of the daily cycle still seems a little unclear (I’ll explain) . Things should become clearer this week.
On a weekly chart, GOLD & Closed broke over the 10WMA (Bullish) , but went sideways for a couple weeks the last few times it did that (Red & green arrows) as it found its Daily Cycle low after that. I’m watching this.
This is a Bullish Daily View of GOLD , with Fridays reversal.
Some think we had a short daily cycle and this is the start of the 2nd daily cycle. If so, we would expect a break higher soon.
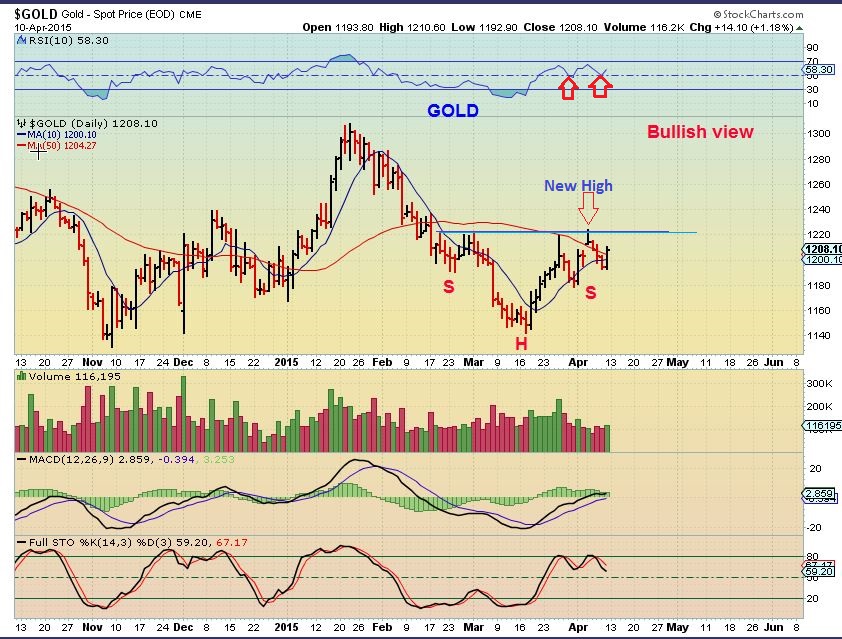
HOWEVER: GOLD Part 2– Just an observation. Is the Daily Cycle low still ahead, even if we do POP?
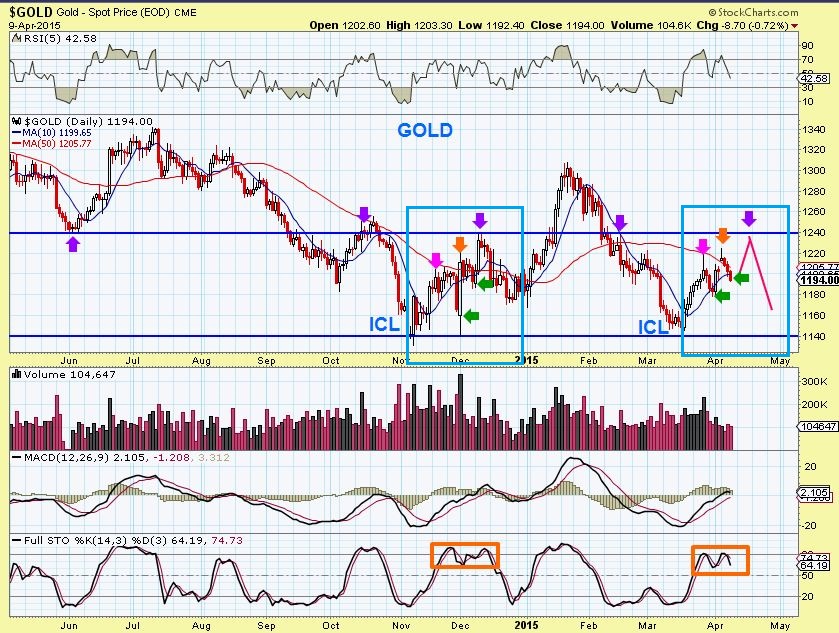
Remember what we saw in Nov-Dec at about 18 days into the 1st daily cycle? Gold surged higher 3 times to resistance ( Magenta /Orange/ Purple arrows ) and then dropped into the real DCL. That Resistance is still overhead. USE STOPS if you are buying a break higher from here, just in case we get a repeat.
SILVER is the problem for me. It needs to improve quickly, because I think SILVER & MINERS lead golds next move most of the time.
Silver Wkly – The Silver weekly closed lower last week, the Gold Weekly closed higher. Silver often leads Gold.
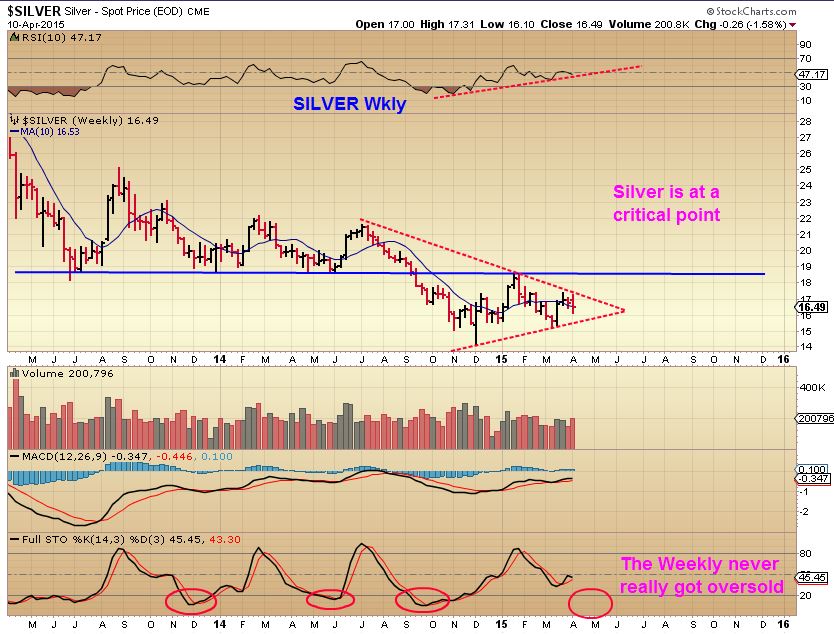
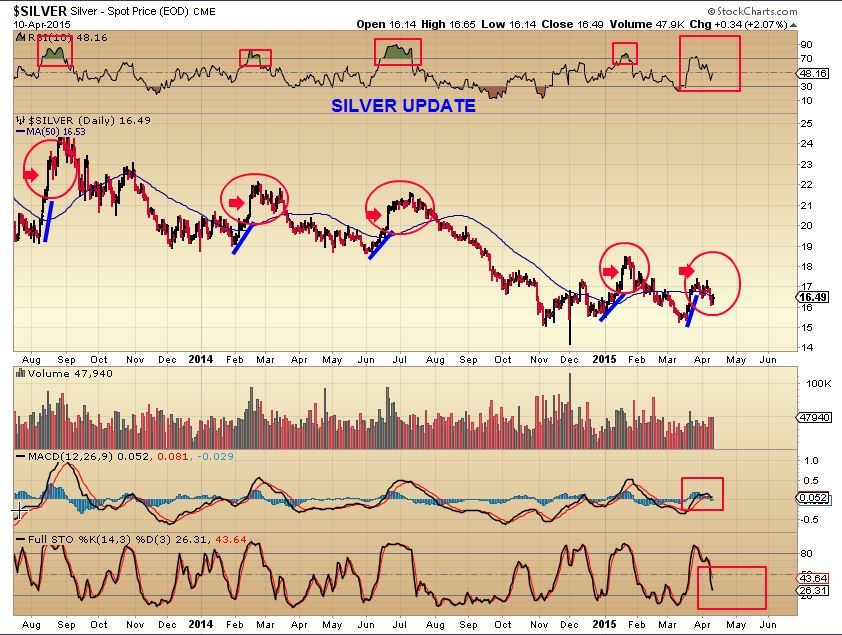
I pointed out SILVER on MARCH 24. I was looking for a POP in silver & green RSI oversold, if LOWS were in. Often out of an ICL, Silver runs up in a slow steady rise ( Blue line) and then POPS. RSI goes green over 70. I posted this chart to show what I am looking for … A POP.
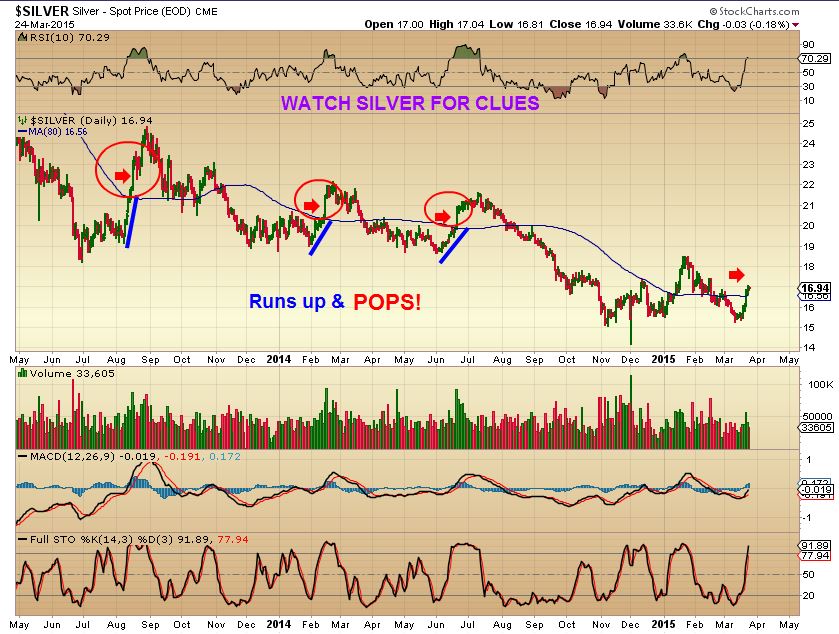
Silver has not POPPED after the slow grind higher, while Gold was rising, it laggs. It is also not oversold yet. (DCL ahead? )
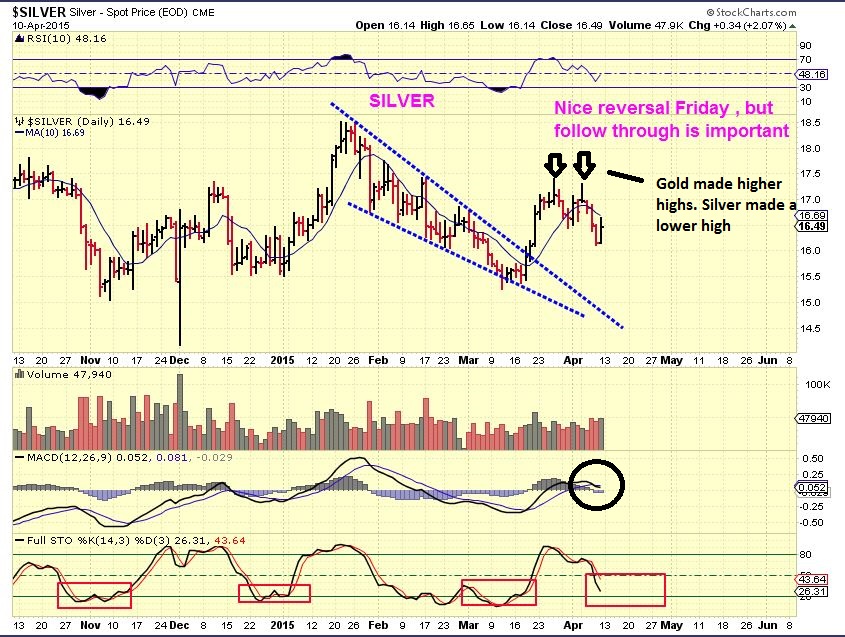
SILVER Daily- Remember Gold made a higher high on its recent POP? Silver made a lower high. Hmmm.
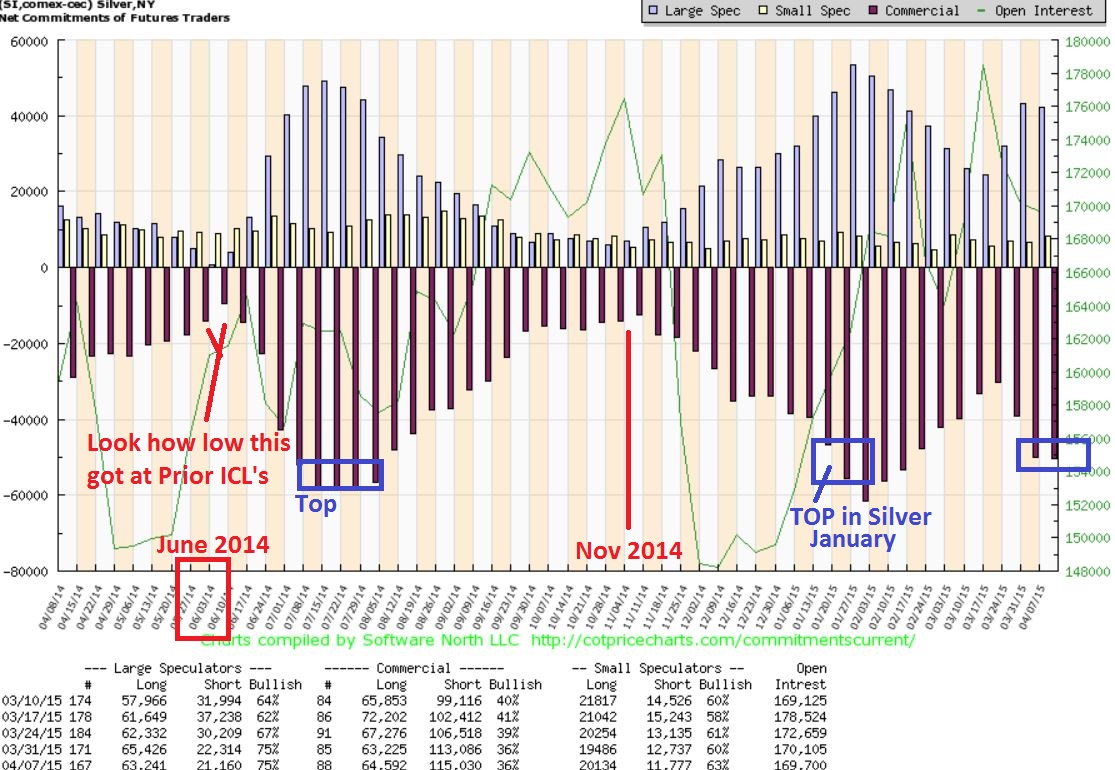
The SILVER COT never hit ICL sell off levels. It’s closer to TOPPING levels.
May or may not be necessary, but Does warrant caution I.M.O.
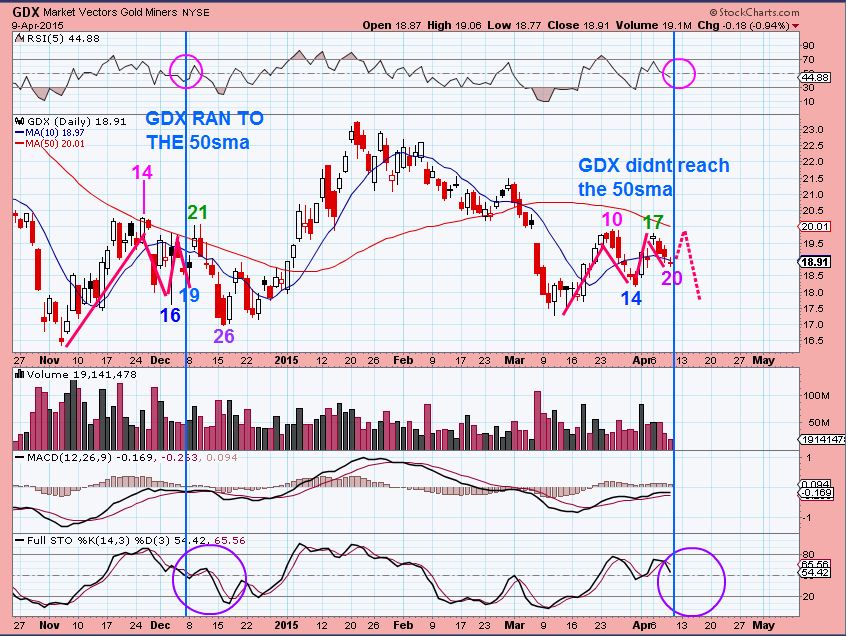
GDX Observation- Again looking at last Nov-Dec we see a very similar pattern. It frustrated many including me, since I bought on Nov 5. Notice that GDX even never touched the 50sma this time. One more POP may match day 21 for Dec, but can it break out? I have repeatedly said that I want to see GDX close above $20.00 – $20.50, so I am still waiting.
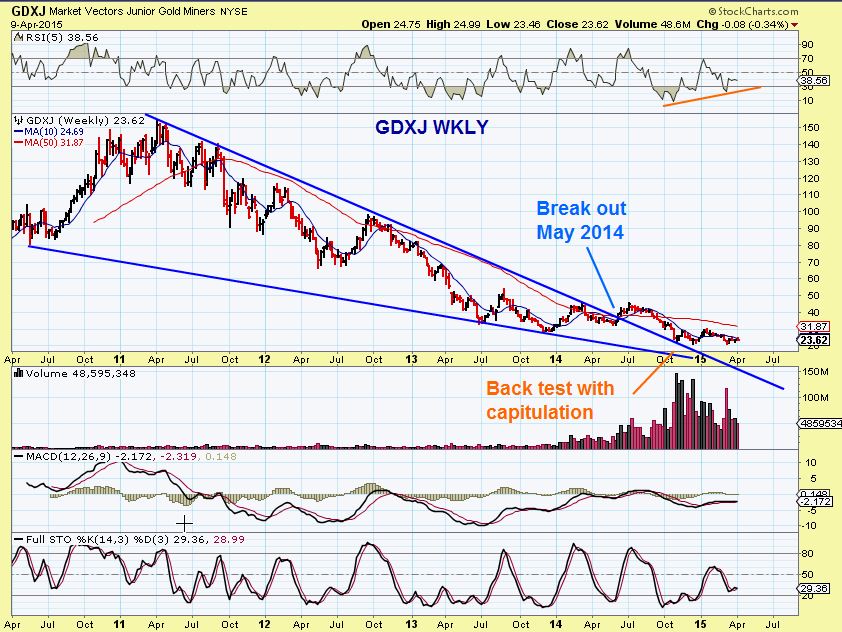
GDXJ WEEKLY – This is a nice long term set up- it appears to be bottoming. A break out & back test last Oct can be seen. Many Miners charts are looking healthier lately too. I do think a nice opportunity in Miners is near .
SO many set ups look great in so many sectors. I have mentioned some in the past, and there are so many more popping up. Even the Miners are looking like nice set ups, but I am still wanting to be patient there and see if GDX can close above the $20.50 mark convincingly. I still own some Energy Stocks and will be watching them going forward. I am watching NATGAS to recover , because I think we may be right in the middle of a shake out. This week should clarify a few things in various sectors like Natgas & Gold & Miners. For now its basically a traders paradise. Thanks for being here and welcome new ones.
~ALEX
Stocks of interest
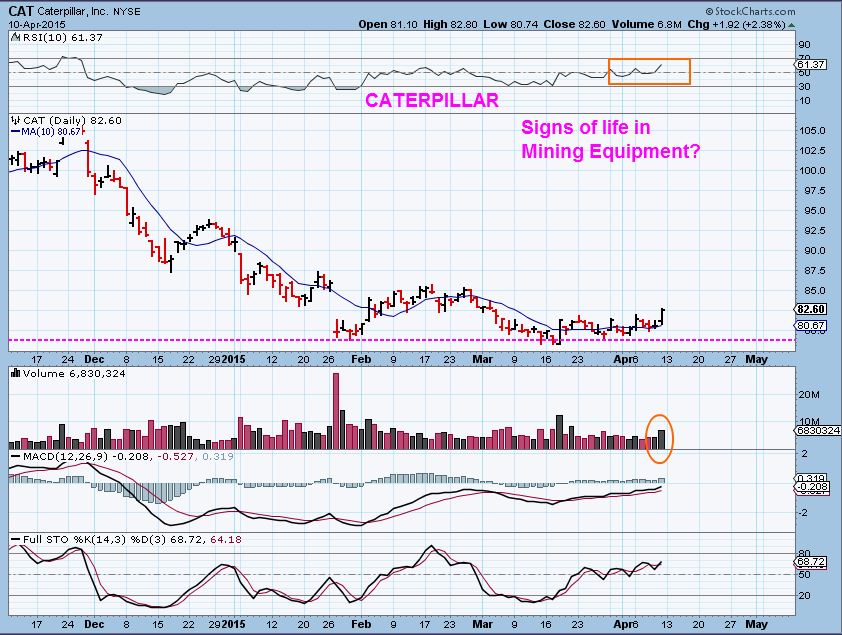
CAT – Mining equipment bottoming? Just broke above the 50sma, could be bought with a stop below the 50 sma or your preference.
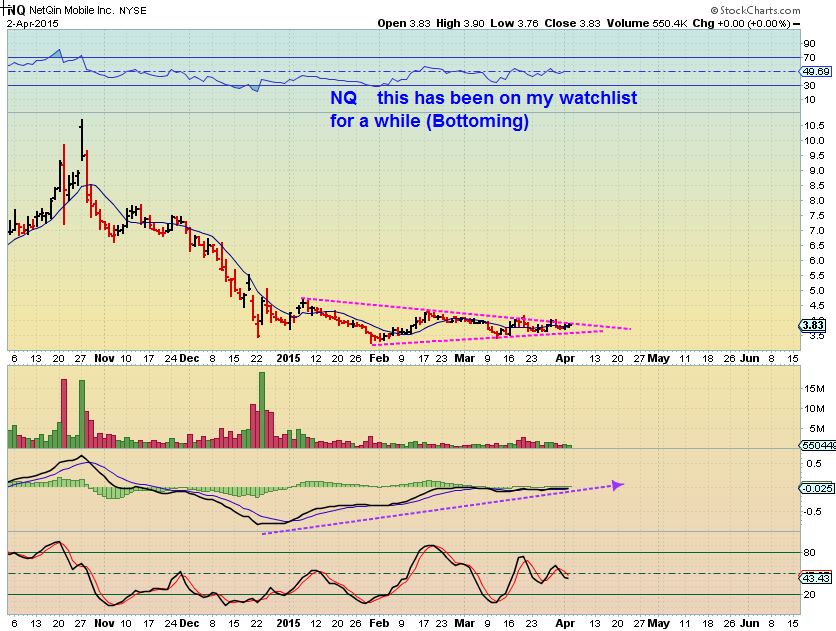
This recent recommendation ( NQ) just broke out & may or may not back test. Still a buy
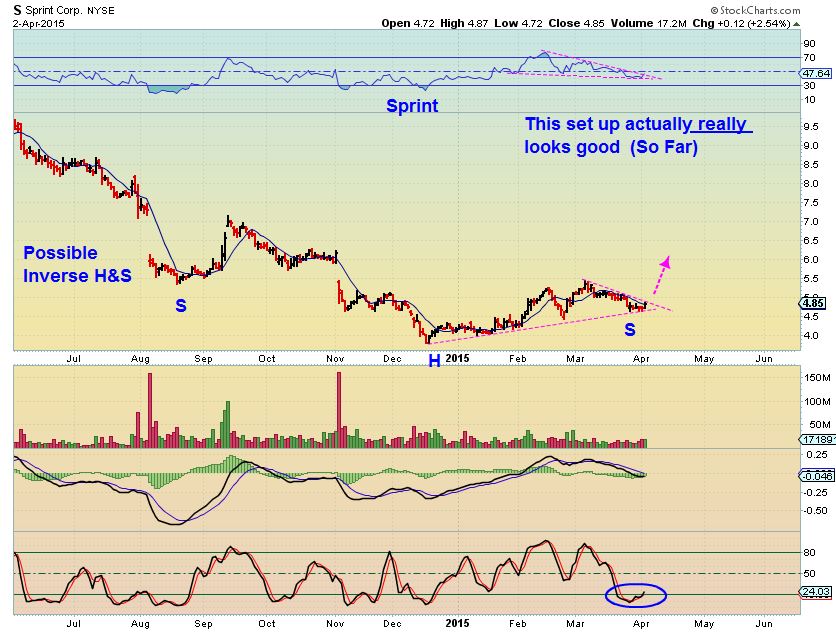
This recent pick broke out & did back test. May be ready to move higher.
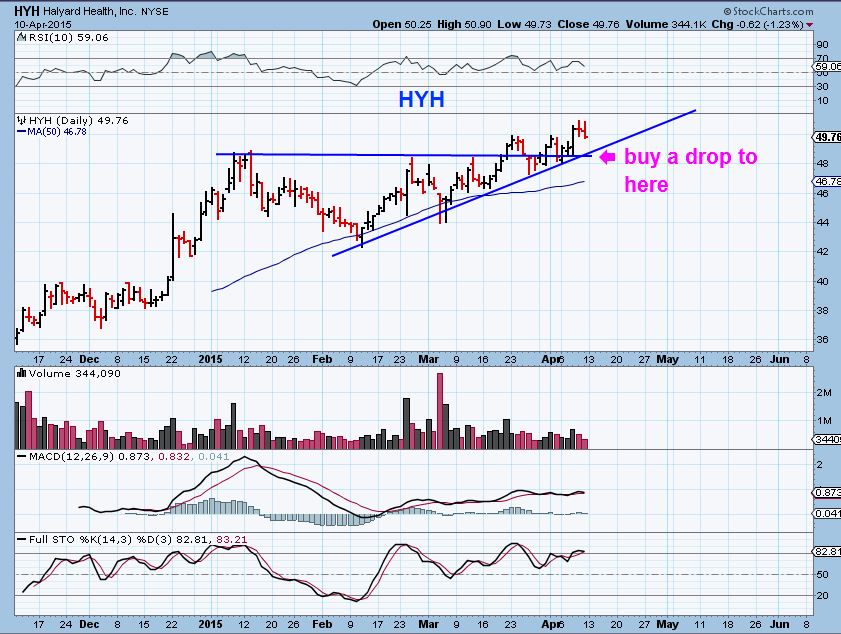
HYH – Still a good set up, consolidating. See nxt chart.
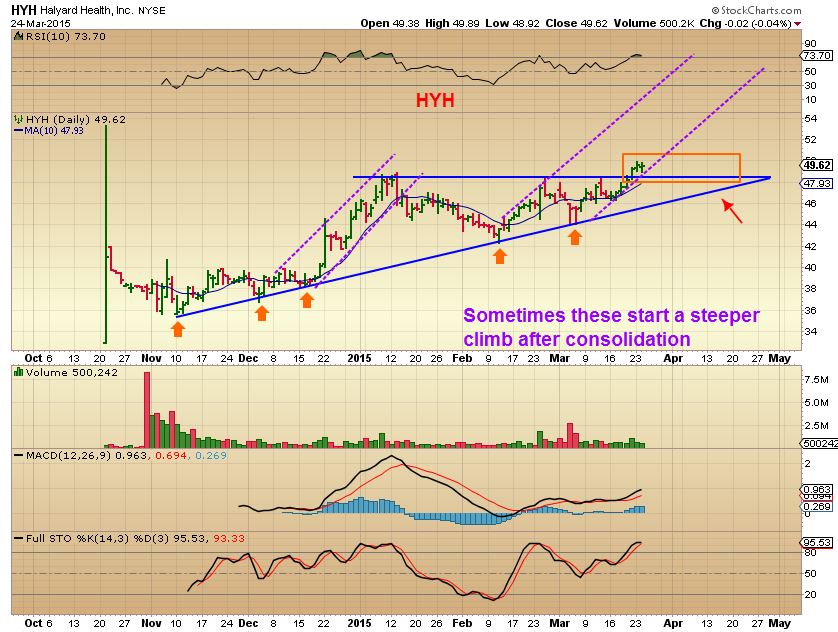
HYH-
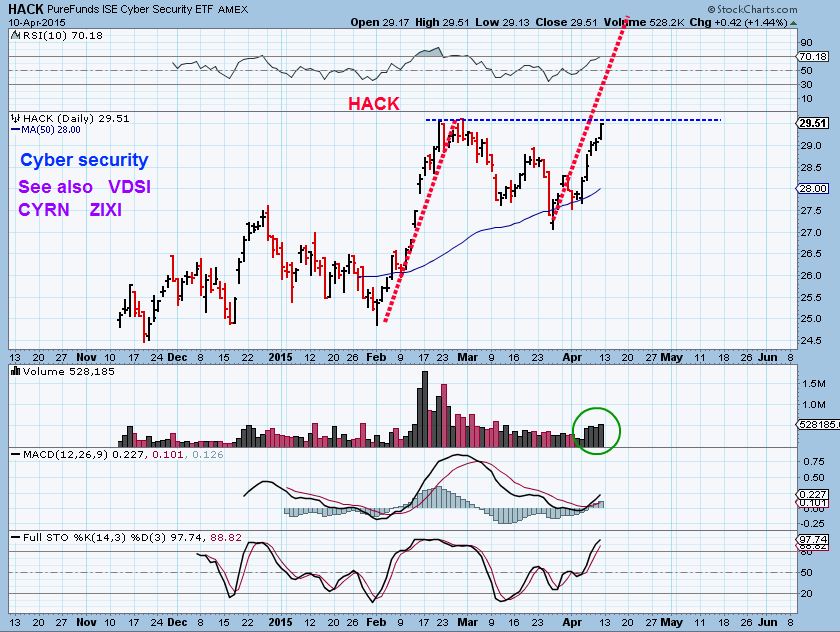
HACK – Cyber security is bullish, see the next stock too
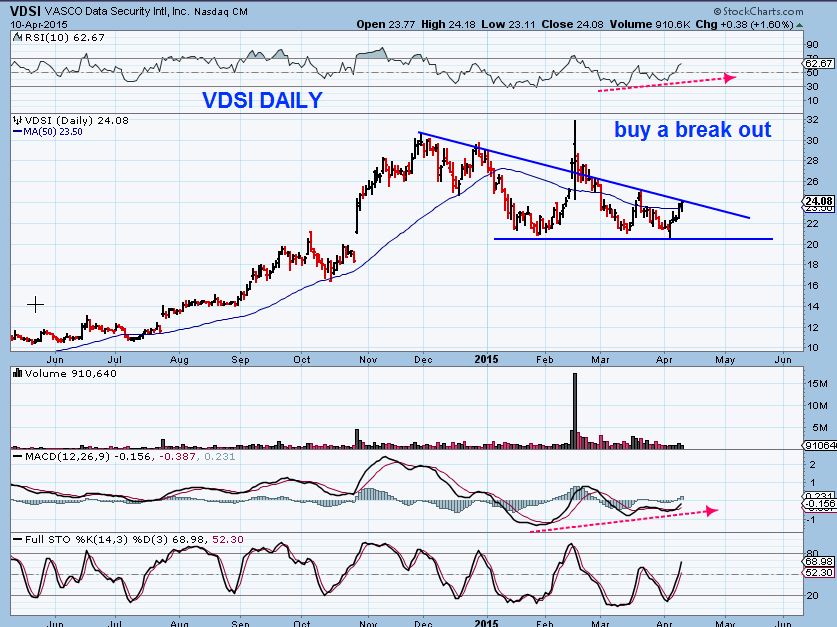
VDSI WKLY & DAILY (HUGE RUN UP) Flagging? $6 to $30 last yr!
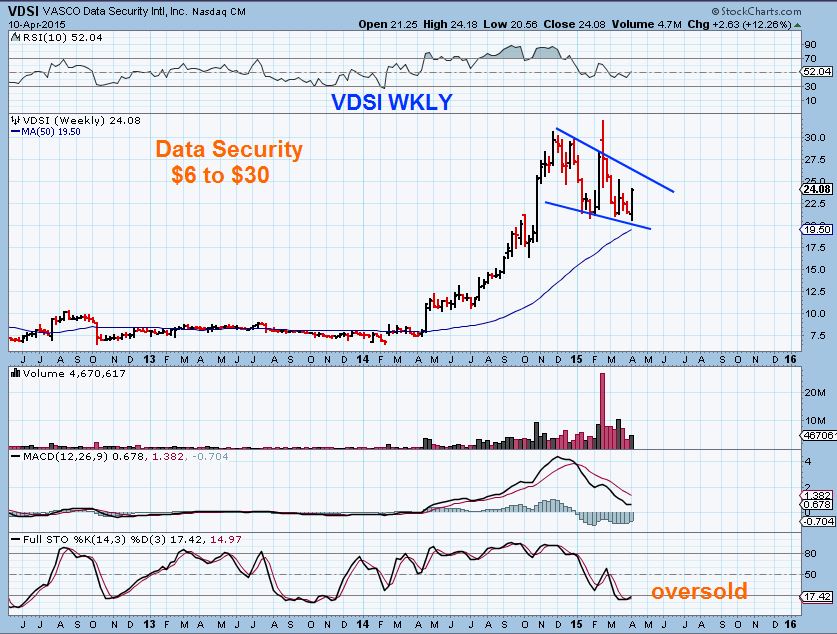
VDSI _ could break out & make a quick run to $30. Buy a break out or a drop to the bottom line.
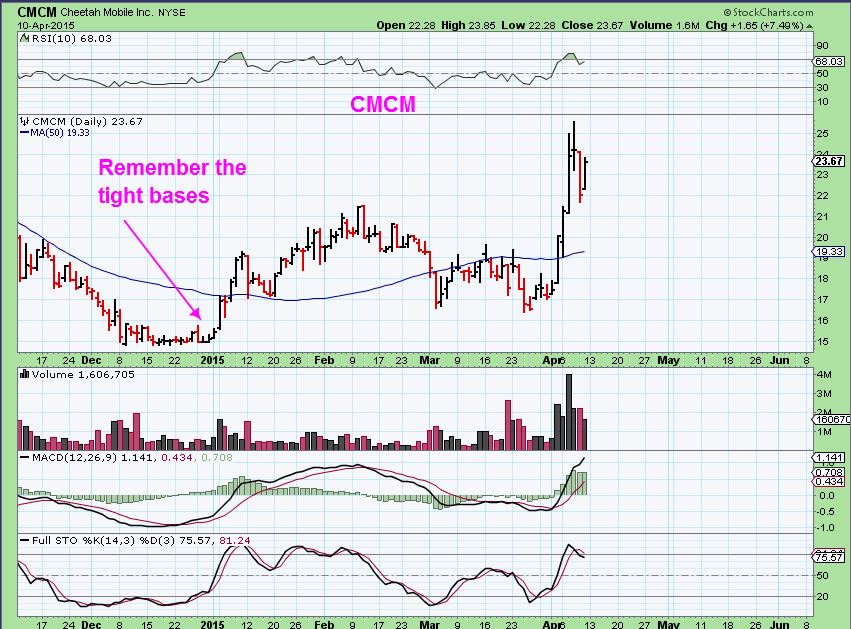
CMCM – I recommended buying a break from this tight base & Triangle in Dec. WHY?
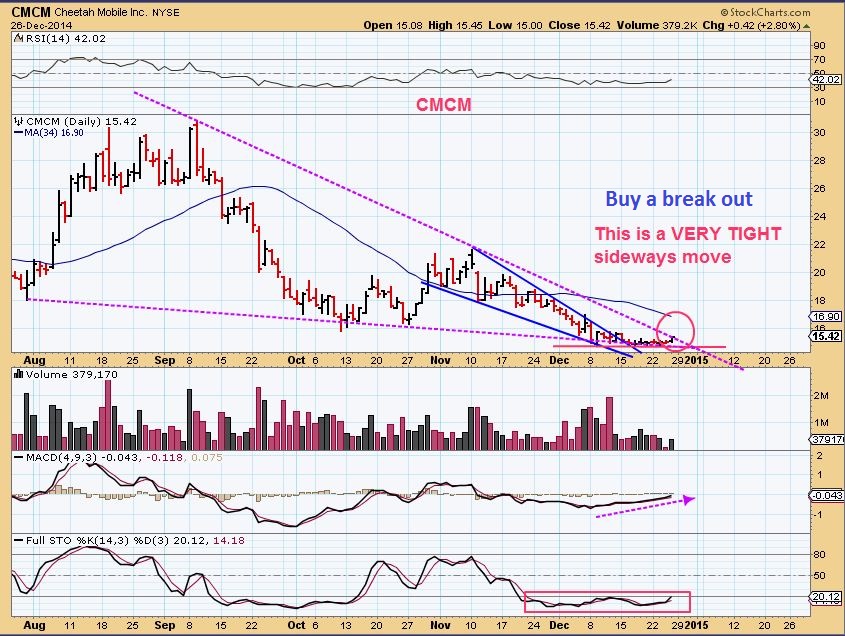
Heres why I like those- CMCM
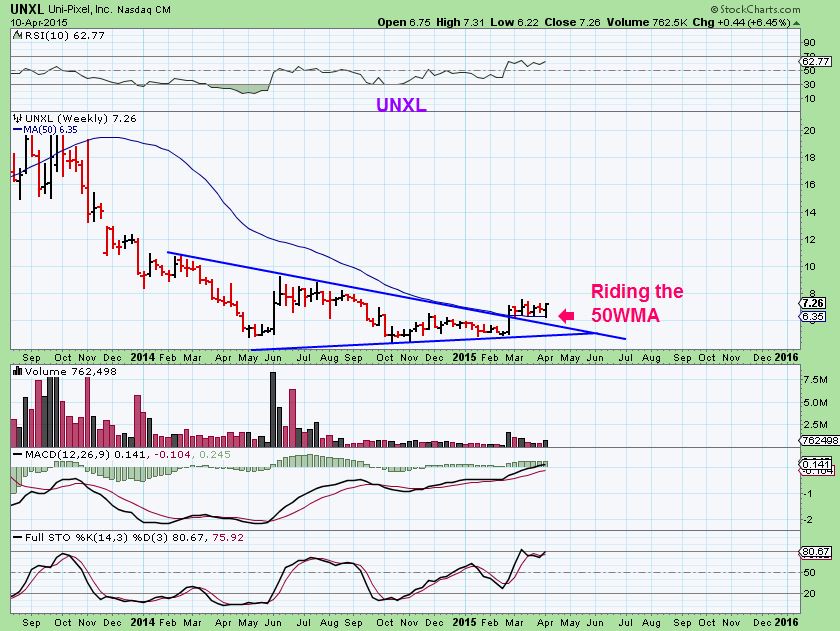
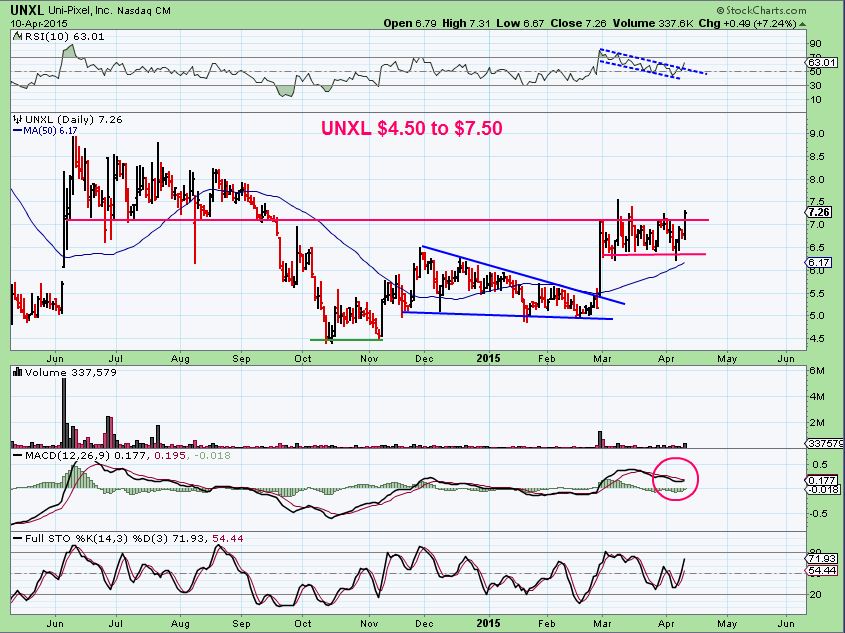
UNXL – These charts interests me.
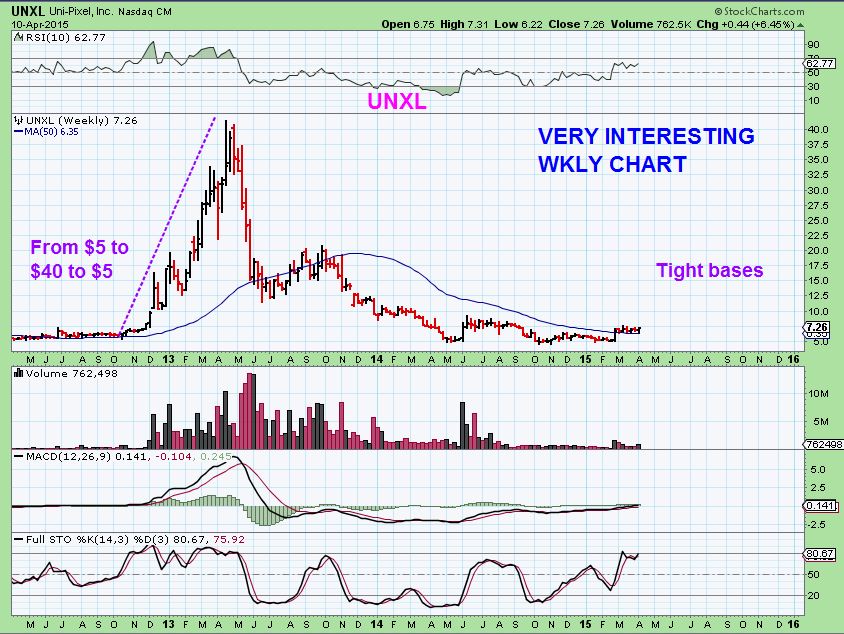
Closer view- It may be breaking out, but if it drops to the 50WMA again I may trade it.
UNXL daily close up – Actually could be breaking out again now. See the RSI & MACD
I still like the set ups on the STEEL stocks too X, AKS, STLD, etc
CHINA 
 A Quick Look Underneath
Scroll to top

Thanks ALEX, excellent done, also thank-you for explaining NAT.GAS.
Ur welcome Geurt ( Natgas Could be at a bottom)
(CAT) looking good to me also. Might consider it as a core holding as miners want up. Will honor stops 🙂 Thanks Alex.
I like it too. Some of the Miners actually look set up nicely too. (AUQ merger talks?, Nice pop today)
CAT earnings in 10 days (23rd)
Thank You! I have tight stop on this (CAT) as it may tank if earnings are bad, and many expect lower EPS.
$NG did indeed reverse off that Fri close. At what point would you consider the reversal complete? A close above 2.56-2.58? Sound about right?
That does sound about right, but I personally jump the gun a bit because I am in front of the screen. (Shh) I ahvent entered a position yet, and i would start small & add on conviction type layering in.
The prior lows were $2.56 & $2.58…so a close at $2.60 would be fairly convincing.
Sounds good, thanks
Seeing the red to green move -Looks like I jumped in early @2.50 tent tiny position 😉
I recommended ARWR last week. HUGE gap open today and now closing the gap, may still be good . Watching for the gap fill & then start rising again. REFRESH for those 2 charts below
ALSO SHIPPERS ( FRO – SINO-NAT-NM -ETC seem to be gaining from storing OIL until they can sell at higher rices).
Do you still own LGCY Alex?
I bought last week @ 11.00
Yes, It broke above the downtrend line , and it is slowly moving higher, but its been up day after day. I like the steady progress so far
Great stuff as always Alex.
Hey can you please take a look at EBR for me? Some really tight closes on the daily, would really appreciate your unique take on the chart as a whole.
Cheers
Matt
Thanks matt
EBR Popped up on strong volume & now has only done a sideways consolidation. Thats usually bullish as volume dries up (no sellers). and it is allowing the 10sma to catch up.
the only bad part is the Gap under price, but it doesnt have to fill that.
Noteworthy is the fact that the weekly chart is quite Bullish . Esp with that sideways move.
I will add a chart in a minute
Again, the only bothersome point is the GAP down at the 50sma. It could fill with the 50sma as support. Chart is click able
Legend, thanks a heap!
As mentioned in prior reports….SOL, TSL, CSIQ, CSUN, JASO all still acting correctly. YGE got slammed at earnings and now recovering. Solars still looking to be up trending .
SOL nice little stair step recently.
I think we missed the boat. I wouldn’t jump on SOL now? Maybe one of the others. FSLR isn’t budging.
Hi Alex. RGSE has drifted down since end Feb. Looks oversold. Is it on your radar for possible re-entry?
Hey Conrad- I was watching them all and RGSE & YGE seemed to drop more than expected , with YGE recovering. I am watching RGSE for break up over the 10sma.
I know it looks extended, but HQCL is interesting too.
BAS getting hit today on a downgrade. Looks like I will get stopped out with a smaller profit.
Yes, I was taking note of BAS as well. I assumed it just had such a good run, that it was due to correct. Its down 61.8% so I think we can expect most of the selling to be over. Hopefully.
Maybe a decent time for an entry on the dip?
I would look at the chart & use a 50sma ….see FEB 9? We may get the same thing & then an inverse H&S
refresh for chart
Yep, thanks Alex! Like you said, so many great setups!…I gotta narrow down the list 😉
I know, So many. I hate when I have a few on the list and they explode and I didnt buy.
I honestly had BLDR on my list . I wrote “Cup & Handle, $6 to $7 , watch the handle / pullback. Today= BOOOM
WOW!…what a move there!
Looks suspiciously like a rising 50DMA to me
Good discussion guys, was wondering what had happened to BAS today. Could be a buy tomorrow, we’ll see!
I wouldn’t buy until I see some recovery. Remember GDP a month ago? It was rocking, they announced they were releasing more shares and it just kept going down. Eventually came back, but, be careful.
Missed it. Entry lasted about 10 minutes….oh well. How about SFY right now?!
Alex, nice call on DQ two days ago.
chartfreak’s on fire……(drop mic .. walk away)