
Keeping An Eye On Things
This was a great week of trading. Oil broke out and all of our energy stocks put in some strong gains as expected. My call in NATGAS played out exactly as outlined , and this could play out nicely for traders this week too. Lets look at some charts and see how things went in other sectors too , and what we might expect moving forward.
SPX – I have been showing a bearish rising wedge pattern, like in my April 10 chart. We had more upside, but then the markets did start selling off Friday. Is that it?
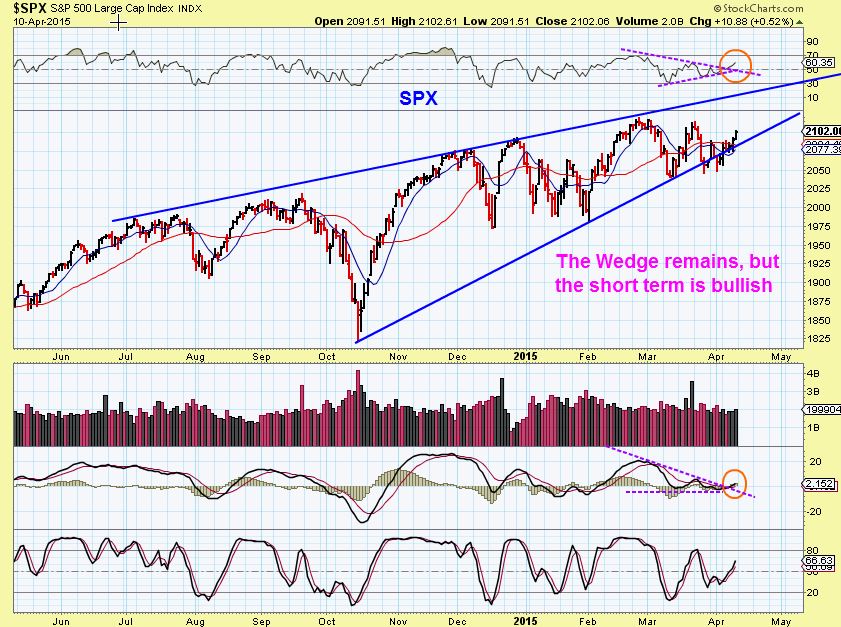
I also want to show you something else.
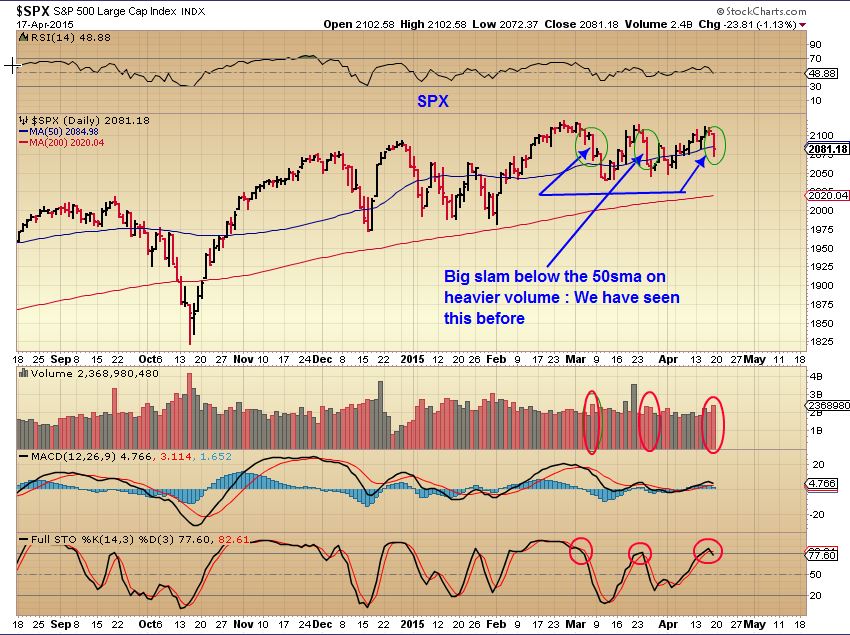
SPX – Though the markets did sell off quickly Friday , it may just be what we have seen in the recent past. A few quick down days and then the BUY THE DIPS crowd returns. Some charts of individual equities still look good, so we will keep an eye on it.
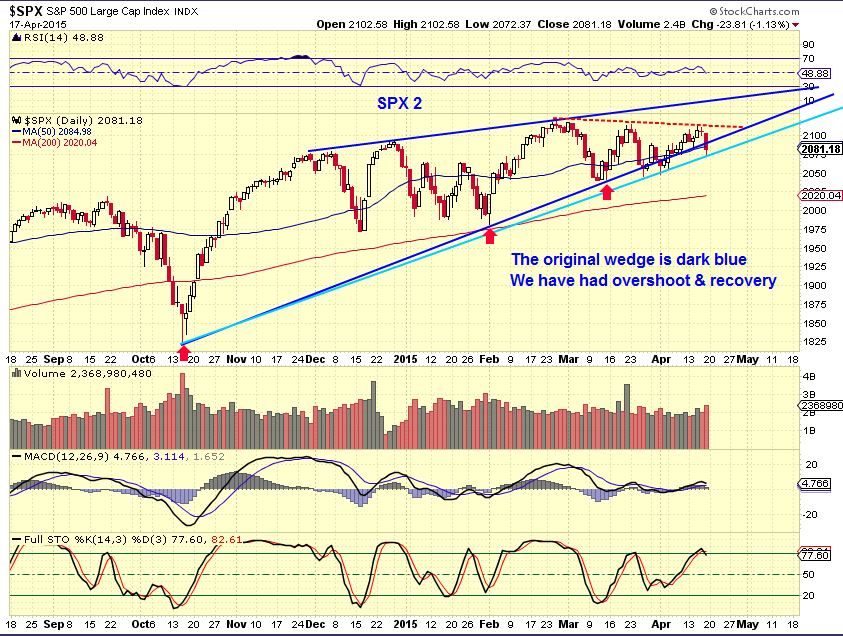
SPX daily– Notice the light blue line. It shows that recently we have dropped to it & recovered, so Monday lets see if we break down or recover.
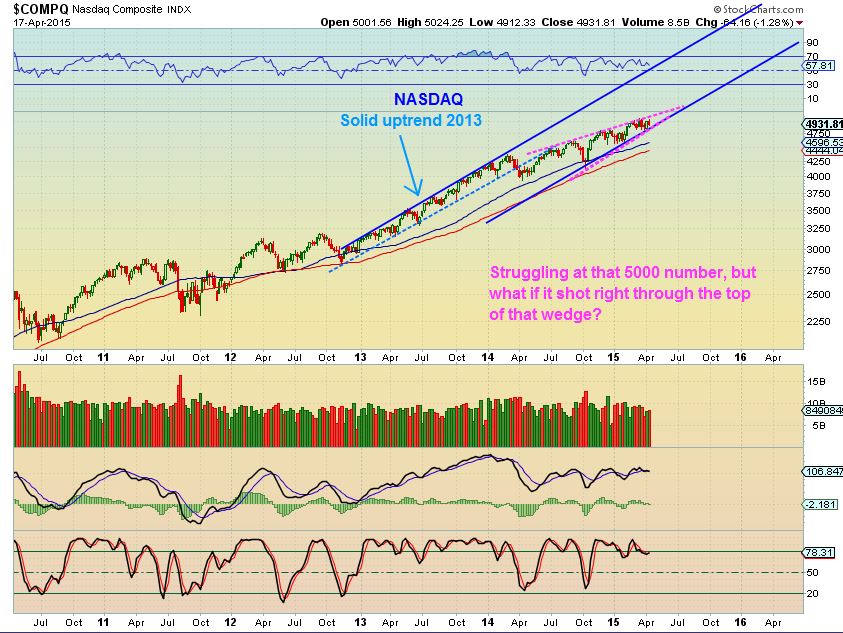
Also this was my NASDAQ APRIL 6 chart (Wedges)
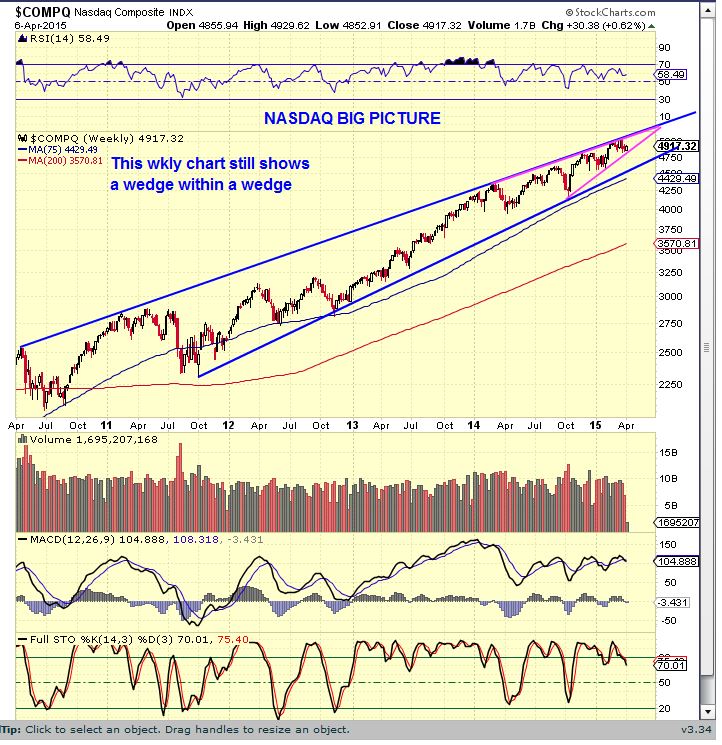
The NASDAQ is struggling at the prior tech bubble highs near 5000.
That is to be expected. SO Is it a double top , since we see wedges ? It may be, but also you can finally get a break through of that 5000 area. IF we broke higher, I just want to point out that you could actually get this. A steeper channel higher. Just a different possibility that we can keep our eyes on.
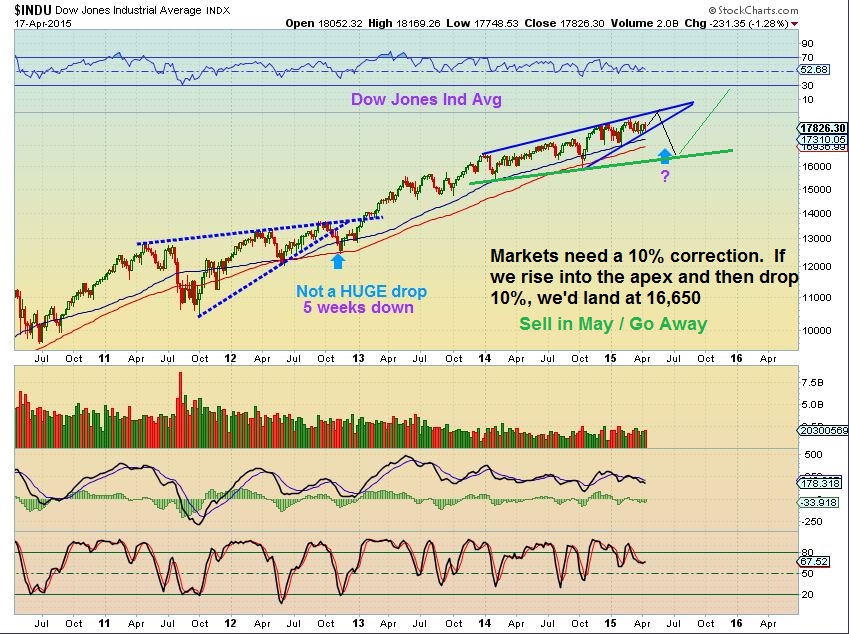
Last is the DOW JONES
We had a wedge in 2013. It broke down (Light blue arrow) and immediately rallied to new highs. SO a wedge & a break down is not the end of the BULL necessarily. The markets really do need a 10% correction to remain healthy.
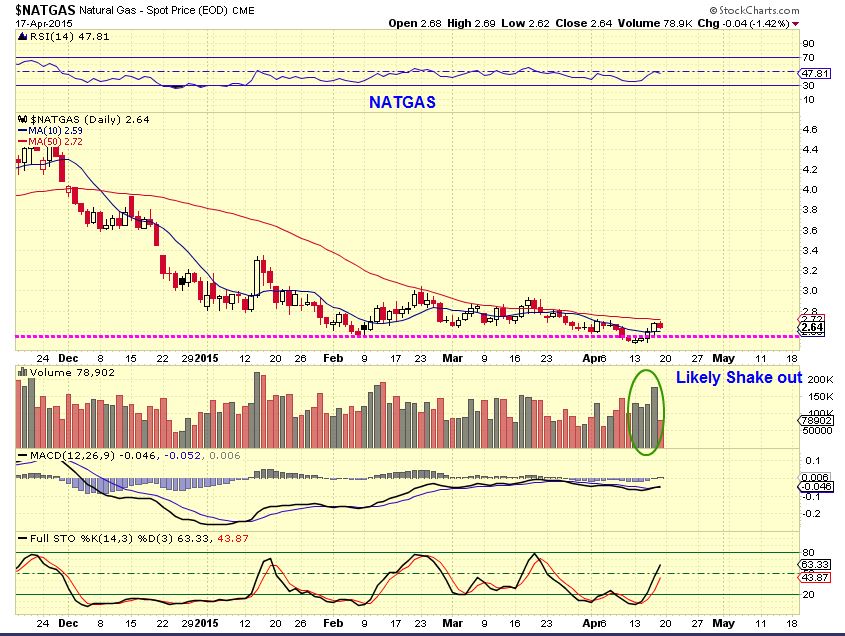
NATGAS WKLY– We got the shake out that I mentioned. I like the volume levels. I expect NATGAS to rally and I’ve mentioned that NATGAS Stocks were way ahead of this move. Traders can trade UGAZ – but any sideways move will add to decay. We are down in Pre-Mkt, it could be a buy opportunity for the nimble.
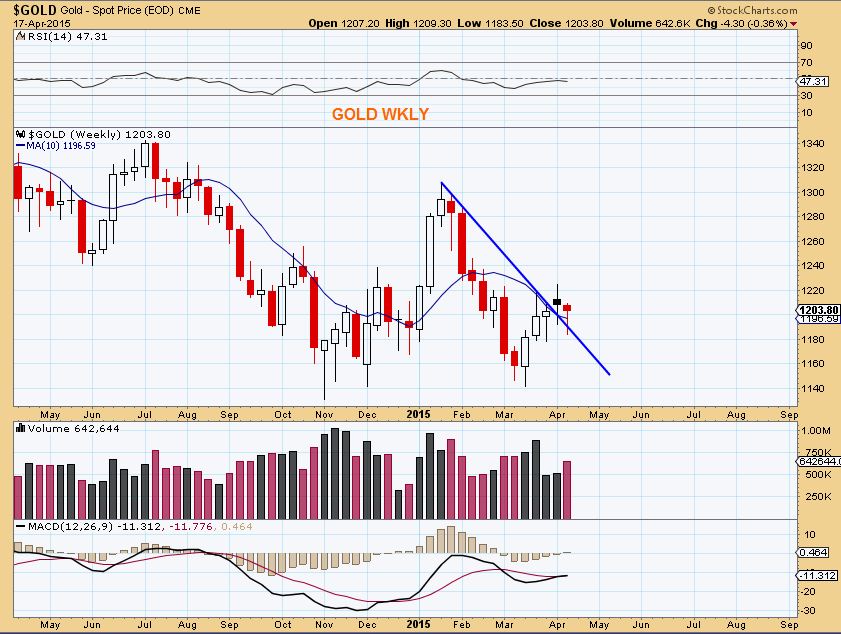
GOLD WKLY – It is a reversal candle and held the trend line break out. Closed above thew 10 WMA and MACD cross . These are all bullish in T/A.
GOLD DAILY
Was that a daily cycle low on day 19? Some think so, and it may be. If gold pulls back, look for it to hold those April 14 lows at $1183.50. I can still picture this dropping further into a daily cycle low as drawn. Why?
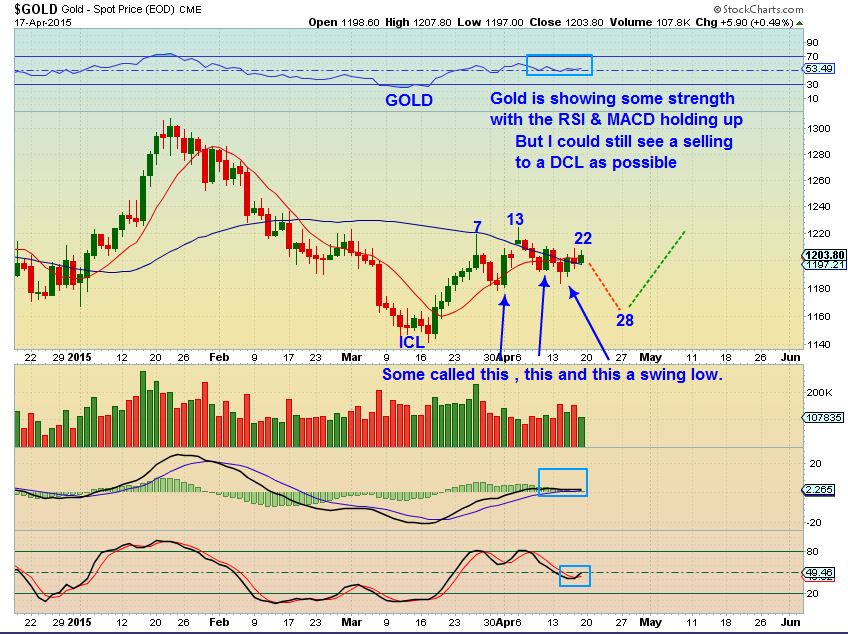
What I didn’t like was that on Friday GOLD closed up $5.90 and SILVER & GDX closed down . I have often seen SILVER & MINERS lead Gold. Personally, I’d like to see GOLD dip & SILVER & MINERS hold up.
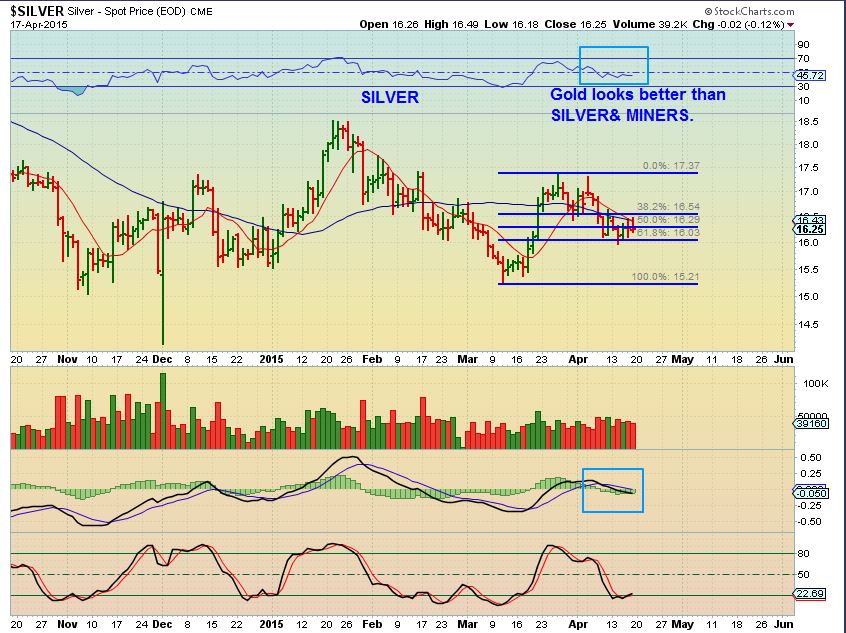
SILVER – Closed down Friday. 62% re-trace. Weaker MACD than Gold. CLosed under its 50sma. Does SILVER still lead gold? Time will tell.
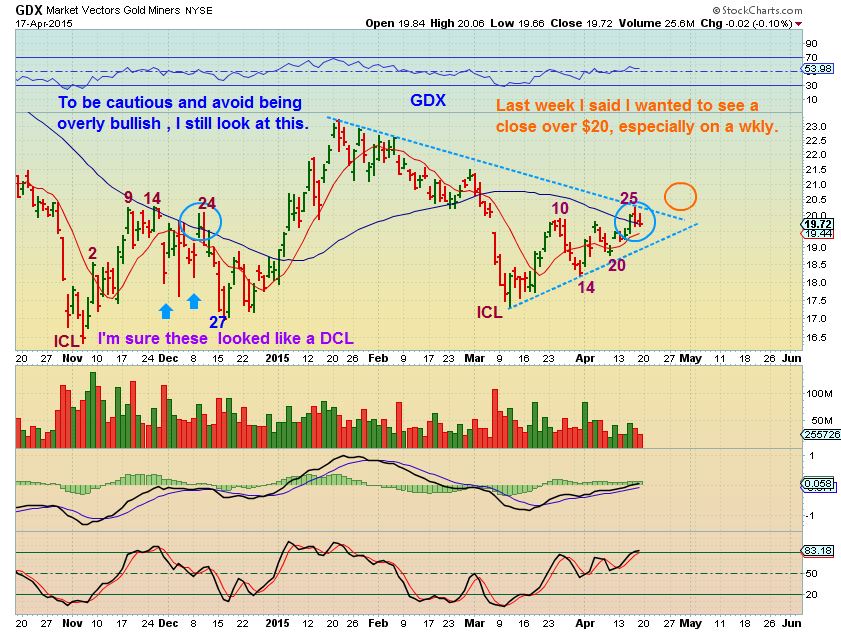
GDX- Closed down Friday while GOLD was up $6.
When I look at this chart and look at the first daily cycle out of NOV’s ICL , it looked fine on day 24- just above the 50sma (like now, blue circle) . Then GDX slammed down for a week into the dcl day 27. IF that happens now, we will have an excellent entry. If we break out higher& close above 20, you can add with a tight stop.
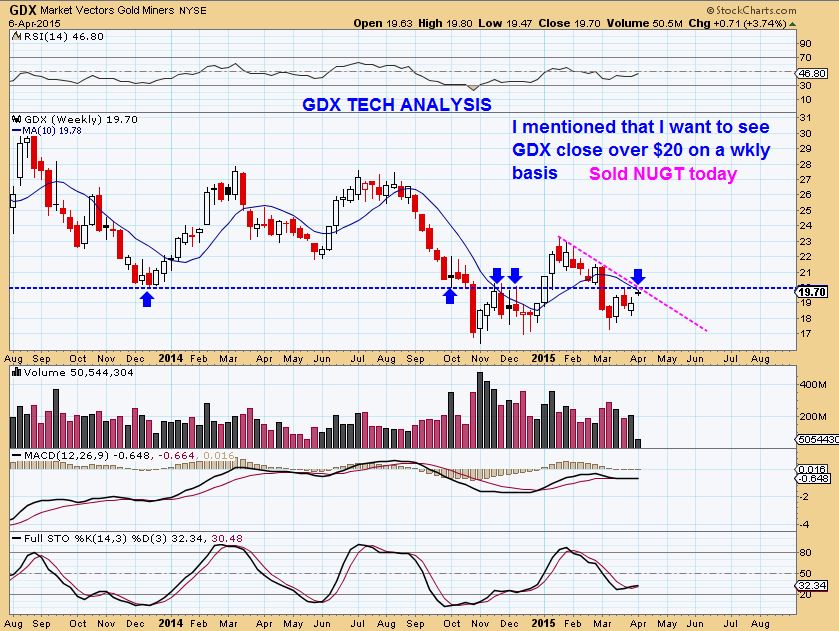
GDX WKLY- Using T/A – the weekly looks much more bullish than last NOV-DEC with the MACD. Still no wkly break out though. No close above $20.00+
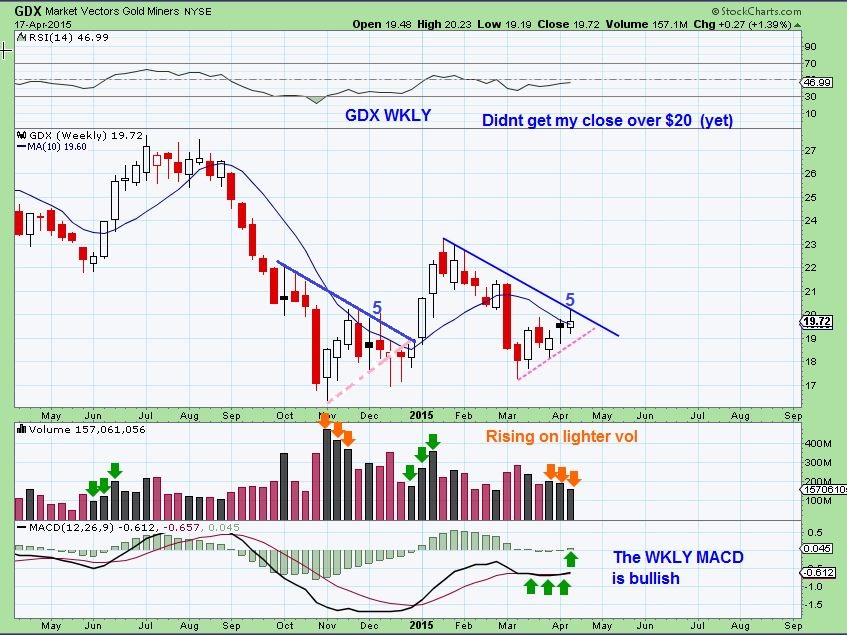
This was my APRIL 6th WKLY, and you can still see why $20 is important to me , for GDX.
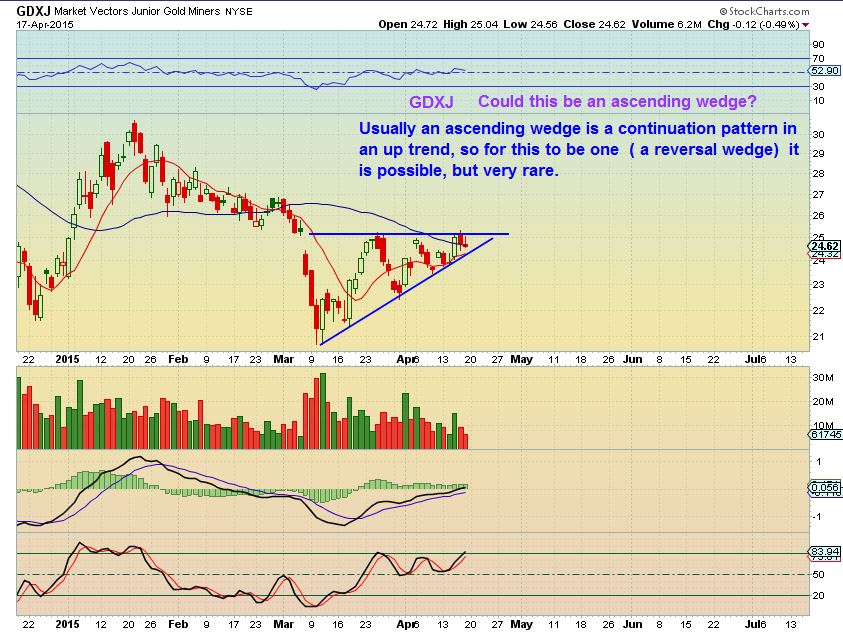
I got an email from a reader (Thank You J ) Asking if GDXJ is an ascending Wedge? They usually break out higher. It is possible, but they are more reliable in an uptrend. Is this a reversal off of the bottom / Ascending wedge? It is “possible”, but less likely. So I just thought that I would draw it and point out this possibility too. We’ll keep an eye on it.
The MACD on GDXJ is actually quite bullish
I saved OIL for last. We had a great week last week in oil stocks, and Friday many took a break.
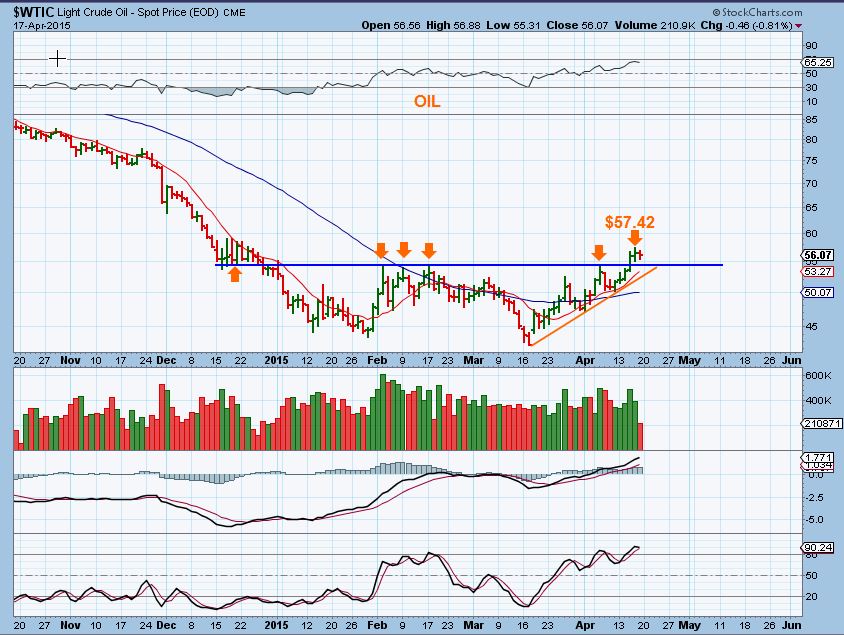
APRIL 2 – 1st Target $57.12
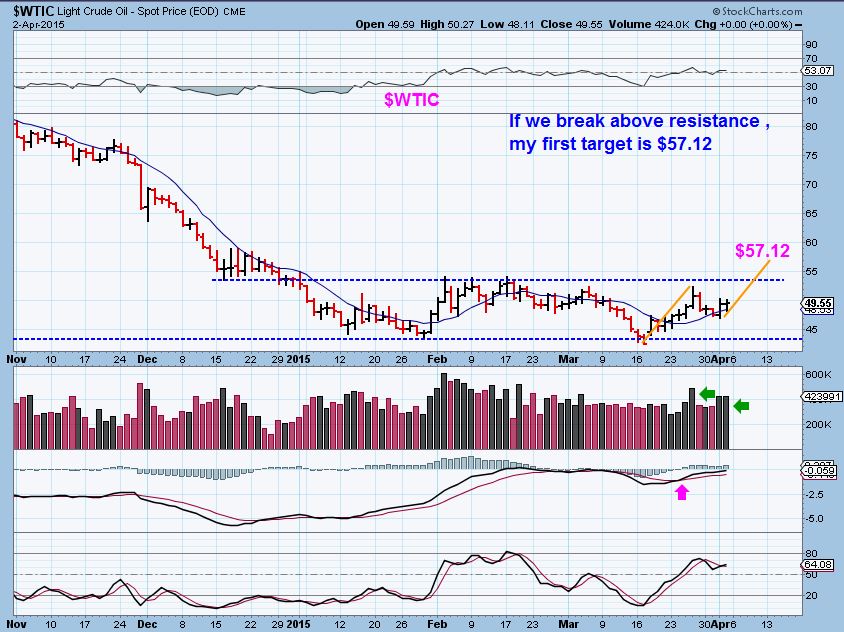
OIL hit $57.42 & stopped & dropped a bit. As I have mentioned, I believe there is more upside. And if OIL moves back to the 60’s, 70’s, even 80’s? This could be the beginning of some more great gains in the energy stocks.
Note to you- I have MANY READERS HERE. You all have different goals. Some hate to sell and see their stock keep going higher. Others hate to watch it run up, then see it pullback and give some gains back. so –
When you enter any trades, please have your own plan to lock in some gains. What is your goal when you trade?
– Is it short term, just scalping gains quickly? If it pops 10% or more, just sell it and forget about it, wait for another set up in another energy stock or miners or tech or biotech, etc.
– Are you trying to just hold thesefor bigger gains longer term? Many expect a recovery in OIL and despite the ups and downs you are going to ride them out?
– Do you just want to try to get the most out of a second run higher, since they seem to come in waves ? Then you can just raise stops as price rises and lock in gains when it pulls back.
Mini Lesson (kind of)
With the above in mind, I now want to show you what I am thinking and as a trader / investor – I want to keep this in mind. You could trade this scenario, or buy & hold it.
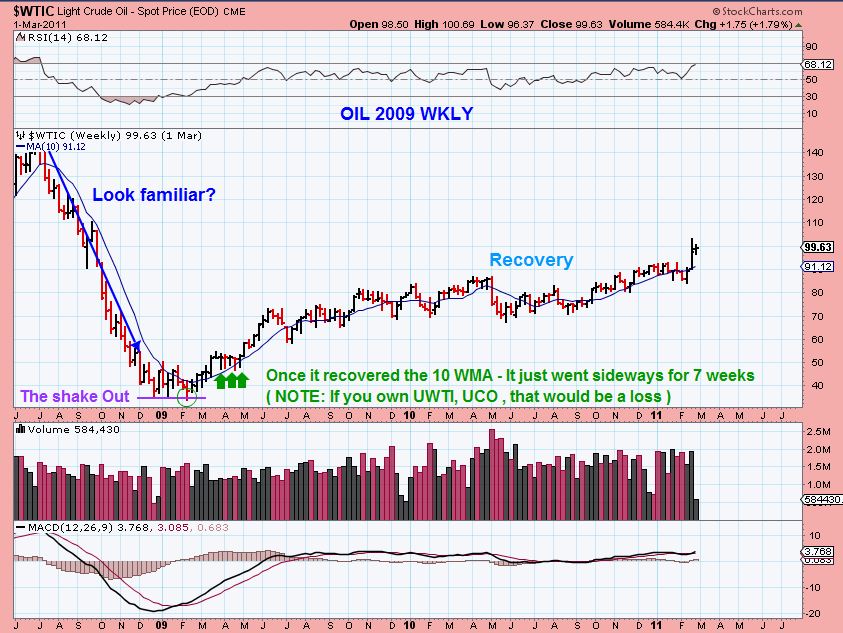
Some Energy stocks are up 100% off of their lows, but the potential for longer term holding could be much greater. I keep saying that This OIL sell off looks very similar to the 2008-2009 sell off & recovery in oil. Lets look at that again.
First off, it wasn’t Straight up each week. There was a period of weeks in OIL where it just went sideways, so trades in leveraged ETFs like UWTI & UCO could be futile. Notice after re-gaining the 10WMA, OIL went sideways for several weeks.
HOWEVER, I want you to see what some ENERGY stocks did. People keep asking me , “Where do I sell?” That is why I am saying , “I do not know what your goals are. You should have a plan as you enter the trade. Are you just here to Scalp a 10% gain? Would you rather try to let it run a bit? Ride it for the possible entire recovery?“
Ride it for the recovery? Is that a plan??
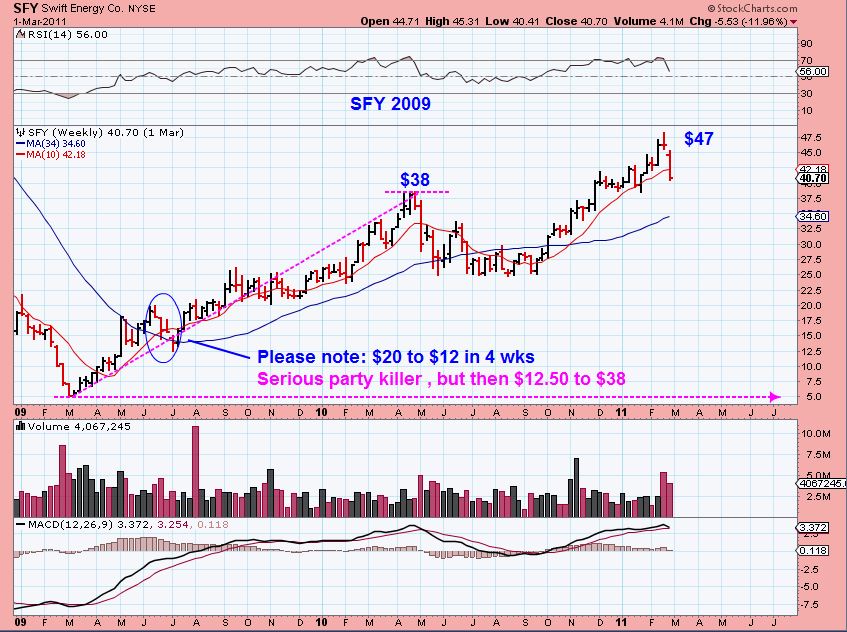
SFY 2009 $5 to $38 in 1 year. Notice that it then pulled back , and continued up to $47.
$5 to $47!! 800+%! IF I told you to buy at $5 and sell at $6.75… you might regret that 🙂
REXX 2009 $1.00 to $15 (1500% in a year). a $5000.00 investment would have been $75,000 1 yr later. What is your plan?? If I told you to buy at $1 , and sell at $1.45- you might wish you had held?
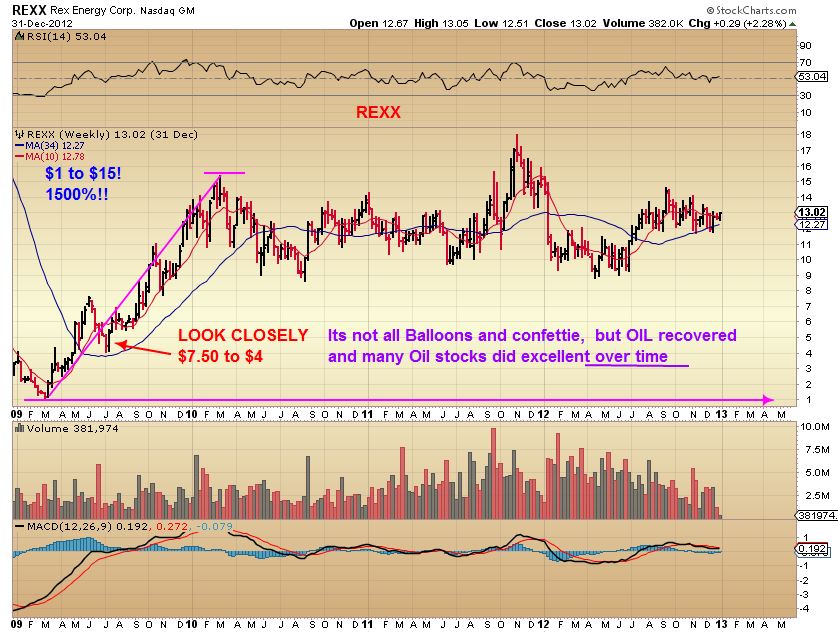
NOTE: On the above chart , please note that in that recovery in June to July 2009, price went from $7 to $4 and then up to $16. So there will be painful pullbacks .
.
So you can see that in Energy, we may be looking at a slow but rewarding recovery if this sell off is similar to the 2008-2009 sell off in Oil. We’ve already seen some great %-Gainers in that sector. Currently we have seen a 2 day selling of Energy stocks and I like the light volume pullback and current set ups there. HERO, KEG, HK , BBEP ,BASS, EXXI, etc have nice set ups. I’m keeping my eyes on that. I also do like the set up in GOLD , SILVER , MINERS, and commodities as a whole. Gold seems to have put in a higher low ICL in March. I feel that would be very bullish, but its stalling right here. Its having difficulty gaining traction , but I do expect some upside very soon, the timing is getting late. I am waiting for the next Daily Cycle low to reveal itself. A Burst above $20 GDX would be a buy with a tight stop in my opinion. A drop & reversal above the recent lows too.
We have discussed Solars, Rare Earth, Uranium, Corn, Wheat, other soft commodities as having the looks of a bottom forming. I’m keeping my eyes on that. And I also still see very interesting / Bullish looking set ups in the equity markets, despite recent selling .
I have mentioned in recent reports a couple of interesting charts. Stocks like X, AKS, S, NQ, UNXL (Crazy move in UNXL Friday) , VDSI, and more . I am keeping an eye out for more since Fridays pullback. It may or may not be done.
NATGAS pulling back is another area that I am watching . A few quick trades in UGAZ for nimble traders with experience in 3x ETf’s may be possible.


Alex, T/A? What does that mean?
Sorry , Technical Analysis ( I use that term when comparing chart analysis , because I might be saying that using T/A this is bullish, but using cycles its isn’t. that kind of comparison).
Watching some of these ENERGY stocks drop & recover with nice volume. I am watching them tag the 10sma (GDP broke thru & reversed quickly). I like these set ups , but I dont like to buy in the first hour as much as I like to wait until noon and see if we get the usual mid day dip.
NADL has large volume
Looking at SFY with only an 8 sma. Interesting.
HERO / BBEP / KEG may be bull flags , etc
I did add to NADL , just because it is low price and has nice volume so far.
Yeah I bot NADL last Wed on the retest of the 50 dma (in at1.55); that’s working out great! Too small a position of course. 🙂
I bought lower and added today. Strong volume right off the bat. It likely will run to that high volume Feb 9 candle -dont sell yet ; )
I was looking at NADL, but didn’t buy it.
Yeah Bill, I remembered you said you figured it’d take off soon, I actually thought you were in it. When I look at the longer term charts (even 8 month) the upside potential looks great . Even SFY above $3.50 really looks like it could move.
Disappointing close after solid morning action. But I’ll take a green day over red anytime.
Even with market up huge today and IBB up, small cap biotech took it on the chin. Warning of possible future risk aversion? As in market can go up but not everything with it as in the past few years…
URANIUM – UEC!
URZ, URRE, UEC, DNN
MCP, REE AVL (Rare Earth) REE looks like a nice set up. Similar to what GURE was
Yeah, that is an interesting area. I hadn’t looked at it lately.
Yes, I noticed. I bought REE last week. Looking good accross the hole sector.
nice…tx 4 posting quickies… fyi that TPLM u featured b4 has been doing good as wellllll …. 😉
Yeah, reversed off of the 10sma this a.m. too. k Nice. I like the way these are acting. Not straight up only to crash, but run & consolidate. It is healthier long term.
energy looks like it is it. everything depends on gm though. as long as gm fine money is going there.
So far / So good.
Alex, Do you ever consider selling a energy stock that has had a nice run (CLNE for example) and use the cash to buy something else that hasn’t really taken off yet in the same sector (say WRES )?
Hi Bill, sorry for the late reply, I was out for a while-
Yes, as a trader I do that all the time. If I have accumulated a large position near the lows, I will sell 1/2 if it had a nice run, or more if it gets too extended.
Hey Alex,
Any thoughts on Sprint? Been holding for awhile and going nowhere fast…thinking it might be time to redeploy. Thx
The set up is still ok, it seems to be slowly climbing the 50sma, but if I bought it hoping for a quick POP, and its just crawling along, I would definitely consider re-deploying if I see something else I like.
I did think it would do a quick pop, I do not own it.
Thx. I didn’t see anything bad…but nothing ‘good’ either, so wanted to get a second opinion. 🙂 Thx as always for the great work on the site.
Fleshy, there getting bored with you, but will likely give it a few more. Although not popping is holding up ok, way better than it moving strongly against you. I grabbed mostly for diversification since rest of my trades were mostly in only 3 sectors.
Alex, any thoughts on adding to SZYM or SOL? Looks like they’ve weathered some profit taking.
Good add point would have been this morning near the 10DMA. That stock makes quick moves.
Thanks Carl. Agree, looks tempting to me. I probably missed the optimal point at which to add today but long-term it looks very attractive to me. : )
I really like it at least for the intermediate term. It moves fast so may head back to that area again. Would have picked up more myself but was still sleeping.
It is difficult to know for sure, but the reversal off of the 10sma was a good place for a longer term entry. If you look at the chart I added here, you can see that SZYM did a very similar reversal in March, but dropped further, so there is a “Possibility” that we get a little lower still.
.
Is NG/ UGAZ trying to make that huge red candle before the trend reversal..jeezzz ;))
Missed out on some AKS by 3 cents this morning. That’s a disadvantage of being on the west coast. HERO looking good.
Alex, any thoughts on the utilities sector? XLU looks like it’s trying to set up for a run from its recent base. Although its 50 day SMA hasn’t yet turned up, it did move above it today, albeit on modest volume. I own some UTG and it is flirting with its 50 day SMA.
I looked at the XLU this weekend and I like it in many ways. The 1 yr chart tested the inverse H&S break out last summer too, and held on support.
But let’s face it, it’s a pretty boring sector for trading/speculating.
Troy, it sure is. However, I did long-term trade XLU 2013-2014, I just hid it away in a non-active account, let the dividends roll and sold later. 10% is pedestrian by what we think energy can do right now, but it was low risk and paid off…
CS also saw some analysis this weekend on the seasonality of XLU. If equities swoon some into late spring/early summer would likely boost XLU that more closely follows treasuries (and their lack of yield). So positive seasonality, but increased risk in this sector to Fed rate gyrations.
Food for reflection. Thanks Cason!
F.W.I.W. –
TODAY IS AM SEEING GOLD DOWN OVER $11 and SILVER was DOWN OVER $.35— GDX IS RECOVERING TO GREEN.
THAT is what I was looking for . We may be ready to move higher in MINERS and when GOLD reverses and goes higher, it could be the push through the $20 GDX area that I am watching.
Yeah, I was SHOCKED! GLD and especially silver got rocked coming off of overnight session and have held lows but miners don’t care. Normally NUGT would be down 8-10% from this kind of move. Refuse to breakdown but haven’t seen any real upward sustainable thrust either. I really was expecting a crash into DCL; not sure we’re going to get that.