
Still A Wedge?
Not a lot has changed since the weekend report, so lets just look at some charts…
March 20 – The NASDAQ looked due to pullback
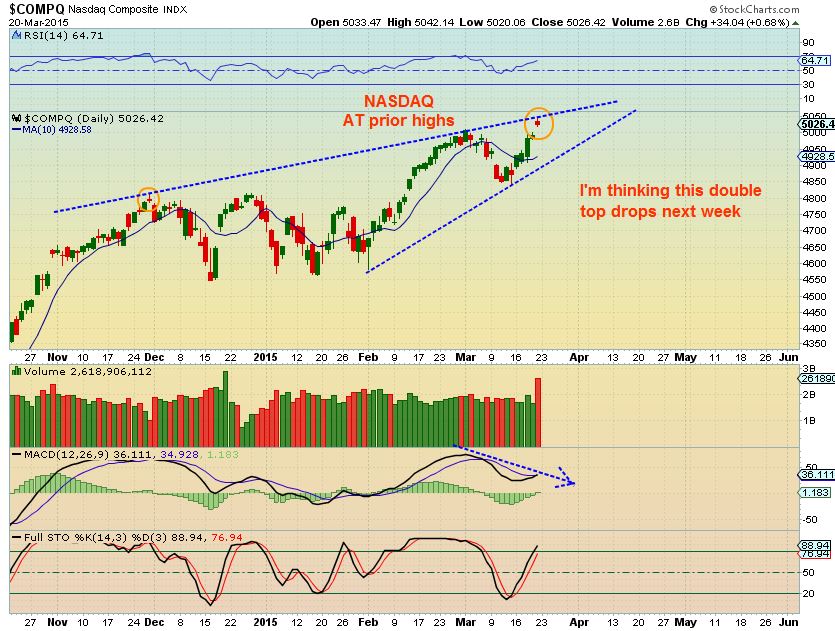
SO did it start to pullback, and if so, how far is it likely to do so?
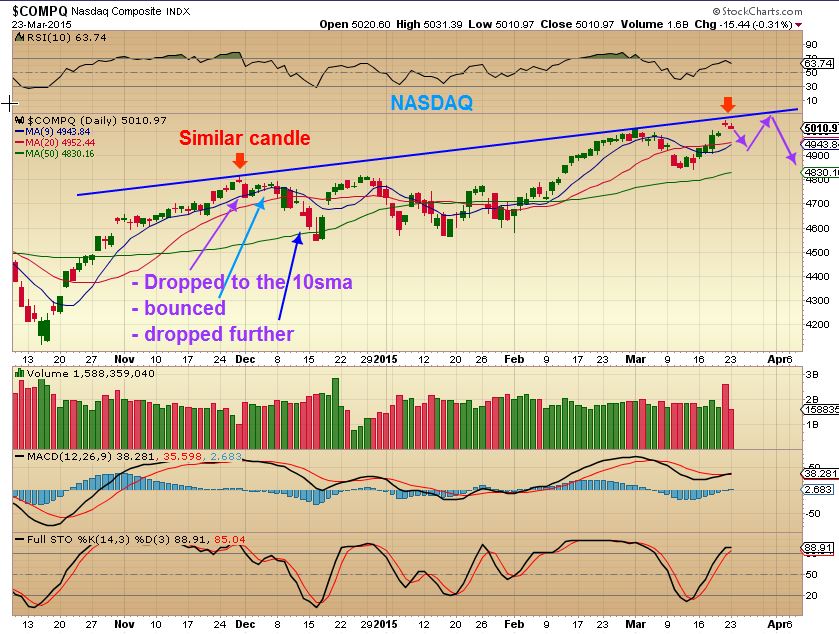
It did pullback today , but the last time it had a topping candle like this (Nov) , it dropped and went sideways I am thinking it will still move higher (Maybe a double top) Why? Because the WEDGE pattern isnt really fully complete…
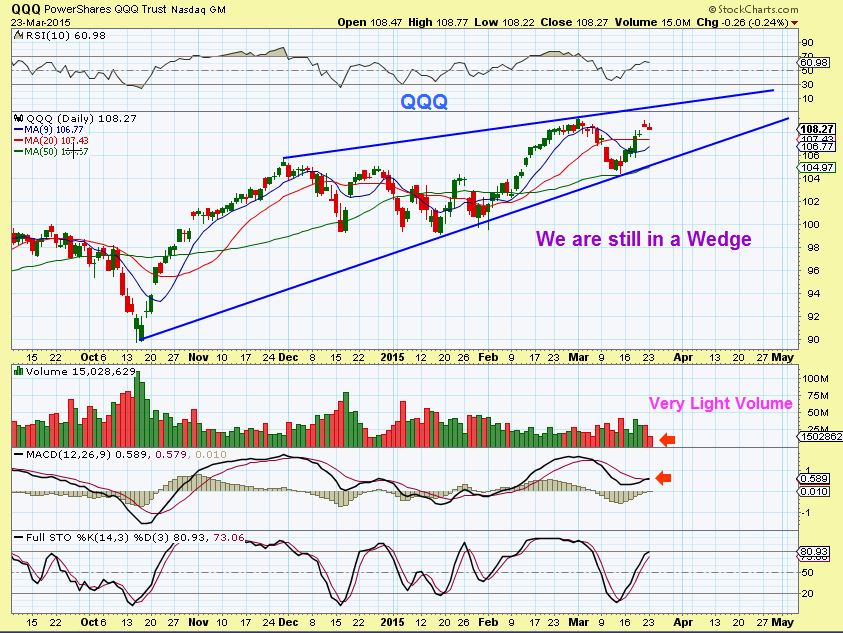
QQQ – The pullback was just a light volume dip / Gap Fill
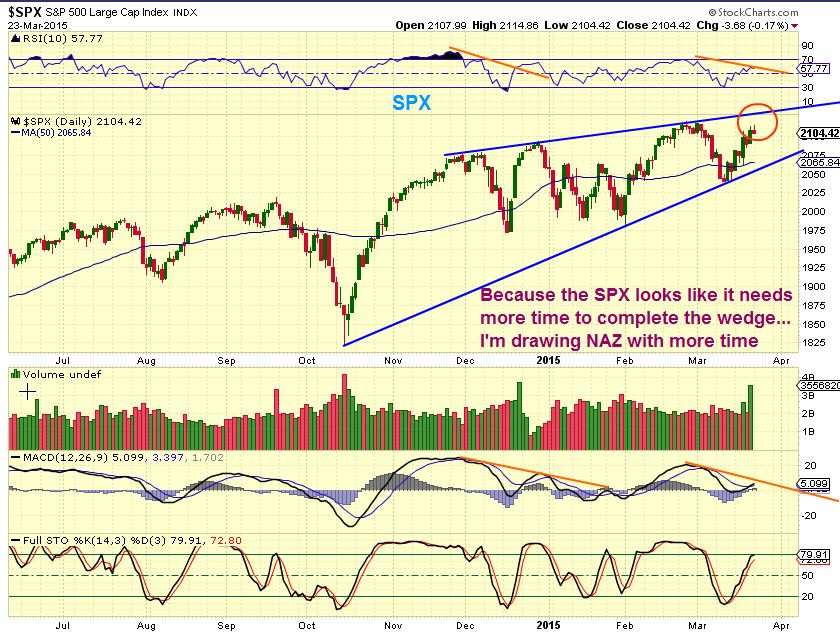
SPX – is also a Wedge that doesnt look complete. Sure, they can fail at any time, but since this has been a strong bull market, I expect a move closer to the apex.
SO since the Dollar started dropping after the Fed Mtg, Gold/Miners & other Commodities have responded positively. I am wondering though, what do you think will happen if the dollar “Double tops”? Maybe they’ll ignore it? Maybe they’ll lightly pullback? It’s hard to say, so I am going to watching a few things with the $USD from here.
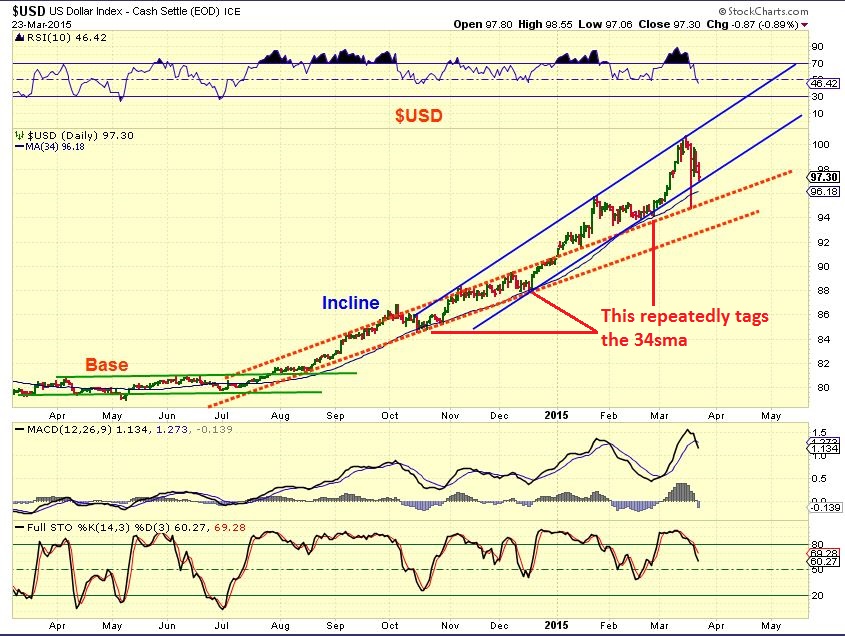
In the weekend report I posted this , mentioning that it could mean the the Dollar has completed its move higher (for now) .
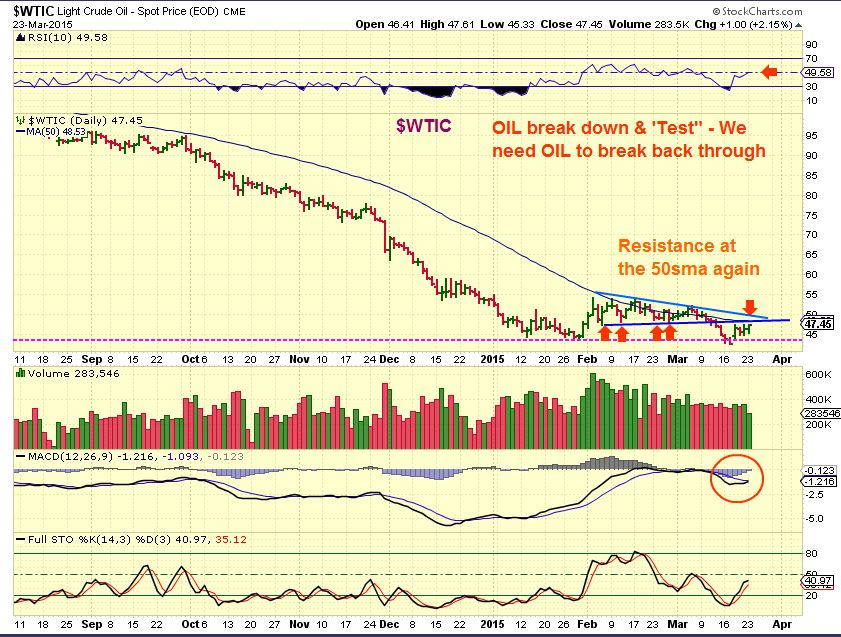
OIL – I have been calling this bottom pretty accurately since Jan, but It’s based on examining the charts. They wont tell me every wiggle or dip and surge, so we just have to expect up days and down. On this chart I am showing that now we are at resistance again. It can cause a “pause”, or price could surge through. I am not concerned at this point, it’s more bullish looking.
1. 50SMA
2. Triangle break down and back test
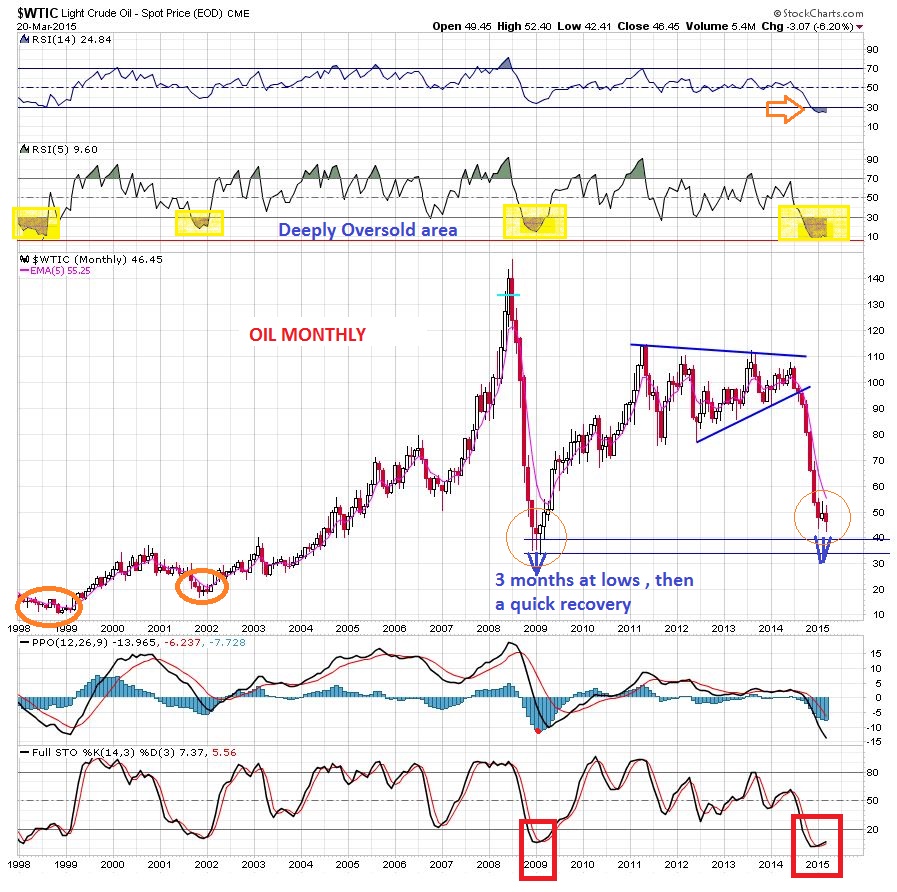
Again I’ll go back to the 2008 lows & ZOOM IN. (Click to enlarge)
NOTICE that after that “Stop Run” that I pointed out in the weekend report, it spent 7 days sideways. It then Popped above on day 8, and dropped back below one more time. By day 19…it was still only sitting on the 50sma. We have to expect Bottoms to “Bottom”.
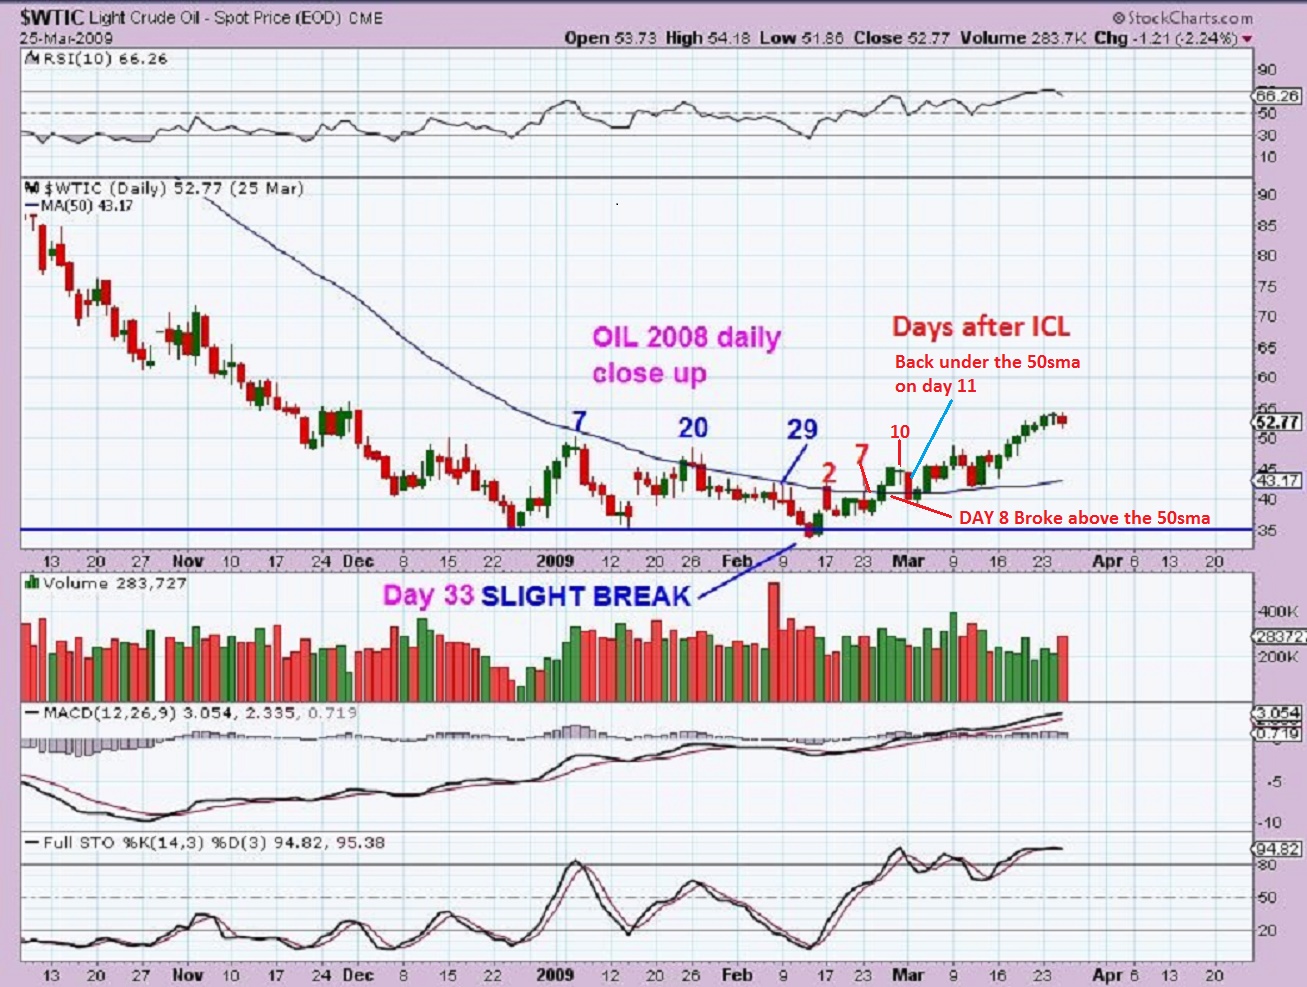
Look at the Monthly chart of oil and you will see that OIL spent 3 MONTHS at the lows, then it really recovered rapidly. We’ve been here for Jan/Feb/March- time will tell. It is as oversold as it has ever been.
GOLD SILVER MINERS – nothing analysis-wise has changed as far as cycles possibilities. Gold , Silver, & Miners are rising and is still within the parameters to ‘fail’ as a 3rd or 4th daily cycle or succeed. I drew this Friday and we are now in that Gap.
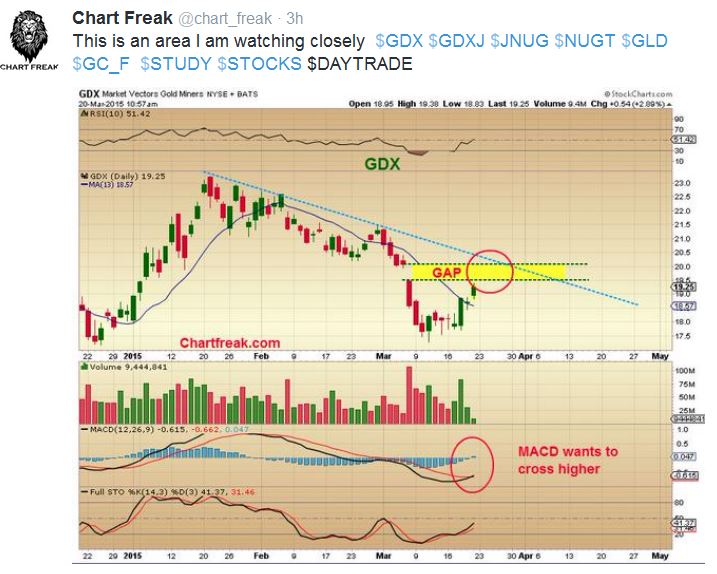
GDX 3/23/2015 – Time will tell. I took a quick 3 day trade in NUGT, and have no positions now.
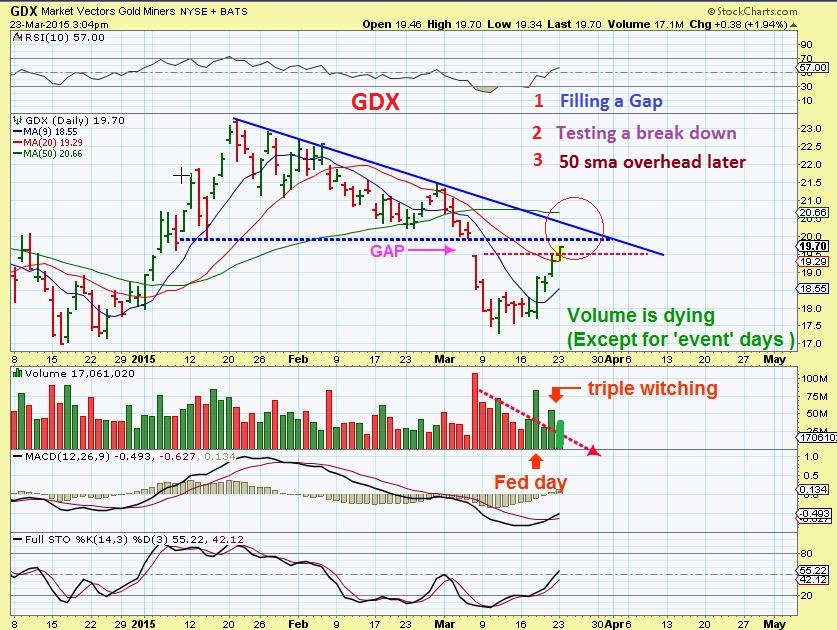
It could be a wedge pattern too, if it doesnt break out higher fast through overhead resistance at $20.50ish. How it drops will be telling too. (Click to enlarge any chart)
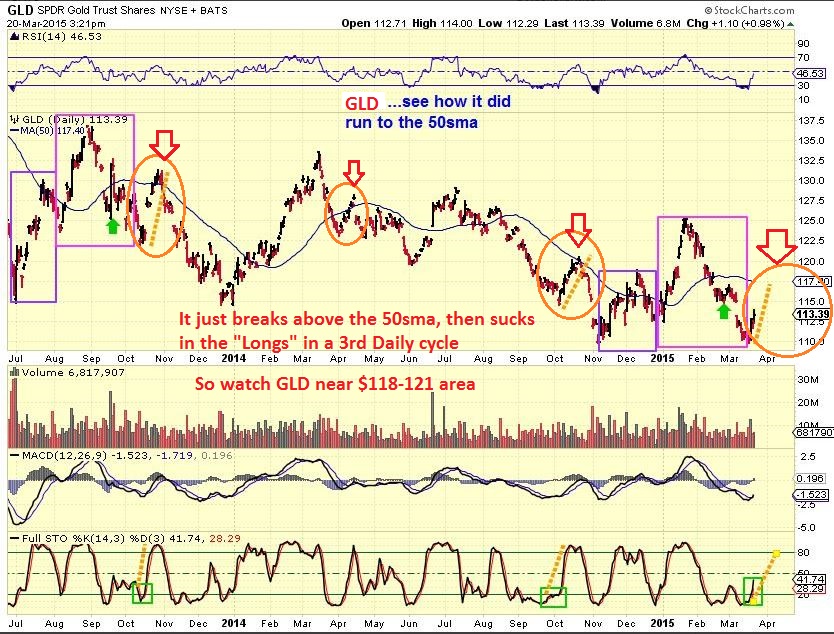
Sorry for this cluttered chart , I drew this for a friend last week . I was simply showing that GLD often breaks ABOVE the 50sma in a late daily cycle ( orange circle) , sucks in more “longs” , and then drops. I am watching that area $117 – $121 area.
IF this turned out to be an ICL (Still cant say thats likely, but the C.O.T. was bullish and SILVER & COPPER seem to be leading – so this feels like Bullish action), we would simply buy the Daily cycle low, and ride the 2nd daily cycle. At this point: Nothing has changed this Monday. The information in the weekend report remains valid. I own Energy & Cash at this point. I will say that I actually love a lot of the Miners set ups right now, but they can turn fast if we are in a daily cycle that is going to roll over. With that in mind, I cant recommend them at this point. We’ll have to see how things play out going forward, right now I think OIL & NATGAS are acting correctly (But they re bottoming, expect ups & downs and lock in some profits if you need to. If you are trading a 3xETF, they are trading vehicles, you must have a buy & sell plan BEFORE you buy them. I have found especially at bottoms, if we get greedy with a 3xETF, they will take it back because they move fast. ONLY when something is trending is a 3xETF safe to hold. As for Metals & Miners? I do think the first part of this run up in Miners has been nice, but they always are, even 3rd or 4th daily cycles and then they drop fast. lets be patient.
.
~ALEX
.
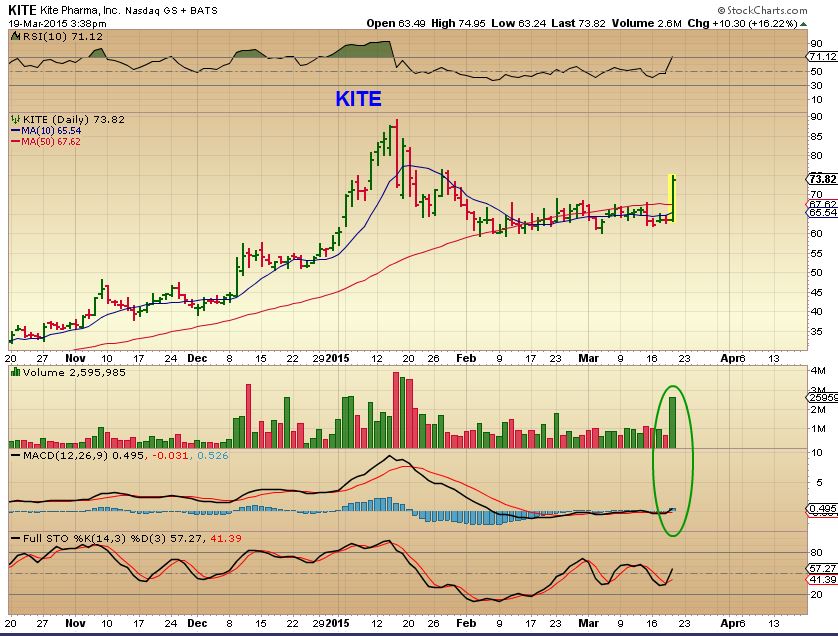
I have friends and relatives that ask me , “What do you think of XXXX?” And I will draw them a quick chart. I also post charts occasionally on TWITTER ( You can see that on my twitter feed at the top of the page). I am just going to post some of those here, for those traders that like to follow charts & can manage their own trades. Some of you just like trade ideas too, so here you might find some. IF I am posting a chart from last week…it may actually even be better now. Really? Yes, I posted the POP in KITE last week.
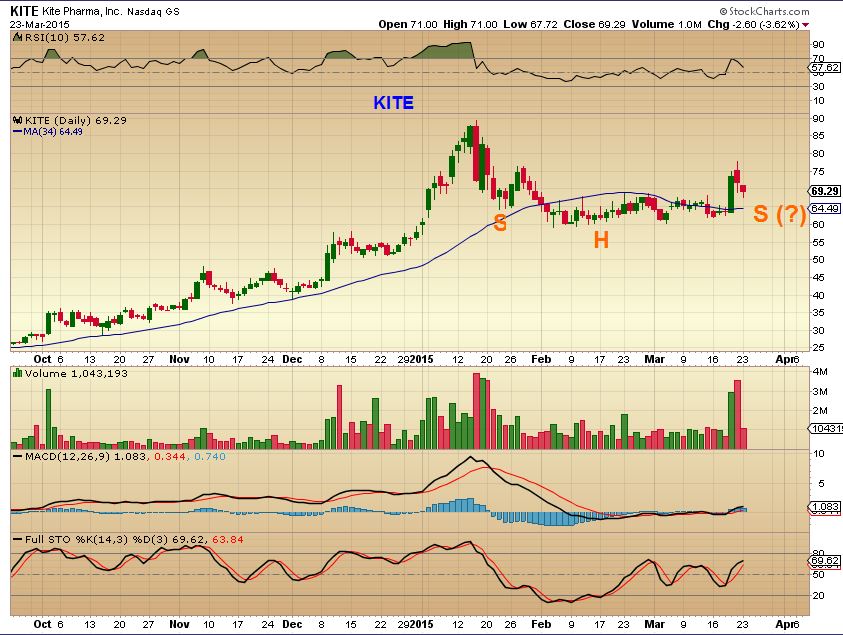
Looks better now – pulling back & possibly setting up for a low risk entry . Inverse H&S?
I still really like the looks of the Solars too. I Tweeted this today ( needs stronger volume, may pullback for an entry near the Orange line)
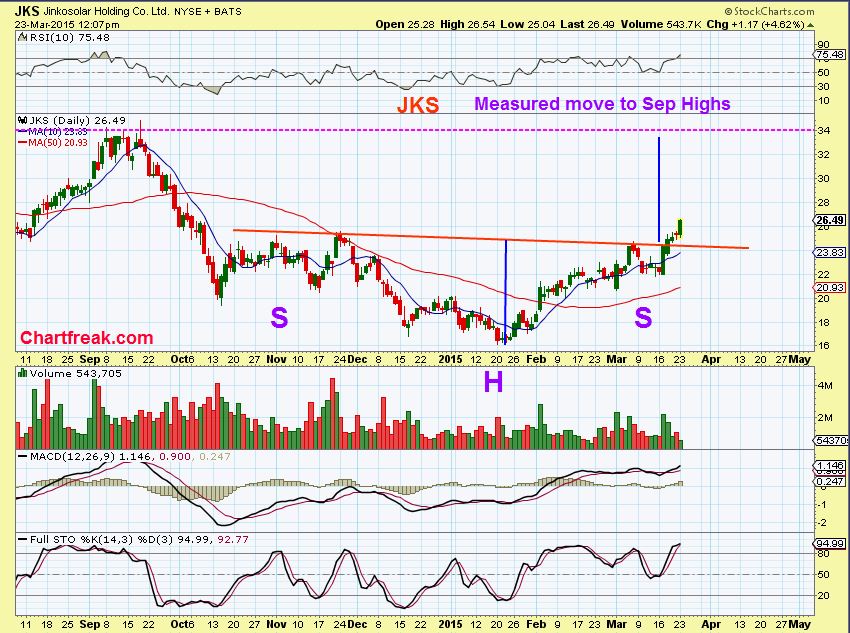
See JKS, JASO, TSL, CSIQ, and YGE & SOL are in bases.
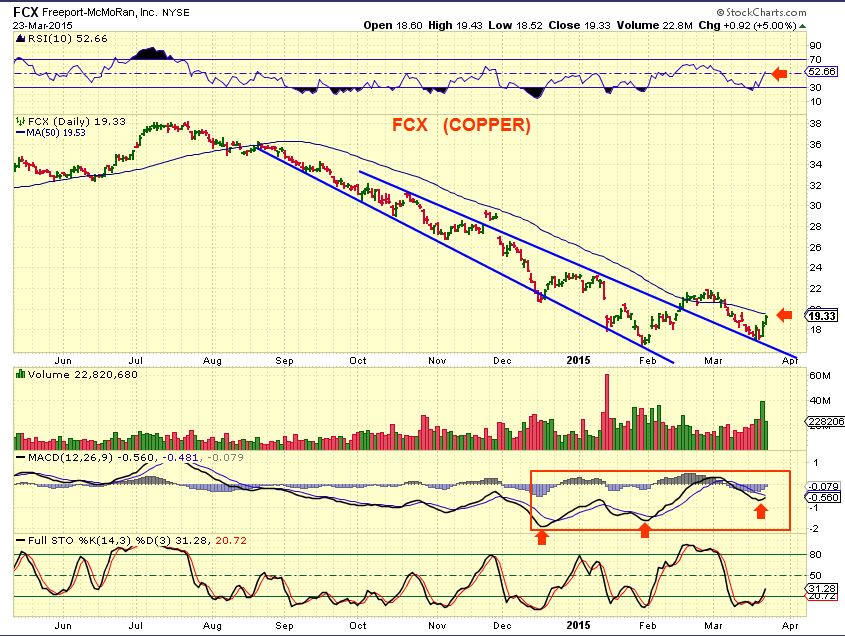
Have you seen a COPPER chart lately!
FCX looking good. Nice divergence at lows.
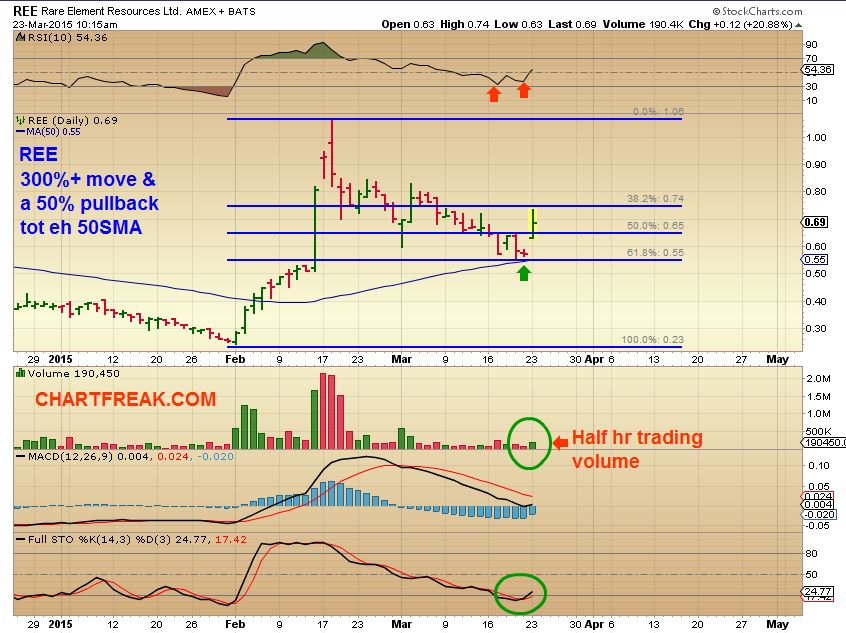
REE- volume ended strong over 679,000
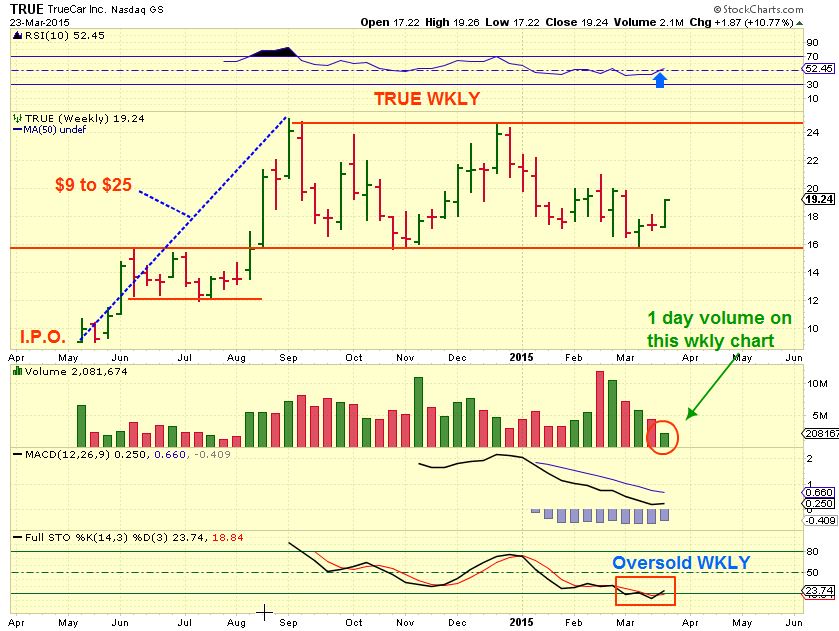
TRUE Wkly – True is a nice daily chart , but I sent a friend the weekly to show a huge channel . A break out above $24 area could lead to a nice run.
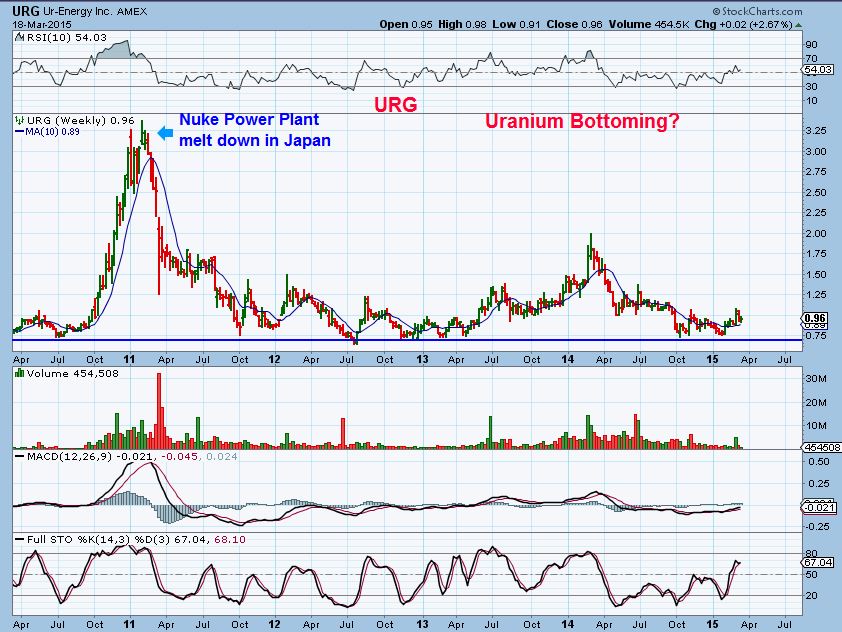
URG ( Uraniums bottoming)
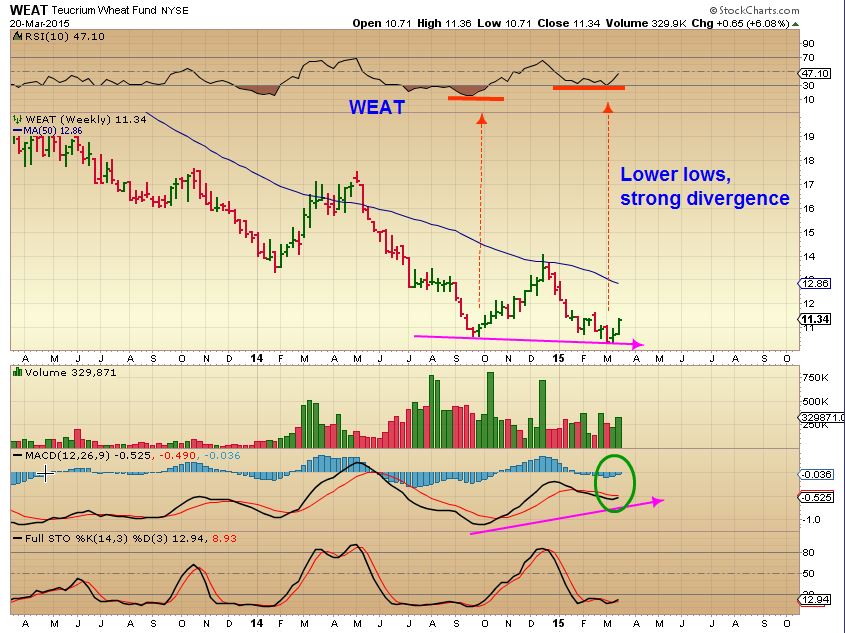
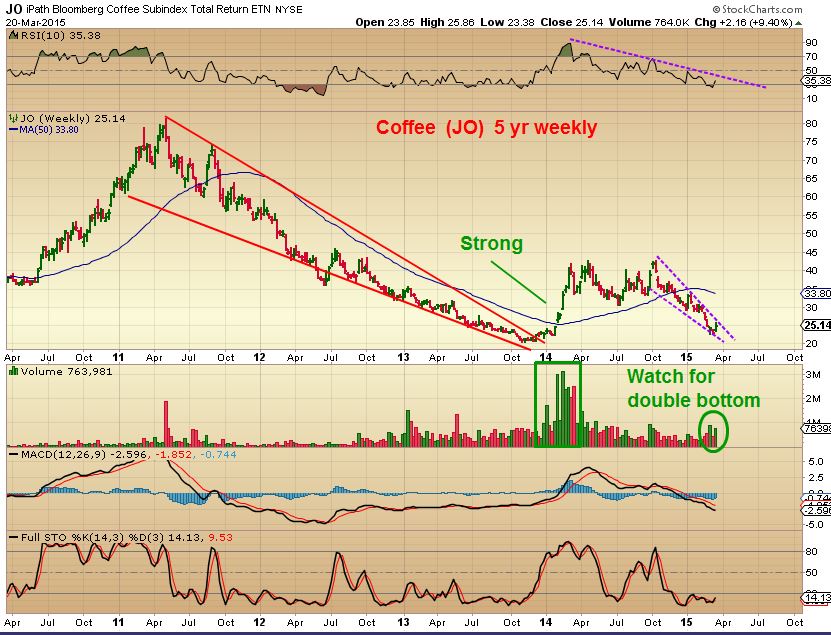
Commodities bottoming? CRB and DBA . This is WEAT And JO
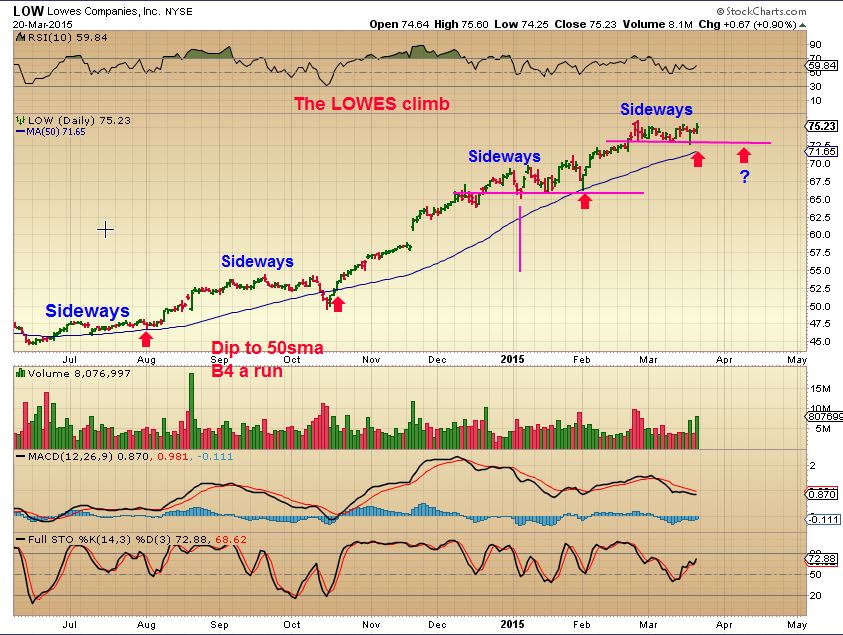
LOWES – Let it pullback & come to you at the Magenta line (Stop below the 50sma. It has held it since Oct). SO far this uptrend makes it a long term hold for those who want one, with a rising stop under the 50sma a bit.


Alex,
Some food for thought.
The rally in silver has broken it’s intermediate trend line. That usually indicates an intermediate bottom. If silver has formed an ICL then gold probably has too.
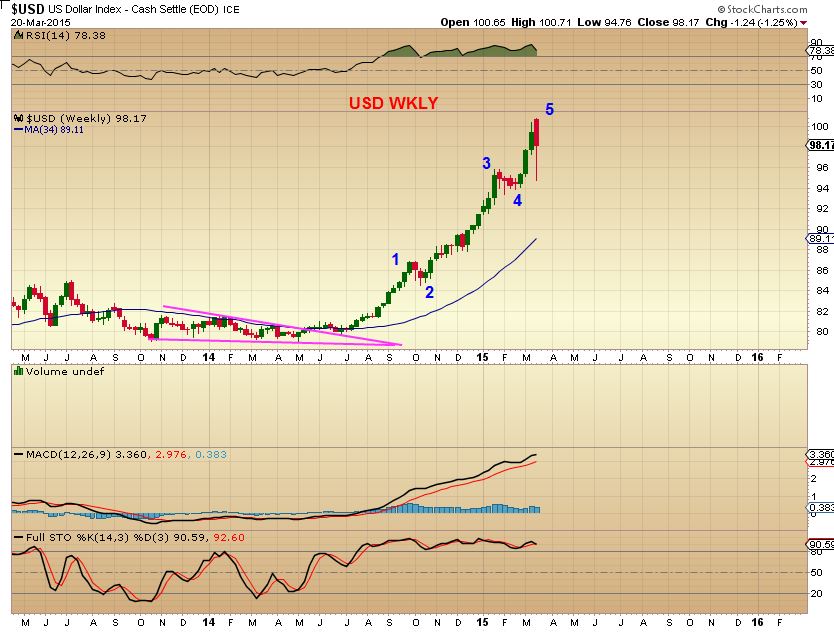
The dollar has formed a weekly swing for the first time since October. Good chance the dollar has formed an intermediate top. If so then after a bounce it should form a failed and left translated daily cycle and move down into an ICL over the next 4-6 weeks. Presumably that would drive an intermediate rally in metals (and most other commodities).
That being said gold is just about to tag it’s intermediate down trend line so a brief pullback may be imminent.
So with this thinking, you are long? thx
I have pointed out in my reports that we could break the trend-line & still drop , as we have in the past. Apparently It just sets a new trend line . I dont see the difference this time, but I am open to possibilities. I think it needs more time.
.
Refresh for chart below
I would point out one cycle discrepancy in the chart above. The intermediate trend line ideally should be drawn from a cycle high to a cycle high. So the trend line in Aug. isn’t really valid as there was no clear DCL and rally to form a cycle high yet.
I tend to focus on the gold chart as it is the cyclical driver of the sector. Sometimes silver or platinum will lead the sector, usually meaning gold will follow, but the confirmation comes from the gold chart.
When viewed on gold there is no trend line break in Aug.
I would note though that the bullion banks have so warped this sector that the normal daily cycle has now evolved into a 30-45 day cycle as they stretch cycles to stop out cycle traders on a regular basis now. It’s becoming very difficult to spot cycle lows with any reliabilty anymore as there is no consistent cycle duration. I guess it’s just normal evolution. When anything works too good the market eventually takes it away.
I see what you are saying, (Cycle high to cycle high). That MAY to Nov run 2014 was difficult to see the dcl’s and so was this drop. I still see it broke that trend line in JUNE 2013, tho . thx
Due to the 2 months that passed, I would say GOLD ran up from a dcl and broke the trend line. IF someone says we can have 2 months and no DCL, , and that it really came on the stop run ( 3 months later?) – then cant one say we may not have one now , that its all part of a 3 month drop that becomes normal now ? (refresh for chart)
I started a small long positon in miners a couple of days ago. I’ll probably look to add to it when gold moves down into a half cycle low.
I asked as a gauge for your confidence and I see you are fairly confident to have a starter position (And it may be correct, that GOLD C.O.T. was looking Bullish). I had a position from the Fed mtg , but sold out when GDX got to the gap. I just want to see how this plays out – so to distract me, I am playing solars for now : )
Thx 4 Ur input
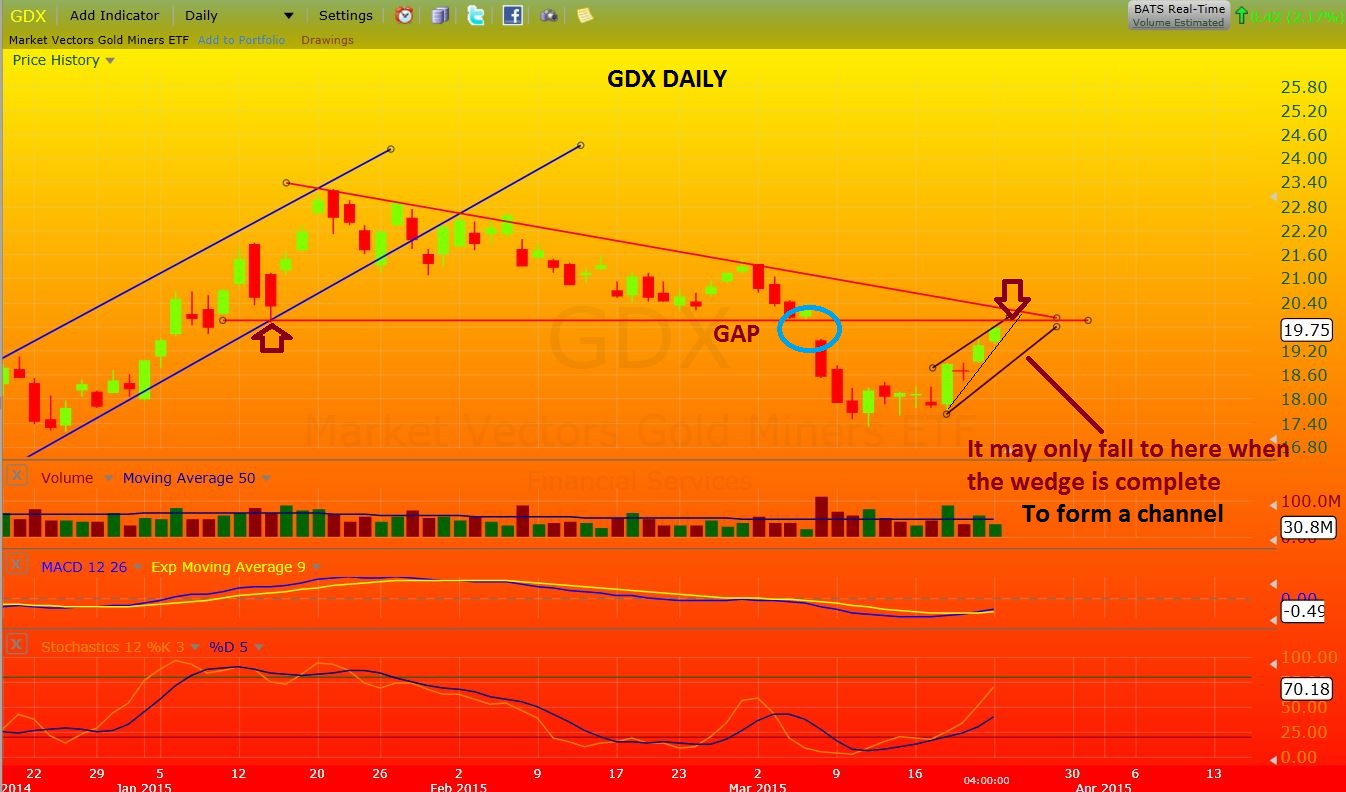
Alex, would you consider buying DUST IF GDX reaches $20.50 area an starts to sell off?
“It could be a wedge pattern too, if it doesnt break out higher fast through overhead resistance at $20.50ish. How it drops will be telling too.” -ALEX
HHHMMMMM ,
In my personal trading account I consider many things, because I trade for a living. When I point out a wedge pattern in GDX, yes, it will be in NUGT too, and the ‘trade’ could be to catch the drop, but that is only for traders in front of a screen constantly. A 3x ETF can turn & run fast against you. You can lose 20% in a day .
So that said, I wont recommend extremely high risk trades on here , because I have found that I get emails asking me to guide readers through the trade , since I mentioned it. Realistically – I need to watch my own trades at times when the markets are live too, so with a 3x ETF , it isnt possible for me to trade & post alerts. So I Hope you understand
( And can read between the lines for that answer : )
ALSO….It may turn earlier that $20.50. I drew this at yesterdays close for myself ( refresh for chart)
Alex, yes I can read between the lines. I agree, anyone trading 3x ETFs need to be in front of the screen most of the day with stops set for protection.
How confident are you that this is a 3rd or 4th daily cycle with GOLD?
Oh, Tough question. They always act bullishly and make me doubt it. The Silver C.O.T. doesnt look like the real lows, but I cant just go by that. I am 75% leaning towards another drop .
Alex, always a tough call trying to figure out when to leave profitable positions. With OIL at the top of the channel (see chart), would it be a risky move to sell here and buy back when it retraces to the lower leg of the channel?
I’m not sure what your trade is, but I always take some off the table if I went in heavy (ish) at lows . I skim / scalp as a trader.
Like I had a position in UWT under $2.00 from the OIL drop March 17. . ( I used the chart below attached for the trade) . I sold 1/2 of that position yesterday – UWTI went higher today, but I cant worry about it, I lock in something so that the trade wont go against me later and I lose all my gains.
My trade is the energy stocks we are in. Myself I am in RES, EXXI, SFY, BAS, RIG. Rig is more of a buy and hold. But they all trend based on oil. Not sure which drives them more, WTI or BRENT? So, I look at the price of oil to get an idea on the legs on the energy stocks.
Gotcha . Then I dont know about your first question, trading out for a drop to the lower trend line. Not sure that will or wont affect your stocks that much
CSUN popped last two days after it was recertified for NASDAQ. Actually had a bid a little closer to the 50DMA but now has run away. Up 30 cents since the news came out.
I know, Bill was asking about that and I said it’s on the 50sma, safe buy with a tight stop, but I didnt buy any. Nice move, I hope he got some.
Nope, I let it go…….ouch
I like the chart of TWTR again. I recommended it at $40 (And didnt buy) , now its breaking from a nice base. Looks Bullish
TWTR and FSLR look alike? Really?
Hey , your right, like Cus & handles twins
Stopped out of SFY and RES. BAS is a monster, EXXI looks like it wants to roll over and die like SFY did. Alex, I’d like to put some of my stopped money to work. What do you like here? I was thinking FSLR? Hasn’t taken off like the other Solar companies (boy I was right about CSUN but didn’t take the trade, wow). FSLR looks to be breaking out of consolidation to continue AB=CD pattern. Recommendations currently?
I am searching, but I have also raised Cash. I am looking for something , but trying to be patient and find something “Special”? : )
I am in SOL again, but it was a couple days ago. I was going to go with YGE too, but they have earnings tomorrow I think.
I do like FSLR breaking higher here. It may or may not go straight up from here, but the break out looks legit.
I like special!!!! I find it so hard to sit in cash………….
I JUST WANT TO ADD– The mkts are a bit tricky. I see some good looking charts Breaking out big time, others falling apart.
See DGLY, OVAS, TWTR, ORMP, vs WLL JRJC, HPJ
Important not to step in front of earnings reports in some of these.
Uranium stocks? Look to be bottoming. I think URRE has bottomed and a tight stop can be placed. What do you think of URA? I like the harmonic patterns (see chart). Seems to be starting another leg up. Could just go sideways?
Maybe, but light volume right now .
Volume picking up in URA
$URA – http://scharts.co/1HGHpjX
SSNI was on my list . Bought at $10 a few minutes ago
I joined you! Software company? That pattern looks like TWTR and FSLR as well.
Yeah, Even the weekly is a tight pattern, which is good. I’m not marrying it, but it can run when they break from these patterns. If it acts correctly it will just run right to $12 with no down days , just like the mid Feb run up.
I was watching RCON and it ran to $2, but volume was too light…then it just exploded to $2.50 in a minute. . missed that one
CDXS – pop
Pharma Rolling over? Energy CVI and DQ resistance and multi tops?
FWIW,
I picked up some BP this afternoon when it tagged the 50 dma from above. Might be a possible long term buy ? Stop below the 9 dma.
Your stop is probably correct, because I can see a gap there that it may fill , if it drops below the 50sma. Hopefully if it does, its just a quick dip & reversal back over.
Yes….I saw that too. 🙂
Thanks Alex.