Not a lot has changed from the weekend report, so lets review the charts.
Nasdaq March 2
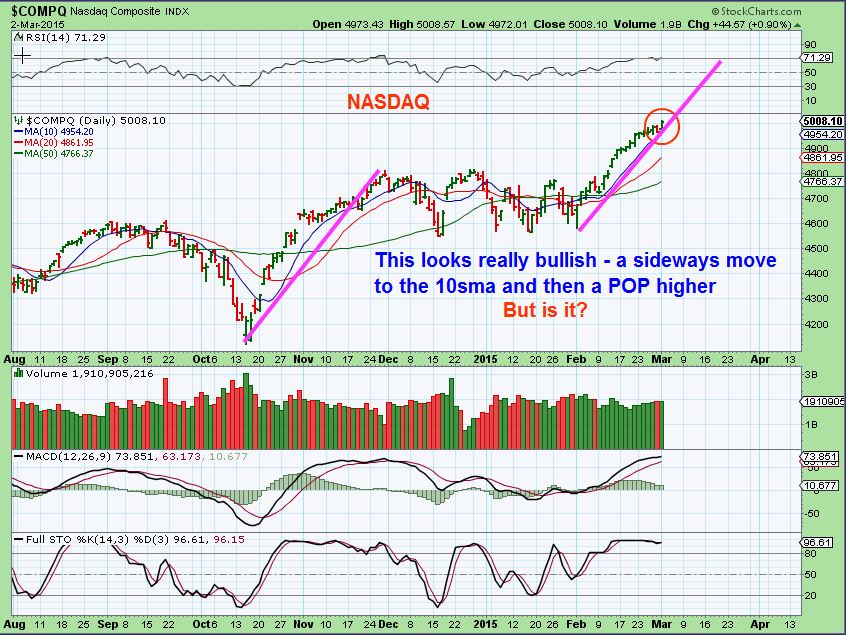
Certainly has had the bullish follow thru that I expected, right to 5000. Is it going to continue though?…
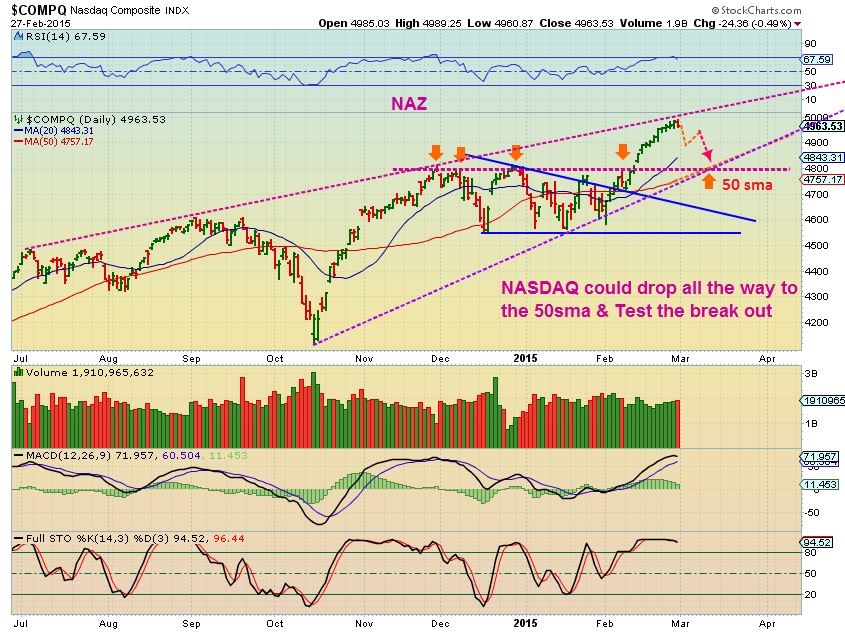
It can. I posted this wedge in the weekend report. It shows that we are at a point of interest, that makes it difficult to discern immediate future direction. It is at the upper line, so it can drop from here, or continue to climb upward along the upper wedge.
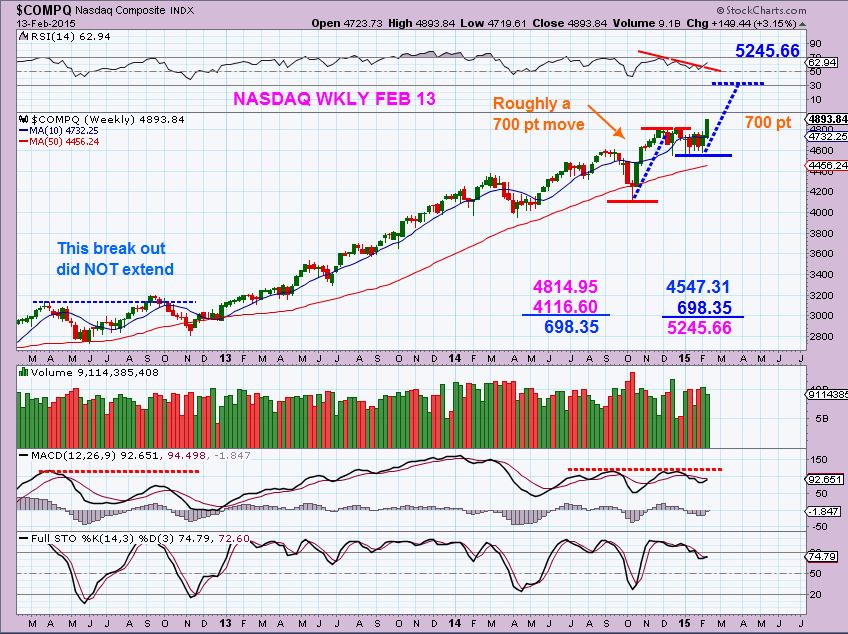
When the NASDAQ broke out from 4800, some doubted my target of 5200 when I posted this measure move. I think it is still possible, but there can be pullbacks along the way.
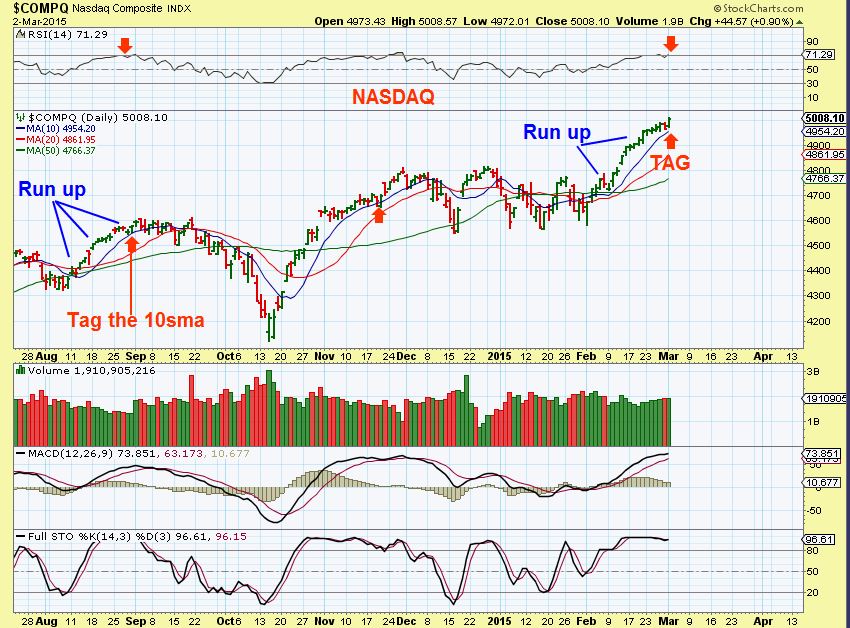
Zooming in on the NASDAQ , we see the short term possibilities of “Choppiness” . In the past , we did something similar to now and while the set up is quite Bullish, it got choppy. See the left side of the chart Aug 2014. Orange arrows picture where we may be now.
1. The run up
2. Drift to the 10sma ( orange arrows)
3. POP and chop
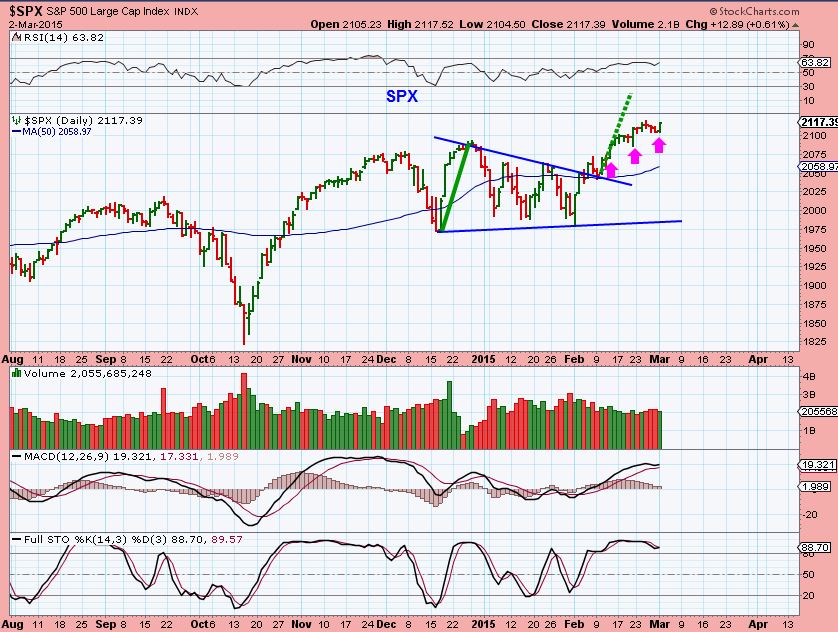
SPX – also quite bullish
$GOLD – I expected a low, but warned that it could be weak. Maybe 10 days running up & possibly rolling over. Keep in mind that GOLD seldom runs straight up, so why expect it? Expect choppy runs. The prior low, choppy or straight up? See below…
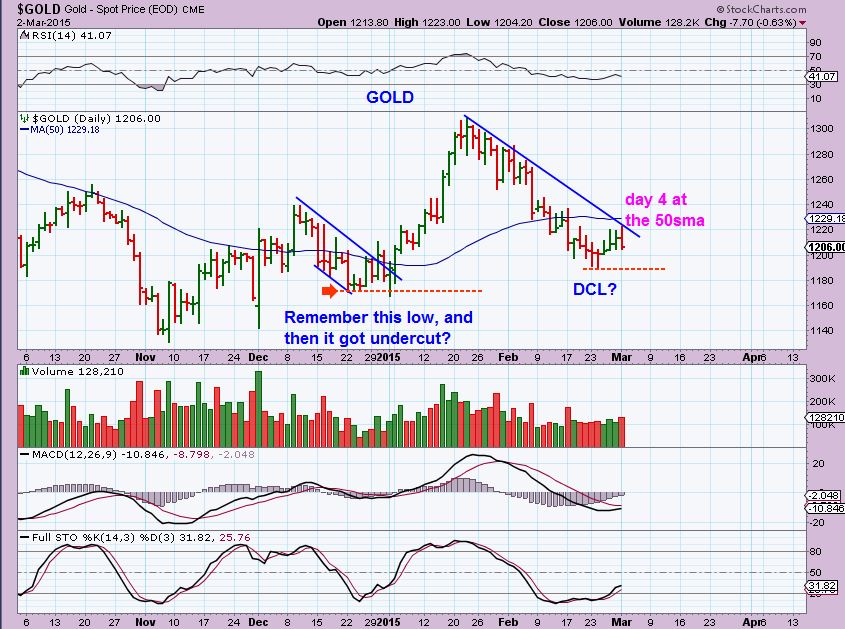
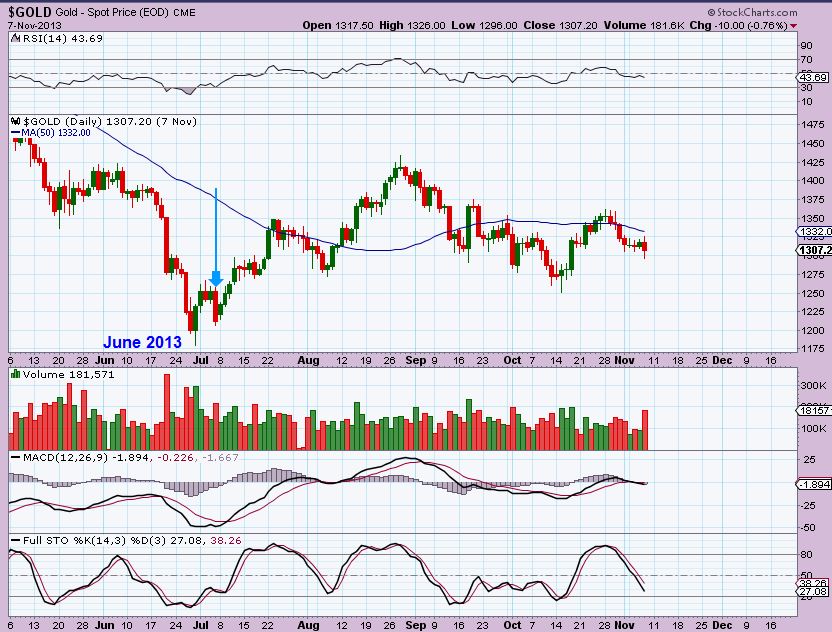
How about the JUNE 2013 low, straight up, or was there a choppy slam down day to panic everyone? Sideways & DROP.
GDX – yesterday after just 1 day down, I got an email ( Not a reader, an old friend) that GDX is obviously weak and he was going short for 3 weeks. Bought DUST at the end of the day. I understand the feeling, he might be correct, but waiting for follow-through is prudent.
One day down is not a market. Its still above the 50sma. We have seen a slam down after a low before (Blue arrows). Its important not to get too emotional, let the mkts speak & simply HONOR STOPS.
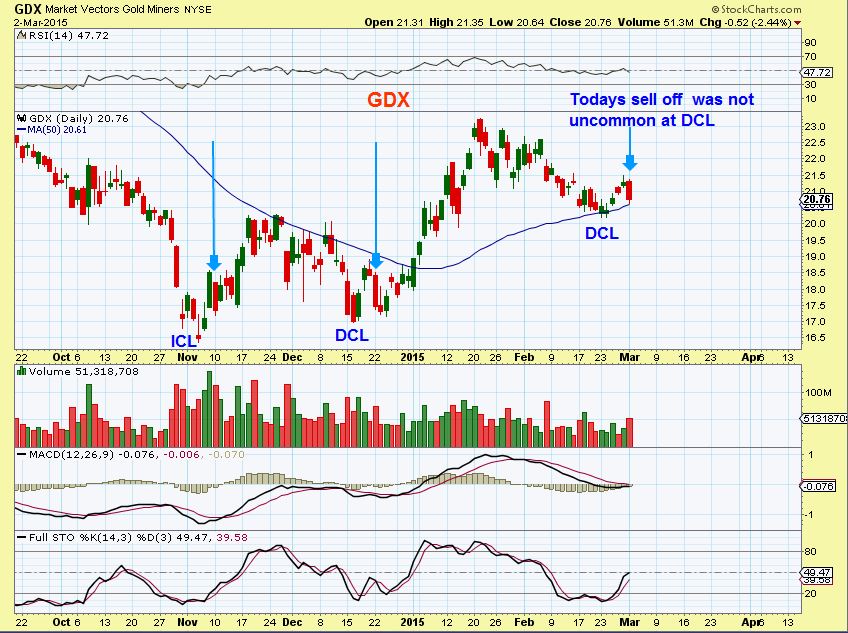
I am expecting a great buying opportunity in Miners this spring, and I think this is a bounce that may only last 10 days out of that low. It will suck in many long traders and we get a final drop to the real Buy, the real meaningful lows. Traders can play this any way you want, I am interested in watching how things unfold.
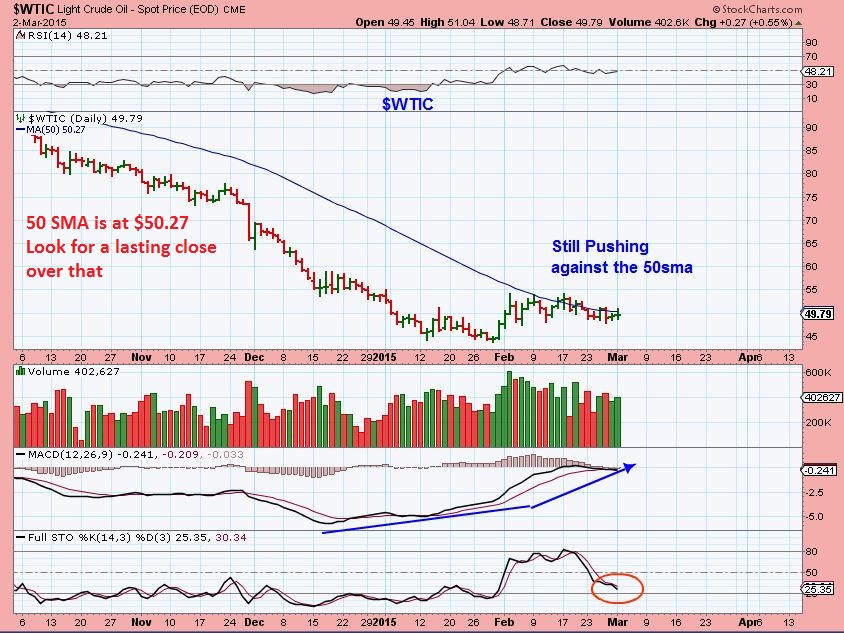
$WTIC – still pushing that 50sma. I like the set up (As mentioned in prior reports)
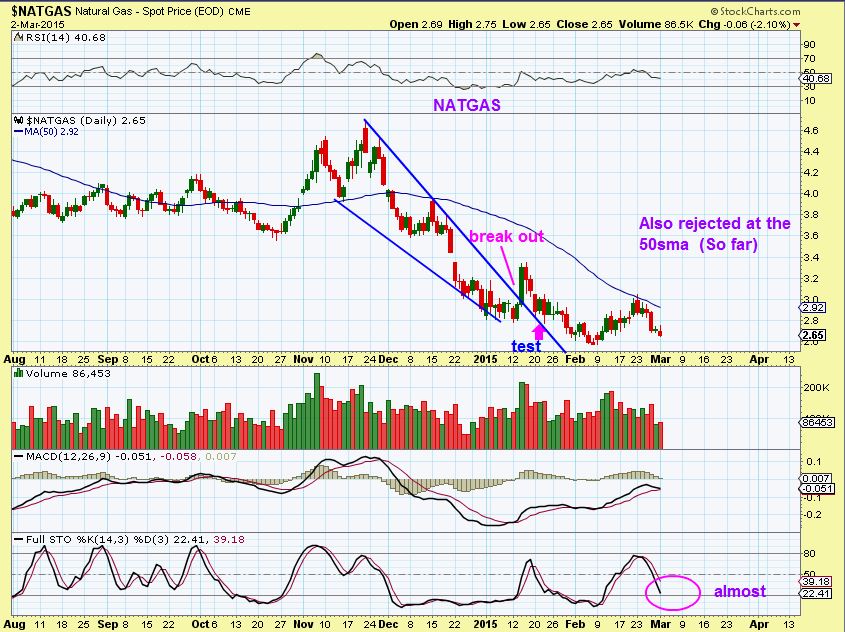
NATGAS – still looks to have bottomed, but it is still bottoming. Double bottom?
SOLAR STOCKS put in NICE reversals yesterday. YGE, JKS, TSL, JASO , SOL, etc etc VERY INTERESTING SET UPS.
I want to add a LESSON here. Read it later if you dont have time now.
I have been investing in some low priced stocks that are beaten down from much higher prices . EXXI, REXX, GDP, etc were once $20 – $30 stocks. They can recover in time and it is a process. I often trade these types of set ups out of “Bases”, I get the quick %-Gains and then they often consolidate and base out again at resistance. I want to show this to you here.
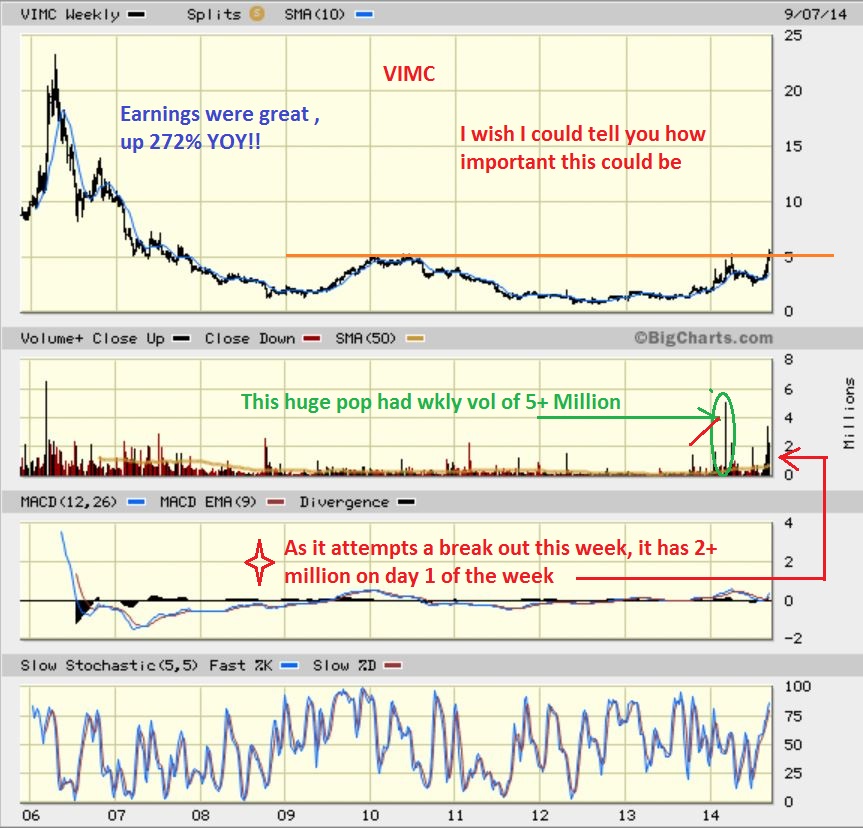
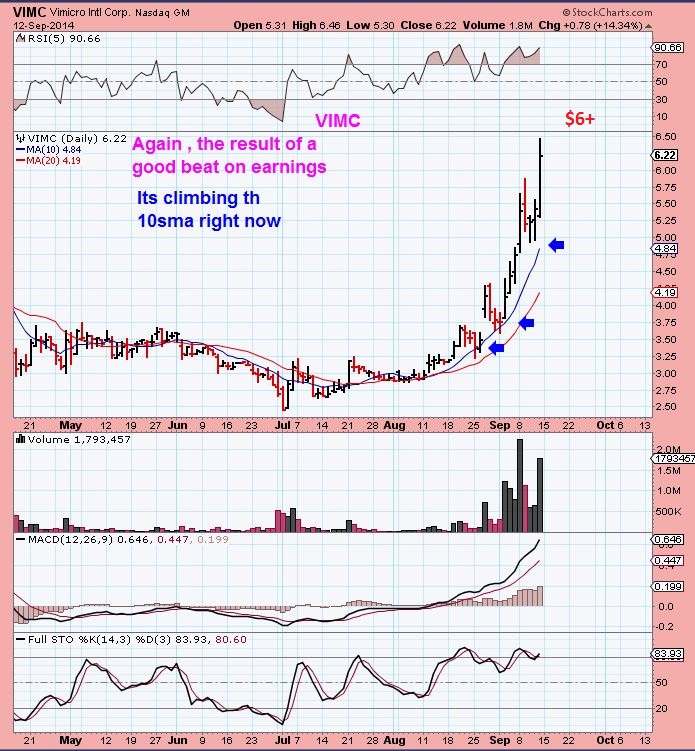
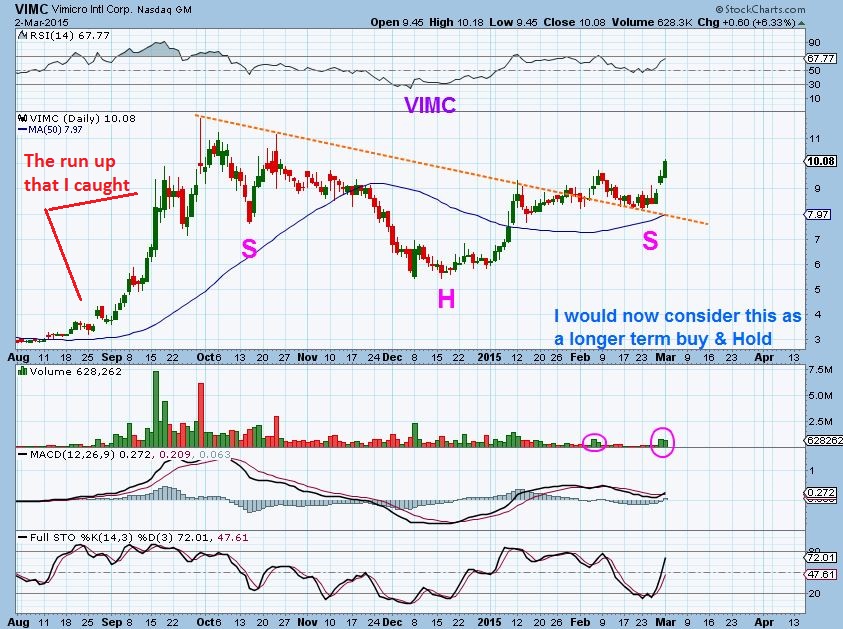
If you have been with me since last Summer, you may recall many LONG BASES that I wrote a lesson about. They are explosive at times AND I posted this about a company VIMC that I was trading. I Bought it near $3 & repeatedly bought it to $10. Lets review those charts. THIS is how I feel some energy stocks may recover…
VIMC LONG BASE / VOLUME
SEPT 2 – our 2nd BUY AT $$3.60
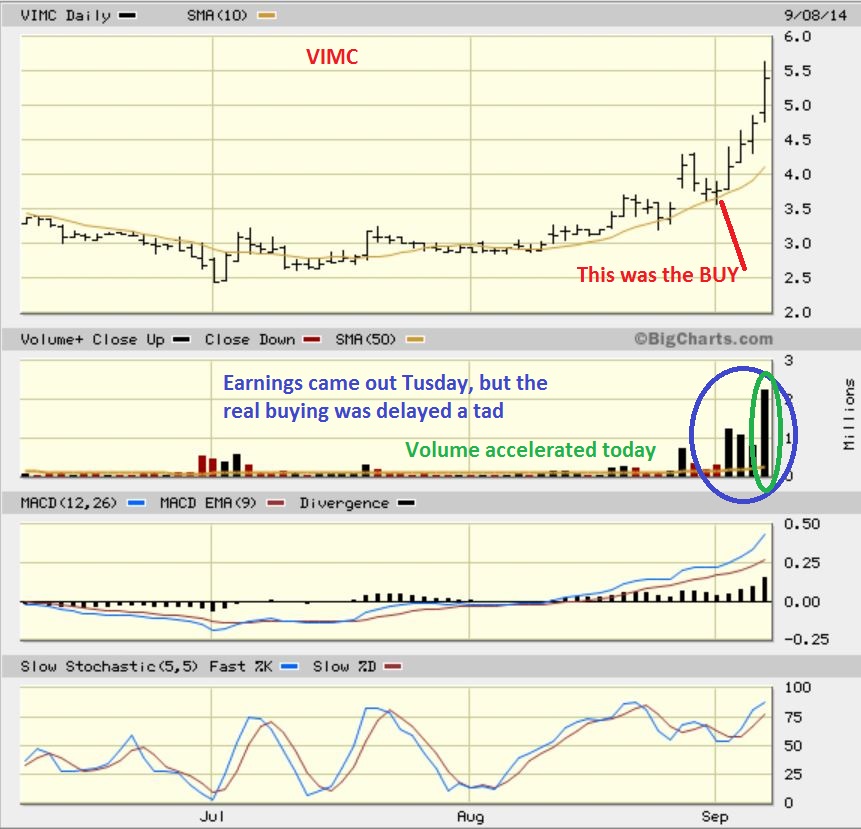
SEPT 12 – hits $6.50
Sept 16 – hits over $9
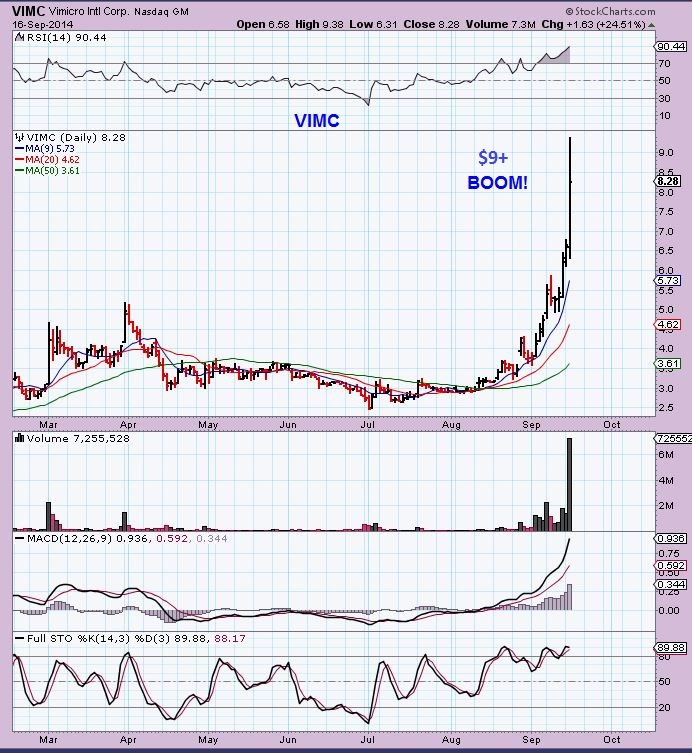
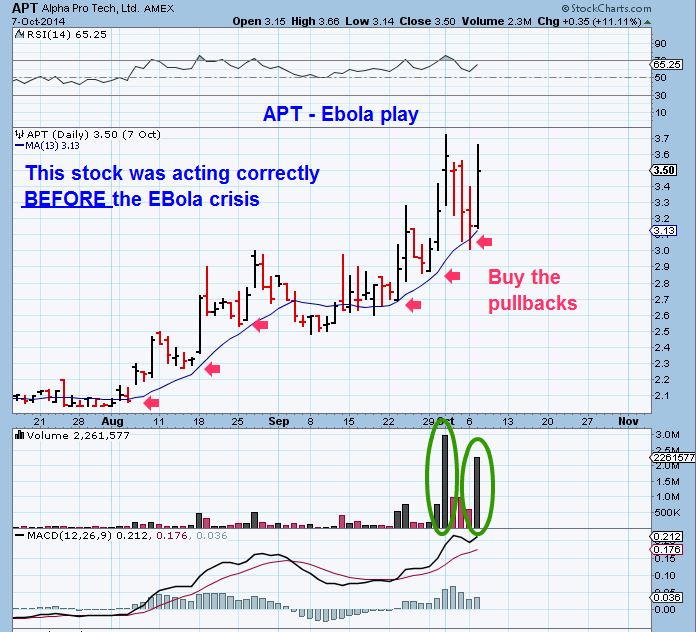
These explosive moves were coming out of oversold , beaten down conditions. You may recall that I traded APT, LAKE, etc in OCT and got the same rocket ship rides.
APT OCT 7 ($3.50)
APT OCT 15 ($10)
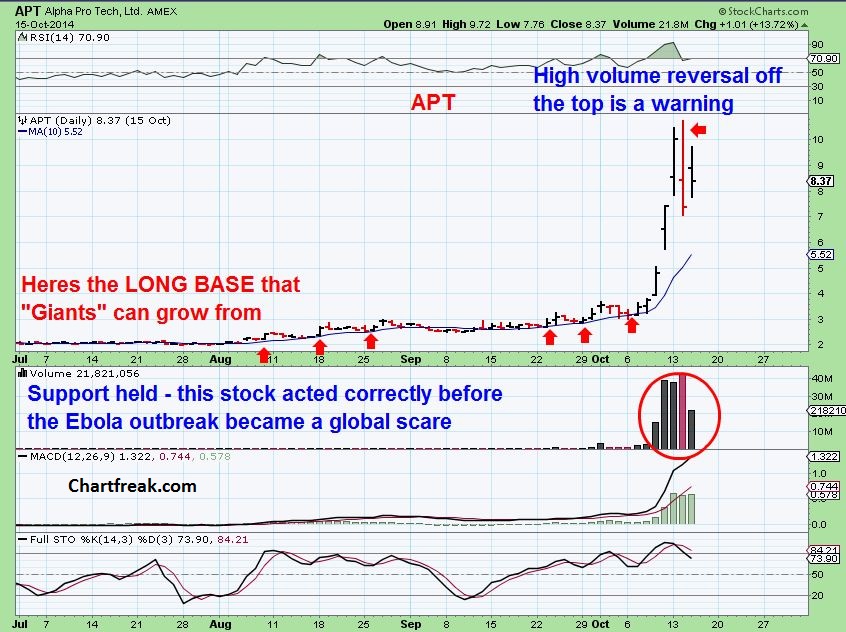
This is why I have stayed with some of these energy plays. I dont think they will have THAT kind of recovery YET, but they are in a recovery mode and gains have been 40% 60% almost 100% already. They may be in that “Base Building” stage, so sideways action can occur too. I have often made great %-Gains from recovery sessions and if OIL gets to $70 again? Some of these energy stocks will continue to recover. Right now I go by the charts, the set ups are still bullish (So far).
What happened next for VIMC? It sold off and discouraged everyone ( But if you keep those on your watch lists & check them again and again, and they are really healthy again, you can find this).
VIMC- after the run up & sell off all the way back to $5.50…it is a healthy bullish long term set up
I just wanted to use this time to show you what I have seen in years of trading the markets. WHY am I interested in a basket of energy stocks here? They were possibly overdone on the beat down. New hysteria was reporting that OIL was going to $20 or into the teens, so everyone bailed on these companies as if they were going bankrupt. Emotions and panic caused a fire sale. IF oil recovers to some degree, some of these will too (others may remain weak). IN DEC I was buying up the beaten down MINERS and some went up 70-100+%.
SO most of the time I am looking for Shorter term Quick %-Gainers. At other times I do look for value . Recently CY, TSEM, ONN, TWTR were ready to buy & hold. (CY still is a good set up right now) . Some set ups appeared in Stocks like TWTR, FB, MU, MSFT, FNSR, AAPL, etc , but those are for longer term buy & hold under the right conditions, and I find that (most?) readers here dont want to wait for those to break out. They dont want to sit in a stock and wait, they want action. IF YOU ARE looking for a longer term set up, email me and I’ll see what I can do, but they may chop , drop, then pop. They are a different set up. ( again, CY looks ready now).
~ALEX
What’s On The Radar? 
 Whats In A Number?
Scroll to top

Well said Alex, you become (are) a golden teacher !!
Thanks for this report.
Thx Geurt
Thanks Alex, your lessons to those of us still building a trading base are appreciated. Any thoughts on GEVO and AKS? I own both and still like GEVO’s setup. AKS still seems in base building mode, I’m willing to be patient with it. Still own utilities too and tho those have been hit by rotation into tech and biotech, the dividends help to offset the short-term weakness.
Hi CS
Gevo ran up pretty strongly and appears to be flagging . Thats often a consolidation for the next move up.
I liked X & AKS last week. AKS had a strong bullish mark at recent lows. It couldnt get above the 50sma, but may try again. ( Hopefully not a double bottom first)>
.
Alex…. where is the support line of SLW-T ?
I own it, it sold off severe this morning.
It broke one support , has double support near $25
Another bought deal financing as with GDP yesterday and URRE today. I lost on URRE and am out. If we are on a short up cycle here on the miners it probably won’t recover much before the next down move. Good stock long term if silver ever gets seriously going again.
I took 1000 bas yesterday and 1000 szym and I am slightly ahead since bas is gained more than szym lost. Just trying to get a handle on how these stocks work.
Bought SZYM yesterday as well. Seems like there was a big seller at the open yesterday and today.
Well just hit it’s 50 DMA. My stop is below here a bit. Any thoughts on this Alex ?
I wrote about SZYM to Marinho (& missed this one). It dropped below & recovered so far. I still like it.
Was it you asking about rare earth during that run up? Did you see REE pullback to, then reverse & close above the 20sma yesterday, and take off today? I missed it again.
Yes. Saw it. They have been moving crazily lately.Actually hold on to the REE I bought on the pullback and added a small position in AVL. That one doesn’t move as fast. Not sure if they will hold.
Actually, the long base was the positive for SZYM, but it is dropping to the 50sma right now on say a 2 month base. I think it will find support there, since earnings are already released. I own it too, am thinking of possibly adding more IF IT tags the 50sma and closes above as support. If it breaks down& closes below, it could return to the bottom of the base and keep basing : ( so I am watching it.
I think it is time to buy GDP again, usually the low is the second day after the announcement. Alex, support on it?
I do…it is doing the normal tag of the 50sma, which lately always happens after a successful break out . I have been saying that BAS, REXX, EXXI, SFY, GDP are my favorites. Still a good group.
Alex, FYI a name you mentioned a couple of weeks ago looks very interesting here, ERF. It just broke the 10 day SMA after a correction following a run from $8ish to $11.50 and down to a successful test of the 50 day SMA.
Also Alex, what do you think of WRES, I still have 1000 shares, very little at a 20 plus percent loss. It is approaching all time lows and could be a good buy if there is some follow thru on these energY plays
Hey Marinho, I was in WRES also. It’s been a big loser, I dumped today at -15%. Put that into GDP on its rebound instead. Even if WRES rebounds off spt at lows, there just looks to be better plays in the space. I can’t believe with as well as everyone has done in this sector, I’ve managed to still lose money. Sheesh.
Good post, Alex. For those of us who are looking to put larger sums to work (too hard to trade), how do you think xle looks to take the place of the smaller energy plays? Or fcg for nat. gas?
I think the XLE has been acting correctly.
I was going to put it in tomorrows report. This is it currently.
FCG is acting better than NATGAS, but very light volume today . I dont like that, but it can pick up..
Miners close to a double bottom? The trend lines would have us think so. Could this be the start of the 3rd cycle. $13.63 looks perfect for NUGT. GDX is similar around $20.29
I don’t know, Bill, the count is just way, way too late for 3rd cycle to just now put in a low. It should have held from last Thurs, and gold just cannot get going. As soon as it us up it gets sold immediately. I mean with NAZ at 5000 everyone is doing a happy dance (and selling gold). I think you are right, this should rebound. But it just hasn’t. I was absolutely shocked Monday when it all rolled over. Just don’t see a risk/reward to being long here (sorry, meant to keep comments short and got carried away, just sharing and feel free to ignore).
HUI now below 50 DMA. Do you think the 3rd cycle, what there was of it, has failed? Or do you think we’ll get the C of an A-B-C move to finish it?
It is really just a guess at this point. It could even drop down quickly, reverse higher, and make a new dcl instead of the other day. Thats a little why I dont get too excited about these 3rd & 4th daily cycles. This one is unclear to me –
I am out except for AG and PZG that I picked up last wk. Not thinking I’ll hold them much longer either.
If your still holding here I wouldn’t sell. This should rebound. If you get a waterfall sell off in the morning then thats something really wrong. Might get NUGT down to $13.50 then we should get the rebound. Remember me talking about that trend line at $16.00? You can see it above. Much clearer on NUGT than GDX. $15.20 the next target.
Alex or anyone, I don’t see why you think WTI (chart from above) is ready to break out! The MACD looks to be heading lower and crossing, the STOCH isn’t oversold yet, and there is no movement above the 50SMA?
Good point, that is why I am not trading WTI, only the energy names CF recommended in hopes they break north again soon.
After a deep sell off, the 50sma is always pointing down when it is broken above. Look at GDX, CDE, NG, on a 6 month chart. Everything you said above applied to them in Nov/DEC . They broke higher.